Summary for week of January 24 – 28
- Stocks vulnerable to declines as Saturn turns retrograde this week
- Dollar set to rise into midweek, with gains fading by Friday
- Crude may fall significantly this week on Mercury-Saturn aspect
- Gold to stay weak as Sun moves closer to Mars
Summary for week of January 24 – 28
- Stocks vulnerable to declines as Saturn turns retrograde this week
- Dollar set to rise into midweek, with gains fading by Friday
- Crude may fall significantly this week on Mercury-Saturn aspect
- Gold to stay weak as Sun moves closer to Mars
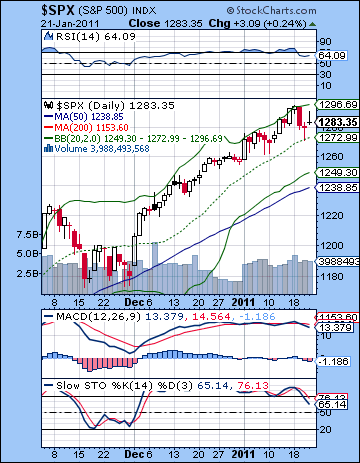 Stocks were mixed last week as possible rate hikes in Asia were somewhat offset by more positive earnings news. The Dow rose by less than 1% to close at 11,871, while the more broadly-based S&P500 lost almost 1% at 1283. This mixed and slightly bearish outcome was mostly in keeping with expectations as I thought we would see some early week upside on the Sun-Jupiter aspect. Tuesday did indeed see a small rise to 1295 on the SPX but the bulls threw in the towel after that as Wednesday’s decline corresponded nicely with the problematic Mars-Ketu aspect. I had wondered if Wednesday might see a reversal in sentiment and that is pretty much what happened, although there was precious little intraday upside. Thursday was largely bearish as forecast, although the market recovered smartly after mid-morning lows and finished almost flat. Friday’s modest rise was somewhat at odds with expectations, although it was nothing too serious. So while the Dow rose partially due to IBM’s stronger than expected earnings, the market is looking increasingly fragile at this point as the S&P bounced off some fairly strong resistance around the 1300 level. So while the market has drifted higher after the early January solar eclipse, the inability for the broader averages to make new highs last week suggests that maybe, just maybe, Jupiter is running out of steam. As the bullish planet par excellence, Jupiter’s conjunction with Uranus on January 4 increased the possibility of a near term correction. That hasn’t happened yet, although the odds increase with each passing week. Jupiter-Uranus has not only fueled the rally since August, it has also created an inflationary environment in many emerging economies where in-flows of international hot money have wreaked havoc with local prices. Preliminary attempts in Q4 2010 in China and India to raise rates and banking reserve ratios did not have much of an effect to solve the problem. Now that Jupiter’s froth is looking a little less bubbly these days, we may see a renewed commitment by central banks to stem the tide and slay the inflation dragon once again. This could mean that either rate hikes will be larger than expected or that investors may react more nervously to whatever measures are announced. With Saturn set to step into the limelight this week as it turns retrograde, we may see a rise in caution and prudence that upsets the status quo and takes the shine off of all those optimistic forecasts and government data. Saturn also governs regulation and constraint, so we are also more likely to see new initiatives to rein in spending or regulate economic activity in meaningful ways. In any event, it looks increasingly that the S&P won’t quite get to 1300 here as the correction seems to be imminent.
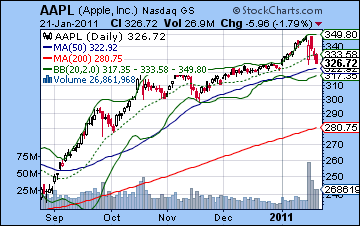
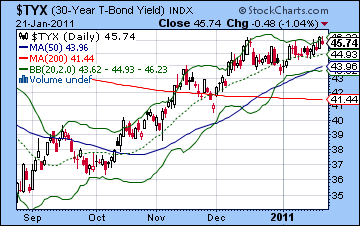
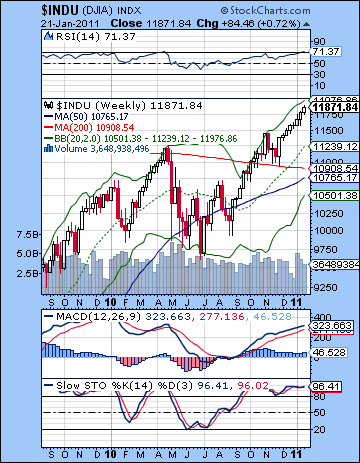 We got the first taste of a correction last week as the SPX touched the 20 DMA on Thursday morning. Of course, 1270 doesn’t count as much of a correction at all, since pullbacks to the 20 DMA were fairly common during the big run-up over the past few months. Is there anything that makes the current situation more technically vulnerable to a larger correction? Not necessarily, although the close proximity to the resistance level from the top of the rising wedge would suggest that further upside is very limited in the short term. The indicators are also equivocal, although there are some warning signs there that should not comfort bulls. MACD is now in a negative crossover and still in a bearish divergence with respect to the November high. But that isn’t so unusual since we got a similar situation in late October ahead of the November correction. Of course, that didn’t turn out to be much of a correction at all and only returned prices to October levels. RSI (64) has fallen from overbought levels and this also mimics the November situation when we got a mild 5% pullback. Stochastics (65) are falling here and have a ways to go before they hit the oversold level. But during this extended rally, this has not been a reliable indicator. More bearish is the weekly Dow chart. After eight straight winning weeks, the odds are mounting for a pullback. Price has risen to the top Bollinger band line and RSI (71) is again in overbought territory. It’s ripe for a correction here. Weekly MACD is still in a bullish crossover and Stochastics (95) are way overbought. This is not an enticing picture for a bull thinking of committing new money to the market. There is just very little obvious upside in the medium term. More ominously, bellwether Apple suffered a decline last week as CEO Steve Jobs had to take a medical leave once again. This decline came despite very strong earnings and may well be another indicator of the market’s shakiness. If Apple continues to fall, then the market may not be far behind. Meanwhile, yields on the the 30-year treasury continued to climb in the face of the Fed’s buyback program that strives to keep rates low. It still has a little room until it hits its previous high of 4.80%, but there is a risk that yields are rising too fast here. If they get high enough, bonds will become more attractive than stocks and this could spark an exodus out of equities. Overall, then, the technical picture seems to favor a correction. However, it is important for bulls that 1260 or so can hold on the S&P. This will keep the support from the rising wedge intact and will allow bulls to spin their tales of recovery and government liquidity. If the wedge breaks down, then we could get to 1220-1230 quite fast. This was the previous November high and it may act as support to bring in new buyers. This would only be a little below the 50 DMA of 1238. After that, 1130 could be the next major support level (the old June 2010 high).
 This week will be very important in terms of gauging the extent of the correction. Saturn turns retrograde on Wednesday while in bad aspect with Mercury so that ought to send prices lower across the board. There is also a possibility of a large move down here, at least so that the support from the rising wedge is in jeopardy. The week may well begin negatively as Monday will see Venus in a fairly close aspect with Saturn which may restrict buying and Mars will be in aspect with Pluto suggesting tense situations involving the exercise of military and government power. While neither of these aspects will be exact, there is still a good chance that the market will trend lower, if only because Mercury will be moving into position for its aspect with Saturn on Wednesday. Tuesday is much the same story, as the Mercury-Saturn square will be that much closer, although without the other possible negative aspects. Wednesday will see Saturn turn retrograde early in the morning but the Moon will be in tense aspect with the Sun and Mars for much of the trading day so the bias will likely continue to be negative into midday. It is possible there could be some recovery in the afternoon by the close. I doubt the market will end up in the green, but it is an outcome worth considering. So between Monday and Wednesday, there is a good chance for at least two down days. We could see the market fall 2-4% although it is quite possible that it will fall more than that. A 2% fall will test support around 1260 and the bottom of the wedge but a larger fall would likely break below it. I expect that there is enough negative energy to make a breakdown of the wedge more likely. Thursday could go either way, although I would retain a bearish bias here, too. Friday is perhaps the most bullish day on paper as the Moon applies to its conjunction with Venus. Thursday and Friday are more likely to be net positive, although the week should be net negative, perhaps by a wide margin. A more bullish scenario would have a decline into Wednesday noon to 1260 and then a recovery from there back up to 1270-1280. A more bearish scenario (which I think is more likely) would see a fall below 1260 — perhaps as low as 1230 — by midweek or Thursday, and then Friday brings in the bargain hunters which could boost the market back to 1240-1250.
 Next week (Jan 31-Feb 4) will likely begin positively as Mercury (trading, commerce) is in aspect with Venus (buying, money). We could easily see two up days here and perhaps even three. Depending on where the S&P is, it is possible that this recovery will only take us back to the previous support line of the rising wedge at 1260-1270. That is one plausible scenario at least. If, on the other hand, the Mercury-Saturn aspect does not take out of the support from the rising wedge, then this bullish early week period could represent another run to 1300 (gasp!). I don’t think this is likely, but it is still possible. But sentiment should change on Wednesday or perhaps by Thursday as the Moon conjoins Mercury and the Sun conjoins Mars. I would expect the bears to prevail more towards the end of the week, although there is still a change that the week could finish higher overall. That said, it is very unlikely to reverse the downside momentum of the correction. The following week (Feb 7-11) could begin quite negatively on the Mercury-Pluto aspect but some recovery seems likely by midweek. This could well be an up week, although it is somewhat unclear. While there are some fairly clear up movements due in February (15-16, 24-25), the month as a whole looks negative. We could see an interim bottom put in in the last week of February or perhaps the first week of March. Mind you, I would not rule out lower lows in March but let’s first see how February begins. It’s possible that the bottoming process will take a while extending well into March and April. If this is the case, then it presumes a low of perhaps 1130, perhaps even lower. I do think there is a good chance for a large correction here in Q1 so it seems likely that it won’t stop at 1220. It will go lower. However low it ultimately goes, there is a very strong likelihood for a solid rebound rally into spring and early summer. The indexes could add another 20% very easily and could conceivably challenge previous highs near 1300. The second half of the year looks more bearish, however.
5-day outlook — bearish SPX 1240-1260
30-day outlook — bearish SPX 1150-1200
90-day outlook — bearish SPX 1130-1230
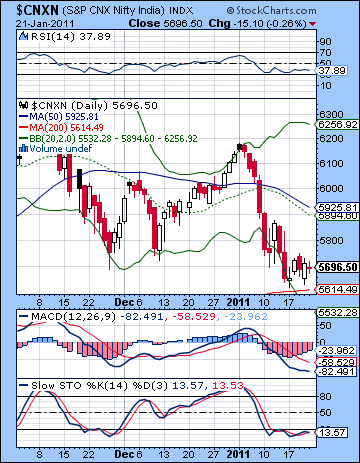 Stocked edged higher last week as a mood of cautious optimism prevailed ahead of this week’s RBI meeting. The Sensex rose less than 1% to 19,007 while the Nifty finished Friday at 5696. This mildly bullish result was largely in keeping with expectations as the early week gains arrived on schedule with the Sun-Jupiter aspect. I had suggested that Monday and Tuesday could well be positive as the Sun first aspected Uranus and then Jupiter. Monday ended flat but Tuesday saw a solid rise. I had also forecast that Wednesday may be a potential turning point as the Mars-Ketu aspect might begin to assert itself. This was broadly confirmed by the market which turned mostly bearish for the rest of the week. In contrast to my forecast, Thursday ended modestly higher, while Friday saw mild selling resume. Despite being off the mark on the last two days of the week, the net result for the Wed-Fri period was negative and that was in line with my forecast. Overall, it seems the market is moving in accordance to expectations here as the interim high of January 4 fell exactly on the day of the solar eclipse and the market has been struggling ever since. The other key factor was the culmination of the Jupiter-Uranus conjunction on the same day, so the gradual separation of these two risk-seeking planets has meant that equities have generally been weaker, along with some commodities which had been buoyed by speculative trading from global in-flows of hot money in search of higher yields. Much of the inflationary pressure felt in many emerging markets has been derived from this ultra-optimistic combination of Jupiter and Uranus. While we saw some rate hikes in the last quarter of 2010, it has not yet slayed the inflation dragon. As Jupiter weakens here in January, central banks and investors alike may be less tolerant towards runaway inflation as its negative consequences will become more keenly felt. Depending on how hawkish forthcoming rate hikes might be, the market is still vulnerable to more downside. If rate tightening is greater than anticipated, it may spook investors who will be fearful that credit will become squeezed and economic growth will be cut. This is quite a possible scenario since Saturn will turn retrograde on the same week as the RBI meets. Since Saturn represents notions of prudence, caution and restriction, it is more likely that central banks will want to err on the side of caution. Moreover, investors will likely feel the same Saturnian energy and will be on a more defensive footing. Of course, the beginning of the Saturn retrograde cycle does not mean that stocks will simply continue to fall in the short term. While a negative bias is likely throughout most of Q1, there will be some short term rallies that will keep investors guessing. Nonetheless, 2011 is still shaping up to be a mostly bearish year.
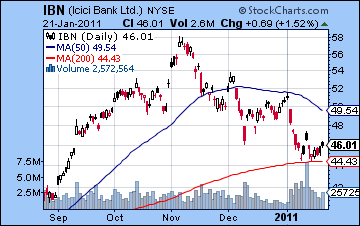
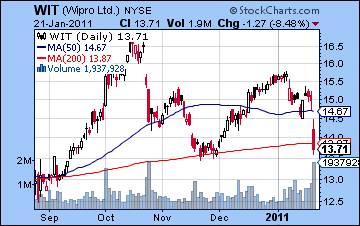
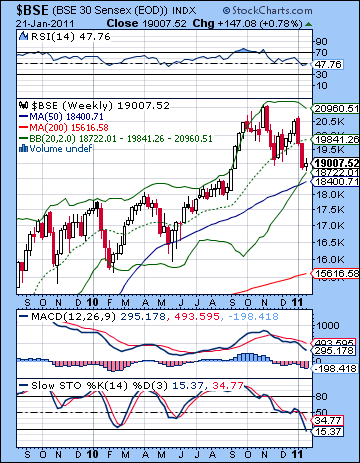 The technical picture remained mostly bearish last week as the Nifty failed to stay above 5750. While the 200 DMA (5614) was tested last week, it is unclear if prices are now at a point where they can stage another rally attempt. Certainly, such a rally attempt is possible as long as the Nifty can stay above 5620. A close below that level will make it more likely that we will see another leg down. But even if prices can stay above the 5620 support level, they will have to close above 5750 for the rally to have any kind of strength at all. If such a technical bounce should occur, it would have to then surmount the 20 and 50 DMAs around the 5900 level. Both of these lines are sloping downward now and strongly confirm that a correction in progress. MACD is in a bearish crossover although the histograms are narrowing suggesting a slackening of the downward momentum. MACD is below the zero line, so that offers another piece of evidence to support the idea that a bounce is possible. Stochastics (13) is deep into oversold territory and this may further reduce the appeal of any short positions. Price appears to have already bounced off the bottom Bollinger band and may be looking for direction higher. The weekly BSE chart offers arguments on both sides. Bulls can rightly point out the retracement all the way down to the bottom Bollinger band at 18,700. This could offer some soft support as it has done in past corrections. The difficulty is that price still would have to fall to 18,400 to test the 50 DMA which has also been a good source of support. So that’s a bit of split decision. Stochastics (15) are now in the oversold territory and therefore it is more likely to attempt to rally from here. Obviously, in a sustained correction, such oscillating indicators are less helpful as the Stochastics could merely stay below the 20 line for several weeks running. RSI (47) has fallen to its lowest level since May 2010. It will be interesting to see if it can stay at or near current levels. If it falls further, then it increases the likelihood of a deeper correction since it will form a negative divergence with respect to the previous lows. We can see further evidence of how divided sentiment is at the moment through individual stocks. ICICI Bank (IBN) held up rather well last week and has not yet completed its bearish head and shoulders pattern down to $42. For the moment, it appears to have found support at the 200 DMA at $44. This perhaps gives more credibility to the idea that a rebound is possible. If a rebound is going to be sustained, then ICICI will have to break above the 20 DMA at $47. Meanwhile, Wipro (WIT) reported disappointing earnings last week and suffered the consequences. Friday’s 8% decline slashed through the 200 DMA and opened up the possibility for further downside. While it is quite possible that price will rebound shortly back above the $14 level as it did in August 2010, there are obviously many bulls that are quite nervous this weekend.
 This week we will see the immediate effects of the Saturn retrograde station which occurs on Wednesday. Overall, the planets point to a negative week. Monday begins with two nominally bearish influences as Venus is aspected by Saturn and Mars forms a minor aspect with Pluto. Tuesday will see the Mercury-Saturn aspect move closer while the Moon conjoins Saturn. This is a nasty-looking combination that increases the likelihood of a sharply lower move. Wednesday’s closing for the holiday introduces a certain unknown element into the proceedings as the worst of the Mercury-Saturn will be avoided by Indian markets. I think there is a good chance that much of the negativity will simply manifest either on Tuesday or Thursday. So Thursday is perhaps more likely to be a down day also, although I would say not quite as likely as Tuesday. As the Moon applies to its conjunction with Venus on Friday, there is a greater probability for gains at the end of the week. While it’s possible there could be a reversal of sentiment starting Thursday, Friday seems like the best bet for a positive result. A more bullish scenario would be a minor drop or flat day Monday followed by a decline to 5600 Tuesday and then a recovery towards 5700 by Friday. It’s hard to imagine a positive outcome to the week overall, but it may only be down modestly. A more bearish scenario would see Monday down below 5650 and then Tuesday falling below support at 5620 and perhaps below 5550. Thursday could see some consolidation around 5500 and then Friday might see a modest recovery to 5550-5600. I would favour the bearish scenario here on the basis of the power of the Mercury-Saturn aspect. Admittedly, the technicals do not necessarily favour a major down week, and would require a collapse of support below 5620 for further downside to occur. The planets suggest that such a decline is somewhat more possible.
 Next week (Jan 31-Feb 4) is likely to begin positively on the Mercury-Venus aspect and this could easily produce two straight up day on Monday and Tuesday. It’s even more likely to produce a net positive outcome from the first two days of the week. By Wednesday, however, things may begin to shift. A third up day is definitely possible as Mercury will be in aspect to risk-seeking Uranus. However, the Sun and Mars will be preparing to conjoin on 4 February. This is usually a negative influence that could begin to manifest a little early. The most likely bet for negative fallout from the Sun-Mars conjunction will occur later in the week, probably on Thursday and Friday. Wednesday therefore becomes uncertain, although I would lean towards a third up day as being a little more likely. All told, this week could well be positive, although not by much. The following week (Feb 7-11) looks more negative and will likely start bearishly also as the Sun-Mars pairing will be in aspect with Saturn. This is a potentially difficult combination that has some sizable downside potential although the latter part of the week looks more bullish. After that, February looks mostly bearish While some short-lived rallies are likely in March, the whole period does not seem to be very conducive for major gains or even significant rebounds. In a more bearish scenario, we could see new lows established as late as the first week of April on the Jupiter-Saturn opposition aspect. While I admit this seems overly pessimistic, the charts do not seem particularly bullish between now and then. Even if it is not a lower low than whatever we may see in February, it may well be quite close. It is possible that a sustained rally will only occur after this March-April period is over. Then it looks good for the rally to take place and last until July or even August. Whether or not this rally produces new highs above 6360 remains to be seen, although I don’t think this is likely given the long term stressors the BSE horoscope is under for 2011. The second half of the year looks generally bearish.
5-day outlook — bearish NIFTY 5500-5600
30-day outlook — bearish NIFTY 5300-5500
90-day outlook — bearish NIFTY 5300-5600
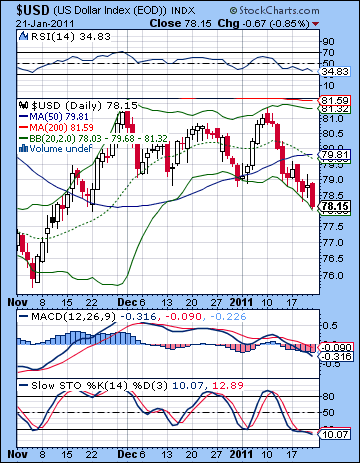 The Dollar got beat up again last week as investors returned to the Euro. It lost more than 1% falling to just above 78 while the Euro climbed to 1.361 and the Rupee lost ground to 45.62. It was a bad call on my part as not even the Venus contact to the USDX horoscope was enough to take prices higher later in the week. As it happened, only Thursday saw a modest rise. The early week was predictably bearish for the Dollar as the Sun-Jupiter aspect corresponded with an increase in risk appetite. What was disappointing was how this early week pattern completely dominated any other planetary influences. The Dollar broke through some decent support and appears to be floating in space here below the previous low of 79 but above the line in the sand at 76. It’s well below the 50 DMA so it’s hard to find a bullish argument. RSI (34) is drifting lower here although there is still some more room to fall and Stochastics (10) are mired in oversold territory. Price has settled at the bottom Bollinger band but more importantly it may have found support at a previous high of 77 from back in October. That isn’t much to go on, but it’s about all the technical situation for the Dollar can muster. A break below 78 would hasten a retest of 76. Even talking about a retest of 76 is no doubt music to the ears of Dollar bears since it puts the greenback on the edge of the apocalypse and the one-way journey to hyperinflation. I don’t believe we’re there yet, although I am frankly a little puzzled by this recent spate of weakness. I had expected February to be a more negative month for the Dollar rather than January.
This week’s Saturn retrograde station is likely to make investors more cautious and hence there may well be a flight to safety and the Dollar. The best days for gains are likely clustered around midweek, with Wednesday standing out in this respect. I would not be surprised to see further Dollar losses ahead of the retrograde, however, with Monday looking most vulnerable. The end of the week lacks direction and any clear planetary clues, although I would think it may see profit taking. Overall, the week has a good chance for holding onto gains, perhaps taking the Dollar above 79. Next week looks more bearish again, however, although the late week Sun-Mars conjunction could be a boost for the greenback. I’m generally less convinced we will see a lot of upside to the Dollar in February. That is a bit strange perhaps given my belief that an equities correction is more likely. But the charts do not paint a clearly bullish picture in the short term. So perhaps the Dollar will stay mired below the 50 DMA at 81 for several more weeks. I would not rule out a retest of 76 either, although that may be somewhat less than probable. The Dollar horoscope improves as we move into March and April and I would not be surprised to see it rally going into June.
Dollar
5-day outlook — bullish
30-day outlook — bearish-neutral
90-day outlook — bullish
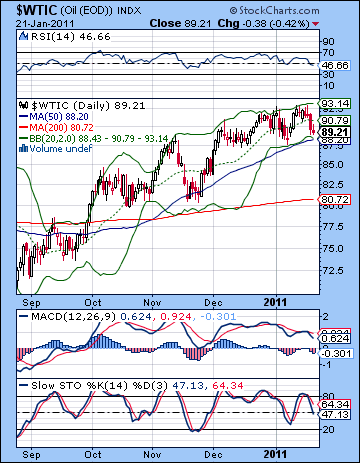 Crude oil moved lower last week as the likelihood of an interest rate hike in China dampened demand expectations. Crude closed a little below $90. This bearish result was broadly in keeping with expectations although I did not expect to see so much downside. The early week Sun-Jupiter aspect did produce the anticipated firmness in prices, although since crude was running up against some solid resistance, it didn’t have far to go. As it happened, it only managed some intraday upside but was unable to hold onto gains by the close. As expected, Thursday was lower as it turned out to be the most negative day of the week. Friday attempted to rebound, but again the gains did not hold by the close. The orderly trading in crude continues here as it moves between both Bollinger bands, although carving out a higher channel at the same time. This is clearly a bullish chart from a technical perspective as we have a series of higher highs and higher lows. The bears require a low that breaks below the previous low of $88 for any kind of sense that this upward trend will reverse. Meanwhile, the bulls are being patient, hoping to ride the slow wave higher towards $100. We see a negative divergence in the MACD that does not look bullish at all as we can spot a series of falling peaks going back several months. Stochastics (47) are sitting in a non-committal place offering neither side any succour. The 50 DMA at $88 appears to be an important support level. A close below $88 would shake out weak bulls can could spark a longer corrective phase. Significantly, this also lines up quite closely with the rising support channel from the August low.
This week looks quite bearish for crude as the Mercury-Saturn aspect is unlikely to take any prisoners. Tuesday and Wednesday look to be the most bearish days, although declines could also occur Monday and, to a lesser extent, on Thursday. The end of the week should see some kind of rebound with Friday looking perhaps the most positive day of the week. There is a good chance we will see the 50 DMA at $88 broken to the downside so that may set up the necessary new dynamic for the market to correct further through February. That is what I am expecting as the breakdown of the rising channel support will scare off many investors who had assumed crude to be a safe trade. The following week looks more bullish, although if we get the earlier downside that I expect, this will form a lower high and indeed may only reach back to the previous support line. This would set up a nice waterfall pattern that would usher in lower prices through to the middle of February at least. $80 is very possible by mid to late February.
5-day outlook — bearish
30-day outlook — bearish
90-day outlook — bearish-neutral
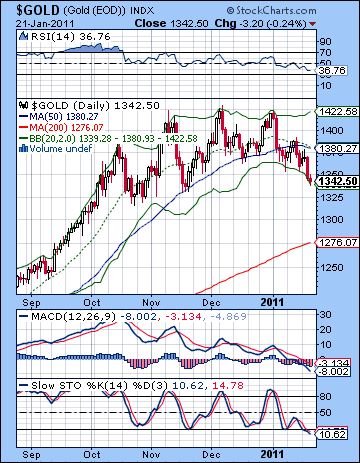 Despite the falling Dollar, gold continued to slump last week as rising bond yields became a more competitive asset class. Gold finished at $1342 on the continuous contact, down about 1% on the week. This was largely in keeping with my forecast as I thought we could see some early week upside on the Sun-Jupiter aspect. These gains arrived on schedule as Tuesday and Wednesday saw modest rises, although significantly, the intraday highs above $1380 were not held by the close. As the Mars-Ketu aspect took control Wednesday, we saw a reversal of sentiment after the close and prices turned negative for the end of the week. As expected, gold could only manage $1380 for its high for the week before the weakness revealed itself again. The technicals look bearish here as gold keeps drifting lower. It’s at the bottom Bollinger band here and is now looking up at the 20 and 50 DMA around $1380. Both moving averages are now sloping down — a bearish signal to be sure. The next level of support may be around the October low of $1320 but even then, things look precarious. MACD is still in a bearish crossover and has now crossed the zero line. Stochastics (10) are oversold but given the extreme length of the rally, this may not count for much. RSI (36) has fallen sharply here but still has some more room to fall before bargain hunters can move in with greater confidence. It may take a correction down to $1250 or thereabouts to bring in sufficient new money to re-start the rally.
By rights, gold should tumble precipitously this week on the Mercury-Saturn square aspect. And yet, the chart only seems partially afflicted. For this reason, I’m less confident that it will fall, although it should likely follow in lock step along with other asset classes lower. This is not to suggest that gold has a strong chance of rallying here; I only wanted to point out a certain absence of data points in my charts that I would have liked to have seen if we are facing an imminent decline. Certainly, there are some bearish planetary indicators here and I would not be surprised to see $1320 tested this week. Next week could see a recovery into Wednesday at least and it may be quite substantial — possibly 3-4%. Then the late week Sun-Mars conjunction will likely sink gold once again into perhaps early the following week on the 7th. Some range bound trading is possible towards the middle of the month (possibly $1320-1380?) but the end of February looks more bearish again so we could see that move down to $1250 begin around this time and lasting into March. Feb 21-23 looks particularly negative. A bottom is possible sometime in March or April and then we should see another rally takeover lasting into June and July.
5-day outlook — bearish
30-day outlook — bearish
90-day outlook — bearish

