Summary for week of January 31 – February 4
Summary for week of January 31 – February 4
- Stocks likely to strengthen into midweek but vulnerable to declines by Friday
- Dollar poised to rally again this week with growing strength through March
- Crude to rise earlier in the week but losses more likely by Friday
- Gold to rise into Wednesday with possible sharp sell off by Friday
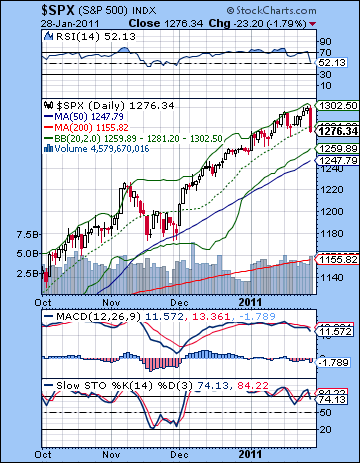 What an odd week. Despite a very bearish-looking Mercury-Saturn aspect Wednesday and Saturn turning retrograde on the same day, the market drifted higher as if nothing was wrong only to selloff sharply Friday on the uncertainty over the civil unrest in Egypt. The Dow closed slightly lower on the week at 11,823 while the S&P500 finished at 1276. While Friday’s surprise selloff was welcome, needless to say the week did not unfold as I had envisaged. I had thought that the midweek would be vulnerable to declines due to the simultaneous bad aspect with Mercury and the all-important Saturn retrograde station. Alas, these aspects are not always in precise synchronization with the market as one would like. And as if to teach me another lesson in humility, the day that I thought might show a gain — at least with the caveat "on paper" — namely, Friday, saw the markets take their biggest loss since November. So while the intraweek forecast was pretty ugly, we did finish lower as expected, although we conformed more to the bullish scenario I had outlined in last week’s newsletter.
But while the decline was not as deep as I had expected, it seems that the investment landscape has changed. The unrest in the Middle East was a sort of wild card factor that may end up being the proximate trigger for the correction in the coming weeks, and all of a sudden, the economic cup is looking half-empty here. Obama’s SOTU speech on Tuesday received a lukewarm response and worse contained no credible plans for reducing the US government debt. This prompted a warning shot from Moody’s that a downgrade of US debt may not be far off. Meanwhile, Standard and Poor’s did downgrade Japan’s debt rating and thus raised the specter of future insolvency as that economy has been likened to a giant Ponzi scheme that cannot escape an eventual collapse. Moreover, inflation is seen as a growing problem in emerging markets such as China and India as more analysts and commentators rightly see these economies as bubbles that will soon burst. This growing debt awareness and intolerance towards inflation are the hallmarks of Saturn, of course, that grim gatekeeper of austerity and constraint. While Jupiter and Uranus puffed up the QE2-driven equity balloon a little longer than I expected, the events of the past week do offer tangible evidence that attitudes are in the process of changing. Saturn seeks control and abhors risk, so markets will likely face the strict discipline of the Great Malefic here in the coming weeks. So it may well prove that this Saturn retrograde station of Jan 26 was an important turning point in the story of this rally after all, even if it did not quite mark it as distinctly as I might have hoped. The next main market influences are both due in March, as Rahu (disruption, greed) squares Uranus (risk, rebelliousness) on March 5 while the main feature may well be the opposition aspect between Saturn and Jupiter on March 29. The Rahu-Uranus aspect is more unpredictable and suggests volatility in both directions, although it does not seem conducive to strong and durable rallies. And it’s an even more bearish story for Jupiter and Saturn. The last time these two planets formed an opposition in the sky was May 22, 2010 when the market was in the throes of its major correction after the flash crash. It’s not an identical planetary set-up, but this could well provide more of a bearish bias to markets until that approximate time frame. While those dates are some ways off, they are likely to tilt the game towards the bears until they play out. Rebound rallies are very possible, but they likely won’t be very long or strong.
 Not surprisingly, the technical picture became significantly more bearish last week as the rising channel off the November low was violated with Friday’s decline. Support from this channel was at 1290 but the S&P ended well below that and now threatens to break through support of a longer term trendline dating back to August. Currently, this trendline sits at 1270 and will drift up to 1275 as we move deeper into the trading week. This is a very important level of support since it was last tested in the November correction. A break of this line would be bad news to the bulls and it might spark a nasty waterfall pattern that quickly tests much lower levels of support. Perhaps the old April 2010 high of 1220 might be tested, although that lacks confirmatory evidence. The Fibonacci retracement level of 38% from the July low would see a pullback to1190, and then 50% would be 1158. Interestingly, this is quite close to the 200 DMA at 1155 so that is a nice confluence of support indicators worth watching. The November low of 1175 is also in the mix here as potential support. Below that, 1120-1130 is another interesting level since it represents the neckline of the IHS pattern from mid-2010. It also is close to the rising trendline off the July 2010 low. It seems quite possible that one of these sub-1200 levels will be tested in February, and I would tend to favour a lower low in March. For all this bearish sound and fury, bulls can still rightly point out that all the main moving averages are still rising and that nothing has fundamentally changed. In other words, it’s a wonderful buying opportunity! Well, only if you watch CNBC. Obviously, most commentators were calling for some kind of correction in Q1 with the consensus somewhere between 5 and 10% on the assumption that the Fed’s QE2 program would prevent any serious downside damage.
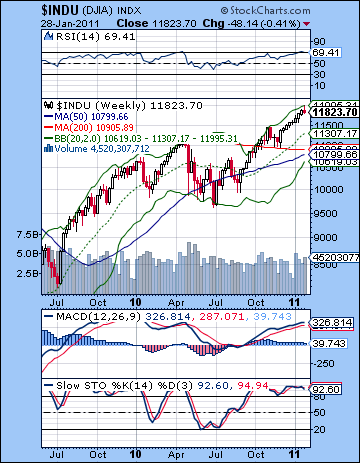
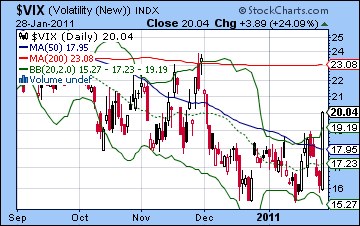
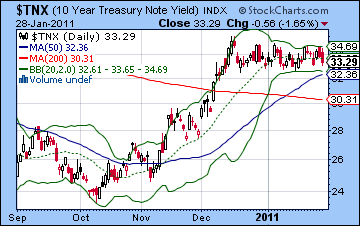
The technical indicators look tired here as MACD is rolling over and in a negative divergence with respect to previous highs in November. Stochastics (74) is still very close to overbought and has a long way to fall should the correction begin in earnest. RSI (52) has tumbled here, although it has yet to create a negative divergence with the November readings around 45. If in the event that it takes out the previous low, then it would produce another bearish divergence. It’s also important to keep in mind that the weekly Dow chart has barely budged. Price is still up against the top Bollinger band line and RSI is at a lofty 69. This still looks like a very overbought chart that has a lot of room to fall. Watch for possible support at the 200 WMA at 10,800, which is about 9% below current levels. This is equivalent to about 1180 on the S&P. Meanwhile, the $VIX took a predictable jump on Friday back up above its 50 DMA. It looks like it may have formed a double bottom so it could finally be ready to make a significant move higher. We will have to see if it can climb above the 200 DMA at 23. Notice that the last correction in November stopped right on that level and then fall back. Ben Bernanke must be somewhat relieved that bond yields were pushed lower with Friday’s selloff as the 10-year yield fell to 3.32%. Given the massive US government borrowing, it is imperative that yields stay low, so this flight to safety move on the Egyptian unrest was welcome news for the Fed. We will have to watch this inverse correlation closely in the weeks to come for any signs of possible decoupling. Once equities begin to fall in tandem with treasuries, then we will have entered a new and potentially disastrous phase of this ongoing economic adjustment. I don’t quite expect this to happen in this correction as it seems more likely in Q4.
 The highlight this week appears to be the Sun-Mars conjunction on Friday February 4. While this conjunction isn’t all that rare and happens once every two years, it occurs here while in close aspect with — you guessed it — Saturn. By itself, the Sun-Mars conjunction is usually bearish anyway, but the involvement with Saturn makes this even more negative. And since we have just experienced a powerful reversal of Saturn’s direction last week, there really is a lot of pent-up malefic energy in the sky that is waiting to be unleashed. It could well occur at the end of this week, although I would hedge my bets here a bit and include early next week also since the aspect with Saturn is still close then. But ahead of the fiery conjunction of Sun and Mars, there are actually some positive aspects in play that could see a (hopefully) final rally attempt back to 1300. Mercury and Venus form a minor but exact aspect on Wednesday and so we could well see buyers take the lead before that time. Monday and Tuesday have the added feature of the Moon’s conjunction with Mercury so that increases the odds of gains that much more. And it is worth noting that Mercury and Venus will be in aspect with Uranus and Neptune so that adds to the bullish vibe up until perhaps Wednesday. So we could see two or perhaps three straight up days followed by more negativity going into Friday. In the wake of the Saturn retrograde station, however, I do think there is a bearish bias here through much of February if not longer, so any upside could be fleeting. A bullish scenario would be mostly gains into Thursday perhaps taking the S&P back towards 1300 but not above it. A lower high is important for the formation of a topping head and shoulders pattern, much like we got in April 2010. In the event that we break above 1300, this would merely delay the correction a little bit, even if it would nullify the convenient H&S thesis. Then the end of the week would see bears take over again with the S&P falling back to perhaps the wedge trendline support around 1275 or a little above. A more bearish unfolding would be a shorter run-up perhaps only lasting two days peaking at 1285-1290, and reversing on Wednesday and down hard, as the S&P breaks below trendline support and ends up somewhere closer to 1250. I’m generally quite bearish here, although it will be interesting if the new Saturn reality can overpower the previously reliable bullish aspect of Mercury-Venus. I’m divided on whether this whole market rolls over here, or merely takes another tiny step toward the edge of the cliff.
 Next week (Feb 7-11) is likely to start bearishly, especially if we haven’t had a significant decline to close the previous week. Sun and Mars are still tightly conjoined on Monday and Tuesday and will remain in fairly close aspect with Saturn. So this looks like a bearish week overall, even if there is some kind of rebound later on. Things could unravel fairly quickly here. The following week (Feb 14-18) looks like it may begin bullish as the Sun enters Aquarius and aspects Uranus and Neptune. But the late week situation looks less favourable as Mars enters the equation and approaches these planets also. It’s possible that we could have a positive week here, although it is not at all certain. Then the last week of February looks bad again as Mercury conjoins Mars. We could well see some kind of interim low put in here, most likely below 1200. Then we could get a bounce into early March (although this could begin in the waning days of February) but I’m not convinced this will go anywhere as the Rahu-Uranus square on March 5 could coincide with an event that shakes things up. And then we still have the Jupiter-Saturn opposition on March 29. This is a bearish pairing and we could see a sharp move down within a few days of this date. It may well mark a significant medium term low, although I can’t be sure of that. It seems that a 15% correction is a minimum here, which would translate into 1130 on the S&P. By mid-April, the market will likely begin to rally and this should last into June and July. It should be sizable and could retrace towards the January high. I wouldn’t rule out another run to 1300 in July, although there should be sufficient technical damage done in March and April that a lower high in the summer is a more probable outcome. Then the late summer will see another move lower, probably below the March low.
5-day outlook — bearish-neutral SPX 1260-1280
30-day outlook — bearish SPX 1150-1200
90-day outlook — bearish SPX 1100-1200
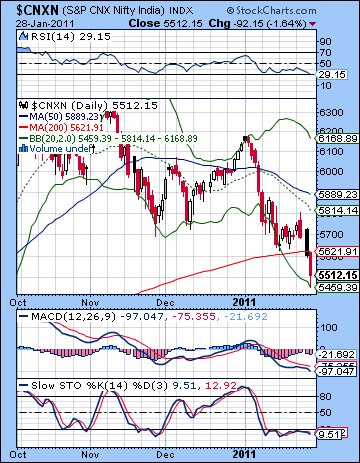 The correction entered a new and more dangerous phase last week as stocks fell on more inflation worries as the prospect of further rate hikes dampened investor sentiment. The Sensex lost more than 3% to close below its 200-day moving average at 18,395 while the Nifty finished the week at 5512. This bearish outcome was largely expected as the midweek Saturn retrograde station cast a pall over the market. However, there were some noteworthy divergences from last week’s forecast. I thought there was a reasonable chance of some downside on Monday on the Venus-Saturn aspect but the market had other ideas and we got a modest rise. This missed bearish opportunity may have resulted from the magnetic effect of the Mercury-Saturn aspect on Wednesday that coincided with the start of the Saturn retrograde cycle. It tended to focus the negative energy closer to it, and as a result, we saw the bears take over as Tuesday and Thursday were lower. Somewhat surprisingly, Friday was also lower despite the fairly positive Moon-Venus aspect. I had thought we could see a late week bounce on this combination, even if it would be fairly tepid. The fact that stocks fell anyway is perhaps another clue that the Indian market is in difficult shape at the moment. Certainly, it didn’t get any help from the RBI announcement last week as inflation targets were raised and so were the prospect for significant rate hikes down the line.
The clouds are gathering here as there is growing realization around the world that inflation in emerging markets threatens to undermine what is otherwise an impressive growth record. This new sobriety towards inflationary policies is perhaps a reflection of Saturn’s growing presence in the celestial mix. As Jupiter takes a back seat here, Saturn’s inclination towards caution and restriction will likely see a less tolerant attitude towards government indebtedness, as witnessed by the S&P downgrade of Japanese debt last week. Saturn’s preference for austerity and discipline will therefore regard inflation as a greater threat in the coming weeks. So the medium term seems fairly bearish as Saturn is now moving towards its opposition aspect with Jupiter on 29 March. The last time these two planets opposed each other in the sky was in the depths of a previous correction on 22 May 2010. This is not to say that history will repeat, but it may well rhyme, as that old saying goes. It does not seem like a positive combination and in fact seems quite bearish. In addition, a tense square aspect between Rahu and Uranus on 5 March also is likely to create instability and retain a bearish bias to the market. Of course, this does not rule out some short lived rallies in the meantime. In fact, the reversal of Saturn’s direction last week may well coincide with a temporary reversal in the market direction this week. Such a congruency between planetary direction and market direction often happens, but on this occasion I am less confident that any such reversal higher can last very long. It seems more likely that any rally will merely be an opportunity for nervous bulls to sell ahead for lower prices in the medium term.
 The technical situation has taken a sudden and serious turn for the worse here as the Nifty has broken below the 200 DMA at 5621. The last time this occurred was in the middle of the May 2010 correction. At the same time, it’s important to note that while the Nifty did close below the 200 DMA back in May, it quickly recovered. So it’s make or break time for the bull market here since failure to quickly close back above the 200 DMA would increase the likelihood of a new bear market phase. The market looks very weak here as Tuesday’s intraday high did not even touch the 20 DMA — a modest target to be sure. But it may well be stretched to the downside in the short term as Friday’s close was near the bottom Bollinger band. Also RSI (29) is now in oversold territory and increases the chances of a bounce. Of course, the RSI can fall further in the event of a deep correction, but a number below 30 makes shorting less attractive and may embolden bulls to attempt a rally. Similarly, MACD is in a bearish crossover and now well below the zero line. It has not been this low (-97) since the correction of January 2010. Again, while it could go lower, there is less technical support for such a move and hence bears may be more reluctant to push their luck in the hope of still lower prices. There appears to be a fair amount of support at this level (5400-5500) due to the slow rally at those levels from summer 2010.
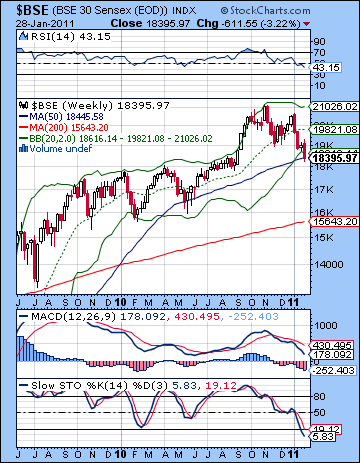
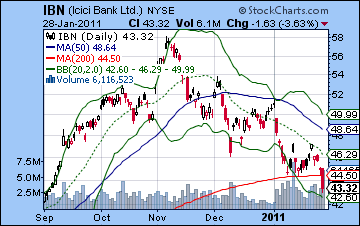
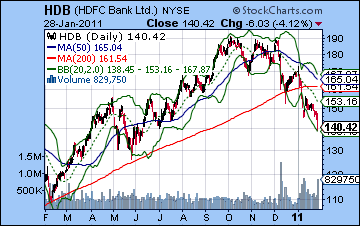
Significantly, the weekly BSE chart also looks increasingly oversold, although we may only be at an intermediate point in the overall correction. Last week’s decline was another bearish engulfing candle which has been a fairly negative indication for more losses to come. On the other hand, the BSE closed very close to its 50 WMA and actually below its bottom Bollinger band, so its possible it may be finding support around current levels. But we may be entering uncharted waters here as previous corrections in 2010 did not fall outside the bottom Bollinger band as this one has done thus far. This may be a clue that the current correction will be deeper and sharper than anything we’ve seen in 2010. The indicators look fairly grim as Stochastics (9) is hitting single digits now and is oversold. Perhaps that may give bulls some intestinal fortitude and venture another rally. However, weekly MACD is still in a bearish crossover and is still well above the zero line. For a deep correction, one can expect MACD to end up well below the zero line, so we could have much further to go on the downside. Likewise, RSI (43) is falling here but still has further to fall before conservative and cautious bulls seeking to take long term positions might feel comfortable entering the market. The precarious state of the market is reflected in the individual stock charts. The banking sector has come under greater pressure here and is on the verge of technical oblivion. ICICI Bank (IBN) is comparatively strong but closed below tis 200 DMA on Friday at $43. Note how it failed to recapture even the 20 DMA before turning lower again. On a positive note, it is close to reaching its downside target of $42 for the H&S pattern. Perhaps it can find some short term support there and bounce back above its 200 DMA. HDFC Bank (HDB) is weaker, however, as it crossed below its 200 DMA two weeks ago. Its weekly chart shows how the current correction is more severe than previous corrections in 2010. This is another clue perhaps that we are in the midst of something much bigger and more dangerous than anything we’ve seen since 2008.
 The focus this week is on the Sun-Mars conjunction on Friday 4 February. The combination of these two fiery malefics tends to be bearish, but this time around the conjunction will occur while in close aspect to Saturn. The alignment of three malefic planets is not good news for the market so we will likely see more pressure in the short term. But ahead of that conjunction, there are several possible bullish influences earlier in the week that could well spark some kind of rally. Mercury moves into aspect with Venus through Wednesday and both benefic planets will form aspects with Uranus and Neptune. This suggests that we should have some positive days, perhaps two or even three. Monday seems somewhat less reliably bullish than Tuesday, and Wednesday again tilts bullish but isn’t quite as reliably bullish as Tuesday. Nonetheless, there is a good chance for a net positive outcome over the three days and we could see the Nifty rally back to 5650. But the late week looks quite negative indeed as the Sun-Mars combine in a fireball of bearishness. In addition, the conjunction will occur in a negative place in the BSE horoscope so that adds to the difficulty. Thursday and Friday both look bearish (although Thursday may be somewhat worse) and we could see a sizable decline of more than 2% on either day. A bullish scenario would see a smart rebound on Monday through Wednesday with the Nifty back up to resistance levels of 5650-5700. This would be followed by another move lower by Friday back to 5500, so there is a chance for a largely neutral week. But the bearish scenario would see a weaker rise, perhaps to 5600, and then down again to 5400-5450. I would favour the more bullish scenario, if only because we’re technically close to oversold levels now. I do think the late week pattern is very bearish indeed, but it is hard to say just how much downside it can produce.
 Next week (Feb 7-11) looks more bullish, although Monday is something of a toss-up. Sun-Mars-Saturn is still quite close and thus may have some damage left to do, but there is a nice Venus-Jupiter aspect that may be able to offset some of the negativity. The midweek Venus-Pluto conjunction is likely to bring in buyers so this may be a recovery week where the Nifty climbs back over the 200 DMA. The following week (Feb 14-18) looks more bearish again, especially on the late week aspect between Venus and Saturn. So it’s possible there could be a technical rebound that lasts from the 7th to the 16th and that could take the Nifty back up to the 20 and 50 DMA at 5800-5900 or even higher. The end of February seems more bearish, however, as Mars conjoins Neptune and that could take prices significantly lower once again. We could well see a range bound Nifty somewhere between a reliable bottom (5400?) and perhaps 5900. There is a chance that early March will see a little more upside but March looks bearish as we head into the Jupiter-Saturn opposition on 29 March. Actually, the Mars-Saturn aspect on 14 March could mark the beginning of another significant move lower. As for when all this bloodletting may end, there are two possibilities that stand out as somewhat more probable: either the first week of April (3rd or 4th) or April 20th and the Mercury-Mars conjunction that takes places exactly opposite Saturn. There is a high probability that this low will be lower than 5400 and it is quite possible we could test the 4800-5000 support level on the Nifty. This would match the May 2010 low, although I would not be surprised if it was lower. After forming a bottom in April, a rally is likely to last into June and July. When that rally makes a lower high, bulls should throw in the towel and we will embark on the next leg down that will last into Q4. By Q1 2012, there is a chance we could see the Nifty back at 4000.
5-day outlook — neutral NIFTY 5450-5550
30-day outlook — bearish-neutral NIFTY 5300-5600
90-day outlook — bearish NIFTY 4800-5300
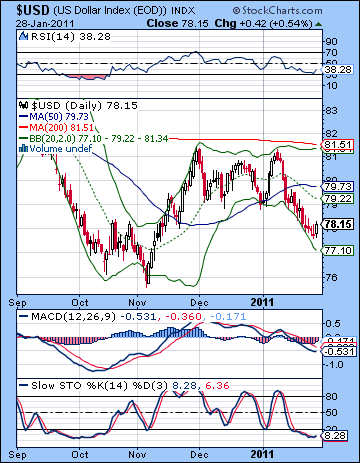 While I expected a flight to safety last week which would boost the Dollar, I thought it would happen earlier in the week. I had earmarked Wednesday’s Saturn retrograde station as a potential pivotal measurement but the Dollar only behaved as safe haven on Friday as news of civil unrest in Egypt took investors out of risky assets. As it happened, the Dollar index finished exactly unchanged on the week at 78.15. The Euro did likewise, while the Rupee reflected greater nervousness about emerging markets and slid back towards 46. While this neutral result was a little disappointing, the Dollar does appear to be a better technical position now. If it can hold onto current levels, it would find support from the October highs at 78 and then prepare to move higher once again. RSI (38) has hit the 30 line and is now moving higher. Certainly, it is possible it could make another dip to retest the 30 oversold line, but there is some basis for optimism here. Stochastics (8) are deeply oversold while MACD is in a bearish crossover although the histograms are shrinking suggesting a possible change in trend. As before, resistance is likely quite strong near the 81 level and the 200 DMA. Unless the Dollar can punch above that, it will languish in this currency purgatory, a victim of Bernanke’s QE2 sleight-of-hand and Obama’s indifference towards the burgeoning US debt. The weekly chart also offers some bullish hope as the RSI (43) is climbing off a recent bottom at the 30 line. This suggests that momentum may carry the Dollar to higher levels in the near and medium term.
This week’s Sun-Mars conjunction on Friday is likely to benefit the Dollar, perhaps by quite a bit. The early week period will be dominated by the Mercury-Venus aspect which should hurt the Dollar. It is unclear just how long this aspect may affect the Dollar since there are some bullish influences in the USDX horoscope that could offset much of the downside. I would therefore expect at least one more down day for the Dollar, perhaps two at anytime between Monday and Wednesday. But the momentum to the upside should continue as Thursday and Friday look very positive. This could well carry over into Monday and even Tuesday next week. I would not be surprised to see the Dollar back up to 80 or above by this time — about equivalent to 1.33 or below on the Euro. Then the Dollar should fall back a bit from Feb 9-11, and then continue to rise into late February. It is at this time that we could see it break above 81 (1.31 on the Euro). The second half of March will see the Dollar rise further as it will likely maintain its inverse relationship with equities and the second leg of the stock correction. The Dollar will fall back through much of the spring but make another rally attempt in August.
Dollar
5-day outlook — bullish
30-day outlook — bullish
90-day outlook — bullish
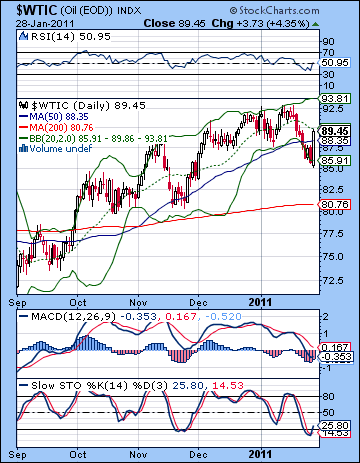 After a mostly bearish week that saw crude trade below $86, Friday’s news of Egyptian unrest pushed oil sharply higher as it closed above $89 once again. Much of my forecast came to pass as the Saturn retrograde station did take prices below the 50 DMA and crude even tested the rising trendline dating back to the August low with Thursday’s decline. Friday’s rise was not at all unexpected as I commented how it could well be the most positive day of the week as the Moon conjoined Venus. However, I did not expect such a price spike and as a result we are back where we started, just under the $90 level. The brief breaking of the trendline is perhaps a sign of future weakness but the bullish engulfing candle should give bulls some confidence as nothing boosts the price of oil quite like the prospect of a war in the Middle East in close proximity to the Suez Canal and the potential of a supply interruption. And yet if the situation calms down quickly, bulls will have little to fall back on as RSI is in negative divergence with respect to previous lows. Stochastics (25) have bounced back up after being oversold so perhaps that offers some solace for bulls looking for further upside. MACD looks quite anemic here as it remains in a bearish crossover although it may be breaking above the zero line. Another close below $88 and a further retesting of the trendline may be enough to push it over the edge in a big way. Until that time, however, crude will be captive to the geopolitical situation the Middle East.
This week is likely to see more upside in the early going as the Mercury-Venus aspect encourages speculators. Monday and Tuesday could be the most bullish days of the week and I would not be surprised to see crude close near its recent highs of $92. The rise should peak in midweek as the late week Sun-Mars conjunction should be more hostile to crude. It’s possible the late week decline offsets the early week gains, but the uncertainty about the Egypt situation makes this harder than usual to call. Next week looks more bearish, especially later in the week so we could be testing that support trendline once again in short order. The following week will likely begin bearishly although some recovery is possible soon after. It seems likely that we will break below the trendline at some point in February and perhaps even hit $80, although that is a little less probable now due to Egypt. Then a bounce is likely in late February and early March which should form a lower high and then crude will fall again through much of March. It appears as if most of the correction will take place in March and perhaps in early April.
5-day outlook — neutral-bullish
30-day outlook — bearish
90-day outlook — bearish
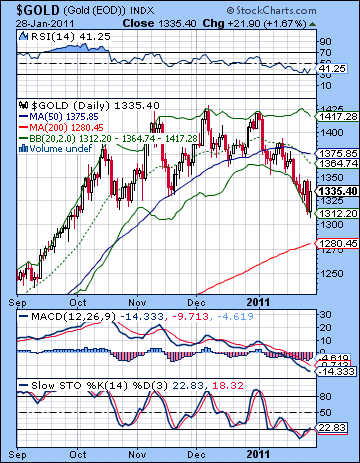 Despite cashing in on its safe haven status amid the unrest in Egypt, gold fell for another week closing around $1335. This outcome was largely in keeping with expectations as I had thought the approach of the Sun-Mars conjunction and the Saturn retrograde station would take bullion lower overall. I had been a little uncertain about gold so that perhaps allowed for the end of the week spike. Also I had thought we would test $1320 and in fact gold did trade near $1310 on Thursday and early Friday. The technicals remain dubious here as Friday’s candle was not a bullish engulfing with Thursday. Just as the entire Middle East was going up in flames and the Suez Canal was threatened with shutdown or interruption, gold could only manage a fairly modest 2% rise. It is not the action of a commodity on a bull run. Price has bounced off the bottom Bollinger band here and is roughly in line with previous lows from October suggesting that it may have found some support here. Bulls can also point to Stochastics (22) that are now creeping back over the 20 line and are pointing higher. The RSI (41) is moving up after a recent trip to the 30 line. Although it didn’t quite make it, it’s close enough that enough bulls may be persuaded that it has formed a significant bottom can may commit new money to long positions. It’s possible that the 200 DMA at $1280 may offer further support in the event of another leg down, although that seems somewhat fuzzy. The previous resistance level at $1250-1260 may provide firmer support. It’s unclear where support may lie beneath that level. Perhaps we would have to go all the way back to $1000.
This week looks quite positive for gold as the Mercury-Venus aspect should support prices, especially in the early going. This pattern also has the added feature of hitting a positive point in the GLD ETF horoscope, so there is greater likelihood of a bullish outcome. I would not be surprised to see gold push towards $1380 here and the 50 DMA. At the same time, the Sun is approaching its conjunction with Mars on Friday so there should be some downside here also, although it may be more confined the late week period. Overall, the week has a good chance of finishing higher. Next week looks very bearish to begin with (7th-8th), but the late week looks positive again. After some possible range bound trading, gold could decline again at the end of February as Ketu aspects Mars and Mercury. March looks to have a bearish bias with an interim bottom forming in late March or sometime in April. Another rally is likely from May to August.
5-day outlook — bullish
30-day outlook — bearish-neutral
90-day outlook — bearish

