Summary for week of July 11 – 15
- Stocks likely trending lower with midweek period most vulnerable to declines
- Dollar may strengthen this week as Euro could test support at 1.40
- Crude likely to be bearish with test of $93 support possible
- Gold likely to pullback on midweek Venus-Saturn aspect
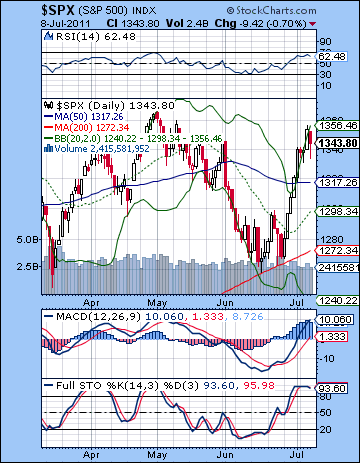 Stocks inched higher last week as optimism over technology earnings offset lingering caution about the Eurozone. Despite Friday’s decline on the weak jobs report, the Dow ended up gaining about a half a percent, closing at 12,657 while the S&P500 finished at 1343. This mildly bullish outcome was largely in keeping with expectations as I thought those Jupiter aspects would eventually carry the day. At the same time, I noted a possible bearish influence through the midweek Mars-Saturn aspect and the larger New Moon pattern. I was not an ardent believer in the New Moon top theory, although I threw it out there as something to watch. The Mars-Saturn aspect did correspond quite closely with some retracement on Tuesday and Wednesday, so that was also welcome, although the magnitude of the pullback was quite tiny as the bulls ably defended SPX 1330. The week also began according to plan as Monday’s Mercury-Jupiter aspect generated some solid buying overseas. The good mood did not last into Tuesday, however. I was also correct in calling for bullishness at the end of the week as the Venus aspects with Uranus and Jupiter produced a net positive result on Thursday and Friday. I did not, however, foresee the extent of Friday’s sell-off, although buyers did return to push up prices somewhat by the end of the day.
As expected, Jupiter has delivered on its bullish promise over the past couple of weeks. Its sequence of aspects with Neptune, Uranus and then most recently on Friday, Pluto, has corresponded with a gradual shift in sentiment from early June’s gloom to July’s relative optimism. Of course, Friday’s jobs report may have cast a pall over the proceedings as there is more talk about the possibility of a double dip recession, and — heaven help us — QE3 in the fall if the employment picture does not improve over the summer. Interestingly, Friday’s Jupiter-Pluto aspect corresponded exactly with a significant decline in the market after a major rally. The timing was likely beyond coincidental since exact aspects can often signal reversals, or at least, interruptions in the prevailing trend. Now that Jupiter has made its last major aspect with a slow moving planet for while, we can properly ask: Is this rally done? My expectation is that it is, although I would allow for the possibility of some marginal upside from here from some short term aspects involving Jupiter. But the the bulk of bullish planetary fuel that I indicated was necessary for a summer rally is largely spent. The easy gains are behind us, and if the bulls are lucky, we could see more of a sideways market that is range bound. I tend to think we will see a bearish bias creep back into the market for the rest of July, however, although I am not expecting any major decline just yet. If the bulls have run out of most of their bullish fuel from Jupiter, the fuel for bears’ pessimism would also seem to be in fairly short supply as Saturn does not seem to be doing much in the near term. While the market cannot be reduced to the ebb and flow of the energy of just these two planets, I believe they do account for a disproportionate amount of the variation in prices. The inability of either planet to gain the upper hand here is therefore a good probabilistic reason why we could see the market attempt to consolidate over the next few weeks. After that, I am still expecting Saturn and the bears to regain the upper hand.
 The bulls made fast work of the H&S pattern and the putative right shoulder at 1345-1350. Thursday’s close above 1350 made that whole bearish scenario somewhat less valid, although bears could still point to the lower high and the possibility of a messy, sloping H&S pattern. The trouble was that some indexes like the Russell 2000 and the NASDAQ 100 actually made new all-time highs. These are indexes that have consistently led the broader market through the rally over the past year. That doesn’t mean that the bearish H&S pattern is completely dead, but it’s not looking too likely. If the SPX falls from here and goes sideways for a while, then the sloping version of the H&S might gain more currency. But until that happens, it may be wise not to invest much faith in it. The SPX has now risen to resistance from the falling trend line from the 2007 top and the May 2011 high. A close above 1360 would violate that resistance and would point the way to 1370 and, in all likelihood, 1400.
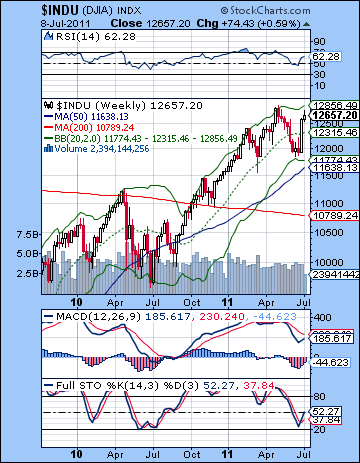
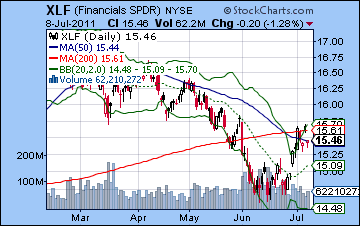
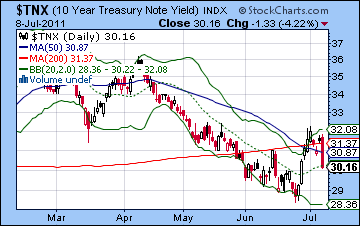
The technical indicators do not paint a compelling picture for the bulls. Yes, the charts are bullish as price is above all three moving averages and are rising. But the case for more upside seems more precarious. RSI may have topped out at 68 or so on Thursday before ending the week at 62. It could go higher, of course, but it’s not very enticing, especially in light of the deteriorating fundamentals in the US economy. Stochastics (93) are still overbought and are signalling that further upside may be modest. MACD has returned to its levels of early May and may also be showing signs of a top. The SPX has finally backed off the upper Bollinger band, which given the high levels of the other three indicators, would suggest that a pullback is more likely here. Support is likely first around 1330, and then that previous resistance of the falling trend line may now act as support near 1300-1310 if we test that in the coming week. The weekly Dow chart shows how quickly we have moved from support at the lower Bollinger band to resistance of the upper band in just two short weeks. Despite the recent rally, MACD is still in a bearish crossover and falling. This illustrates how fleeting such a technical rebound may be in the longer term analysis. The bulls may counter that the Stochastics and RSI will have further room to rise before becoming overbought. Very true. Copper (not shown) has caught up with equities here at 441 and is again challenging its February high of 460 It’s bullish signal but unless it breaks above 460, it may be seen as less important. The financial sector continues to lag the rest of the market and this is another reason why there may be tough times ahead. The recent rally has only recaptured about half of the decline since May and has climbed back to its 200 DMA. Not exactly bullish yet. Meanwhile, the 10-yr bond yields plunged on Friday’s jobs report as the 3% level was tested again. While the rise above 3.1% and the 200 DMA was a failure by the bond bulls, the stunning turnaround on Friday suggested there could well be more downside to yields. After the test of resistance from the upper Bollinger band, yields may be heading down to the lower band here. Lower yields would likely be bad news for stocks.
 The stars this week should give the edge back to the bears. In the early week, there will be a minor aspect between Mercury and Mars that could quicken the pace of trading and indicate a measure of irritation or dissatisfaction with the status quo. This is not a high probability bearish aspect, but I would think it leans bearish. Venus is aspected by Saturn on Tuesday and into Wednesday so that is another clearly bearish influence that will tend to drag down sentiment. I would note, however, that we could see the larger negative fallout from this Venus-Saturn aspect on Thursday, as the Moon could form a triggering aspect then. This complicates the intraweek picture somewhat. I would tend to think that Tuesday is the worse-looking day on paper with the Venus-Saturn aspect and a Moon-Mars aspect. By rights, this combination should spark a significant decline. Perhaps it will form a temporary low around 1310-1320 and then Wednesday will see a recovery followed by an attempted follow through higher on Thursday morning that loses steam by the close. That is one possible scenario. Friday’s Full Moon doesn’t look particularly bullish, and so I would lean bearish that day. So we could see a brief rally attempt Monday to 1350 that ultimately fails by the close and we end up in the red. This downtrend could be carried through in spades on Tuesday to 1320 or lower. We should see at least one more down day in the week, possibly Thursday or Friday. Wednesday would therefore be higher, although that is a somewhat speculative call on my part. If Wednesday does rise on the Moon-Jupiter aspect, my guess is we see a lower high than the current close (1343) and this leads to more weakness for the remainder of the week.
 Next week (July 18-22) also tilts towards the bears as Mars conjoins Ketu (South Lunar Node). The early week features a Mercury-Rahu aspect that looks iffy at best. Some gains are possible here into midweek but they are unlikely to be anything spectacular. The late week looks more bearish as Mars gets together with Ketu. The aspect will still be inexact, but Friday does have some nastiness potential. The following week (Jul 25-29) may begin bullish enough as both Sun and Venus enter Cancer and thereby escape Saturn’s influence. But some midweek turbulence is likely as the Moon conjoins Mars-Ketu that could wipe out gains from previous days. Bulls are likely to carry the last two days of July. Despite some upside potential in this final week of July, it seems quite unlikely that the market will be able to move above 1350. I would expect it to remain range bound between 1300 and 1340. Early August seems bearish as Mercury turns retrograde while in close aspect to Mars and Neptune. This occurs quite close to the deadline for the US debt ceiling deal so I would not be surprised to see the market sell the news there, whatever it may be. There is an extremely nasty alignment of Moon, Mars, Uranus and Pluto on Aug 8-10 that could produce a significant decline. I would expect the market to rally after this capitulatory-type selling day, so we could see another rally of some length begin on the 11th and continue into perhaps Aug 16, or even Aug 25. It’s hard to know how much upside we will see because there are a ton of aspects here, some bullish and some bearish. I tend to think that the bulls will exert themselves, however, at least for a short while. But overall, August does not look bullish and we should see the 200 DMA taken out (1272). September could be quite bearish as the Saturn-Ketu aspect should take markets substantially lower.
5-day outlook — bearish SPX 1320-1330
30-day outlook — bearish SPX 1280-1320
90-day outlook — bearish SPX 1150-1250
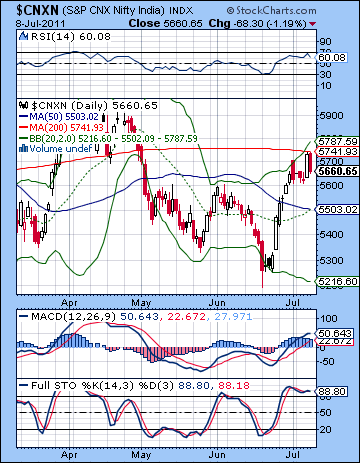 Stocks ended modestly higher last week on improved corporate earnings and bullish global cues. After touching the 19K level Thursday, the Sensex settled Friday up less than 1% at 18,858 while the Nifty finished at 5660. This muted bullish outcome was largely in keeping with expectations as I thought the Jupiter aspects would likely offset any midweek bearishness. I was correct in my call for early week strength as the Venus and Jupiter aspects did prop up prices, if only on Monday. The midweek Mars-Saturn aspect then took over and we saw a retracement back to 5600. I thought we would see some late week bullishness and that also came to pass, although I thought that Friday might have a better chance of gains than Thursday. As it turned out, Thursday’s Venus-Uranus aspect provided a boost to test resistance at 5750 and the 200 DMA. Then there was a sudden about-face with Friday’s mining draft bill, although the end of the week still ended net positive.
This recent strength is an appropriate reflection of Jupiter’s predominance over Saturn. As I noted back in May and June, the sequence of Jupiter aspects with the outer planets Neptune, Uranus and Pluto would likely prevent any serious decline from occurring through to July. Indeed, I suggested that this sequence of Jupiter aspects would likely push prices up towards resistance levels. A rally was that much more likely since bearish Saturn appeared to be retreating from its recent prominence in May and early June. So far, that mostly bullish scenario has played out as Jupiter completed its final aspect in that sequence with Pluto on Friday, 8 July. The market’s precipitous fall that day was a good reminder just how exact these aspects can work. Once exact, the positive Jupiter energy ends and it can often take stock prices along with it. But if Friday was the last Jupiter aspect in a while, what does this mean for the market going forward? At the risk of simplifying my astrological model, less Jupiter means less upside, even if Saturn is not necessarily strengthening either. If Saturn were to strengthen through its aspects, then the market would be much more likely to decline significantly. I do not see that happening just yet. So both the key planetary players, Jupiter and Saturn, are likely to be less influential over the next few weeks. This is perhaps the best argument for more range bound trading. The apparent stalemate between Jupiter and Saturn perhaps reflects the indecisiveness of the market at the moment as investors try to ascertain where the market is headed in the aftermath of QE2. Recent economic data out of the US and Europe does not paint an optimistic picture, so exporters may be that much more vulnerable here. The domestic market has its own concerns as inflation remains uncomfortably high and is beginning to cut into company profits. So the tug-of-war between bulls and bears is likely to continue a little while longer, although I would still assume a cautious, defensive posture. My medium term outlook is still quite bearish, so one does not want to be caught flat-footed.
 Bulls gave it a a very impressive try last week and pushed the indices right up to their 200 DMA but could not close above it. The Nifty reached 5737 intraday on Thursday but could not close above 5741. Interestingly, this level also coincided with the falling trend line off the Nov 2010 high. The convergence of both these lines makes this a formidable resistance level so perhaps we should not be surprised that the bulls failed to break above it here on their first try. The problem now is that the Nifty sits at key resistance while at the same time being close to overbought. That’s a bad combination if you’re a bull because it means that the chances of breaking above resistance are reduced. The RSI (60) peaked just under the 70 line on Thursday, suggesting perhaps to weak bulls that the top was in for now. Stochastics (88) are still overbought while MACD is still in a bullish crossover. If resistance is around 5730-5750, then the crucial support level for bulls to defend is 5600. A close below that level would be bad news for the bulls as it would increase the likelihood of another move down back into the 5200-5600 range.
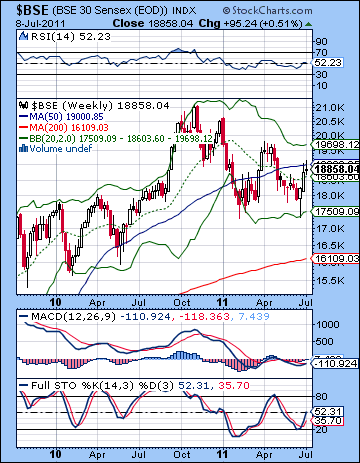
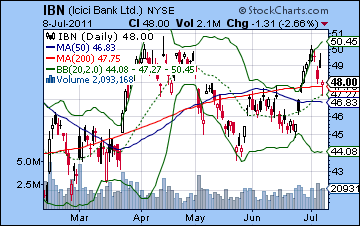
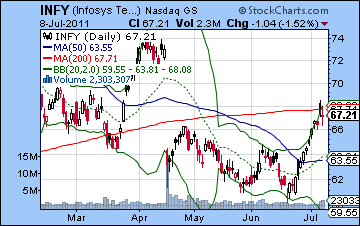
The weekly BSE chart looks somewhat mixed from a technical point of view. MACD is on the verge of making a bullish crossover and moving above the zero line. More bullish perhaps is Stochastics (52) which have rallied off the 20 line and now appear to be making a run to the 80 line. While there is nothing stopping it from reversing lower here, at least one can make a plausible case that it is still in rally mode. To that end, the rally has only taken the BSE back above the middle Bollinger band (20 WMA) and it still has some room to rise before it bumps up against the upper band at 19,698. That is all moot, however, unless the Sensex can close above resistance at 19,200. But if it does close above this level, then it might quickly rise towards this top band. Longer term support is still likely around the bottom Bollinger band at 17,500. This line has provided support in several previous corrections. If it should break (or rather, when), then we may get a fairly quick retest of the 200 WMA at 16,100. As a reflection of the pressure on the global financial sector, ICICI Bank (IBN) did rather poorly last week on the US exchange. Monday’s rise equaled the February high but it was mostly downhill after that. It appears to be seeking support here from the 200 DMA. Bulls will try to defend current levels, but a close below $48 could begin another move lower. Infosys (INFY) is at a similar but reversed sort of crossroads as last week’s rally pushed it up against resistance at the 200 DMA. If bulls cannot take it back above the 200 DMA in the next few sessions, it may prompt some selling.
 This week looks more bearish than last week so I would expect some technical follow through to the down side. Monday begins with Mercury entering into an aspect with Mars. This is a minor aspect so it may not produce any fireworks, but there is some bearish potential here. Tuesday is also problematic as Venus is aspected by Saturn. Saturn aspects are usually negative, although I will admit some uncertainty about when we will see the fallout from this aspect. It is possible that Tuesday may actually be higher, although I would be very cautious around this aspect. The Moon is opposite Mars on Tuesday so that is another negative factor to consider. Wednesday’s Moon-Mars conjunction is also a potential source of bearishness, although I suspect we could see improvement towards the close Wednesday. This opens up the possibility for a positive close. Thursday features a Moon-Venus-Saturn alignment that looks more bearish than anything else. Friday is perhaps the best looking day of the week as the Full Moon offers some possibility of auspiciousness. Individually, there are many bearish aspects there although I don’t expect we’ll see four down days this week. I do think we will see more down than up days, however. The more important question is whether support at 5600 will hold. We could revisit that level quite soon on Monday or perhaps Tuesday. If we get an up day there on Tuesday or Wednesday, then perhaps it will hold a little while longer. I tend to think it won’t and the Nifty will probably trade below 5600 at some point this week. Friday’s possible bounce is unlikely to recapture 5600. It is possible we could see 5400-5500 here.
 Next week (July 18-22) also seems to tilt bearish. Some early week upside seems quite possible but as Mars approaches its conjunction with Ketu later in the week, the markets could fall sharply. While the upside could test resistance at 5600, it seems not strong enough to test 5750. And then the downside may well be greater so the Nifty could once again trade in the lower, more bearish range of 5200-5600. The following week (July 25-29) looks more bullish as the Sun and Venus are in aspect with Uranus and Pluto. This could be the last push up before the next big move lower in August. Mercury turns retrograde while in aspect with Neptune on 3 August so we should expect some significant selling to occur. This date closely coincides with the deadline for the US debt ceiling negotiations so there could be some disappointment arising from that deal. There is a nasty alignment of Mars-Uranus-Pluto on 8-10 August that could also be quite negative for markets. I would not be surprised to see some support taken out at this time, perhaps at 5400, or perhaps at 5200 depending on how strong the late July rally turns out to be. After a rebound rally in the middle of the month, the end of August looks negative again on the Mars-Saturn square aspect. on the 25th. September will likely extend the bearish environment as Saturn prepares to be in aspect with Ketu. This is a nasty pairing to be sure and this is a time when 4800 may be tested. After a rebound in October, the end of the year still looks unsettled and probably bearish. We could see some kind of long term bottom formed in 2012 or 2013. I would be reluctant to establish any significant long term positions until we see how the global economy is performing in 2012.
5-day outlook — bearish NIFTY 5450-5600
30-day outlook — bearish NIFTY 5200-5400
90-day outlook — bearish NIFTY 4800-5200
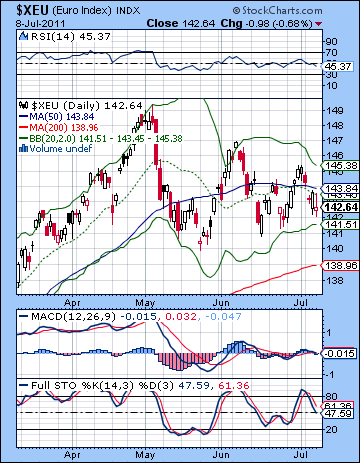 The Dollar gained more ground from the Euro last week on the downgrade of Portugal’s debt. The Dollar finished above 75 while the Euro slipped below 1.43 and the Rupee climbed to 44.43. While the Euro did make some gains Monday, the bullishness was far more muted than expected as it reversed lower after testing resistance. I had warned of this possibility last week and noted the likelihood of such a technically-driven scenario, even given the lack of confirmation from my astrological indicators. The Euro is moving lower here as it probes the lower Bollinger band and tests support in its current triangle pattern. When it breaks out of this pattern of lower highs and higher lows, it will likely begin a new trend. I am still expecting it to break lower, so we may not be far off that point. Stochastics (47) have moved off recent overbought conditions and are trending lower. This is a bearish indication since the Euro is at support now but Stochastics has more room to go before becoming oversold. RSI (45) is falling and is showing a series of lower peaks. The 20 and 50 DMA are now sloping downward suggesting the short term trends are more clearly defined as bearish. Resistance from the falling trend line is now around 1.44 while support is 1.42. This is just half a cent above the lower Bollinger band so there should be some support there, even if it should break below it briefly. If that should break, then we could get a test of the 200 DMA at 1.39 quite soon. After that, support levels are more uncertain. The rising trend line from the mid-2010 low comes in around 1.40 so that adds to the importance of that general area. A break there could see the Euro tumble back to 1.30.
This week is likely to continue the down trend in the Euro as the Venus-Saturn aspect looks unfriendly to the risk trade. I would not rule out an up day, perhaps on Monday or Tuesday. But the midweek looks more bearish with the full force of this aspect likely to hit either Wednesday or Thursday. We may see some recovery by Friday. But there seems to be enough bearish energy available this week to seriously test support. I would expect that support that break, so we could see 1.40 or 1.41 at some point. Next week also tilts bearish although a back test of that triangle pattern support/resistance is probable along the way. While it’s possible we could continue to fall into 1.39 around the 22nd and the Mars-Ketu aspect, I’m not convinced there’s enough bearishness out there to do this. The last week of July may represent a final rally attempt to retests resistance, either at 1.42 or perhaps as low as 1.41. Early August looks bearish for the Euro so we could see some larger declines then, especially around Aug 8-10. As Jupiter slows ahead of its retrograde station on Aug 31, we should see some significant upside, probably centered around the middle of the month. As before, September looks very bearish so we could see 1.30 by that time.
Dollar
5-day outlook — bullish
30-day outlook — bullish
90-day outlook — bullish
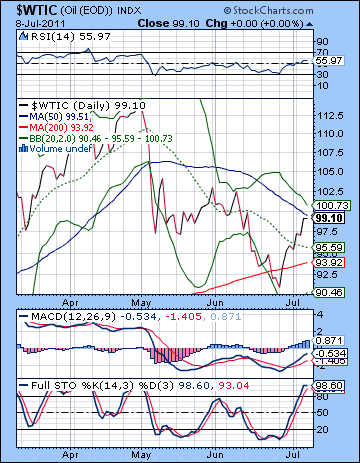 As demand prospects continued to improve, crude saw another modest rise this week closing above $99 on the continuous contract. It briefly traded at $100 on Thursday before backing off on Friday’s disappointing jobs report. This bullish result was largely in keeping with expectations as I had thought crude to remain strong on the various Jupiter aspects in play. The midweek Mars-Saturn aspect did not quite live up to bearish expectations, however, as crude made only the briefest of pauses on Tuesday and resumed its climb on Wednesday and Thursday. Friday’s decline was somewhat surprising coming as it did so close to the Venus-Jupiter-Pluto alignment. The $100 level has acted as resistance here, as crude moved past the previous $97 level with ease on Wednesday and Thursday. While this is bullish, it has yet to challenge the 50 DMA at $99. $100 still looms large as resistance and it is not yet making a run at the May highs of $102. MACD is in a strong bullish crossover but Stochastics are very overbought here. That’s a bearish combination given that crude is up against some fairly strong resistance. RSI has recently bounced off the 30 line and has a long way to go before it is overbought, however. That fact perhaps makes the bullish case for crude a little more compelling, although not much. Support is still likely to be found around the 200 DMA at $93. The bottom Bollinger band at $90 may well catch any brief piercing moves. So while the technical case for crude has become more bullish, the upside potential seems somewhat limited, unless we see a close above $100 and then $102 that takes out the lower May highs. The rally above $97 has nullified the head and shoulders neckline, making the downside target of $86 somewhat less likely now.
This week looks more bearish for crude as the Venus-Saturn aspect during the midweek is likely to take prices lower. The Mercury-Mars aspect in the early week also doesn’t look that helpful for crude. Tuesday and Thursday are perhaps somewhat better bets for declines this week. Friday could be higher, although it is not a clearly bullish set up. Given the range of negative aspects this week, I would expect that crude will move into the $92-94 range with a possibility of a close around those levels. Next week may see some early upside but the late week Mars-Ketu aspect could be quite negative indeed. It’s unclear if we will see a lower low, although we may again test support of the 200 DMA at this time. Crude looks like it will trade within a range of $90-100 until early August when we could see a sudden down move. Even here, it’s unclear if crude can break support from the bottom Bollinger band, especially if it has moved closer to $100 beforehand. Some mid-August rally is likely again, with a sharper down move probable in the third or fourth week of August. This could continue into September and we could see crude touch $80.
5-day outlook — bearish
30-day outlook — bearish-neutral
90-day outlook — bearish
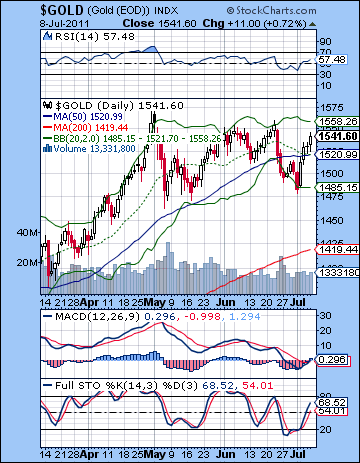 Gold took full advantage of the disappointing economic data out of the US as investors bet on further stimulus measures, higher inflation and further depreciation of US currency. Gold rose by 4% closing above $1540. While I expected some upside in the second half of the week, I underestimated the early week bullishness as the Mars-Saturn aspect had little apparent effect. Gold has climbed off the bottom Bollinger band and is making a push for the upper band now at $1558. Resistance from the falling trendline off the May high comes in at $1555 so we are within striking distance of that now. RSI (57) has bounced back but we can still see a series of declining peaks that suggests bearishness. A move above 60 would break this pattern. MACD is in the beginnings of a bullish crossover and is about to move over the zero line. Stochastics (68) are spiking here and moving rapidly to the 80 line. This suggests that we could get more upside before it becomes overbought and less attractive to bulls. Support is likely around the 50 DMA at $1520, and then the previous low at $1480. In the event of a deeper correction, the rising trend line at $1420-1450 is the next level of support that could bring in new buyers. While last week’s rise was impressive, it will only start to win new converts if it can break above the previous high. If it doesn’t, then a retracement below $1500 is more likely.
This week’s Venus-Saturn aspect looks mostly bearish. The aspect looks to be most powerful on Tuesday so that is perhaps a more likely candidate for a significant decline. Monday’s Mercury-Mars aspect could go either way for gold. So it’s possible we could get an early week rise that takes gold to resistance at $1555 followed by some profit taking on a decline to $1520. A late week rebound also seems somewhat likely, although it may not be a large gain. Next week looks more mixed with the late week Mars-Ketu conjunction likely to erase any previous gains. We could see another rally attempt in the last week of July but this is unlikely to produce new highs. My guess is the rest of July will trade between $1480 and $1540. Early August looks more bearish which could see further downside probing below $1500 but some recovery is likely in the middle of the month. This rebound could even last into the Jupiter retrograde station on August 31. This is likely to push gold back over $1500 and perhaps even to $1550. September looks more bearish, however, and I would not be surprised to see a more rapid descent at this time.
5-day outlook — bearish
30-day outlook — neutral
90-day outlook — bearish

