Summary for week of July 4- 8
- A blend of bearish and bullish aspects this week with weakness in stocks most likely midweek
- Dollar may struggle to hold on to support this week, especially late
- Crude more mixed here with pullbacks likely midweek
- Gold still vulnerable but may strengthen again by Friday
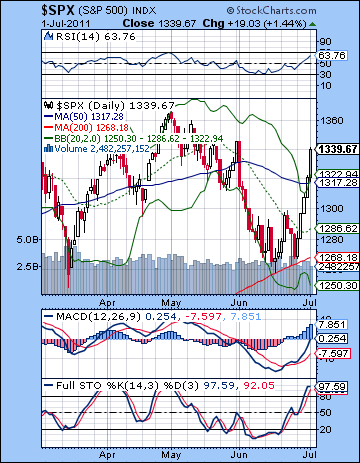 Jumping Jupiter! The planets aligned for the bulls last week as the Greeks bit the bullet and approved the EU’s austerity program and the ISM report yielded some surprisingly positive results. The Dow charged ahead by more than 5% closing at 12,582 while the S&P500 finished at a lofty 1339. I thought we would see some upside from all those Jupiter aspects but I never thought we would climb all the way back above 1330 so soon. I thought we might get to 1300 for now, with the creation of the possible right shoulder left for another week. But now it seems the right shoulder, such as it is, is basically in place. It was an impressive show by the bulls and their planetary representative, Jupiter. I fully expected the first half of the week would tilt bullish as Jupiter moved into alignment with Mars and Uranus. What was more disappointing, however, was the failure of Friday’s eclipse to produce a pullback. Not only that, it emphatically extended the bull run. It is possible that the eclipse could mark an interim top, in a similar manner to the top formed on May 2, which also occurred on a New Moon. Readers will note that solar eclipses are New Moons where the Moon is invisible and in conjunction with the Sun.
While I have been warning about a possible snapback rally as Saturn waned and Jupiter waxed, the end of the week action has left me feeling more than a little chastened. Could this rally actually have legs to run higher than the putative right shoulder at 1345? Certainly, I think the summer has more upside potential as Jupiter is still in aspect with Pluto this week. While bullish Jupiter will weaken somewhat after its aspect with Pluto on July 8, it could pick up more energy as it approaches its retrograde station at the end of August. So there is more Jupiter energy available for the bulls to tap into and push the market higher. The perplexing thing is that this has happened so quickly. It’s therefore possible we could see more upside. I had more or less written off the possibility of a higher high in 2011 (above 1370) but the speed and ferocity of this week’s rally has left me wondering about that. That still seems unlikely, but it cannot be ruled completely out. The relatively low number number of obviously negative aspects over the next month suggests that the bulls may retain some control of the market a little while longer. Perhaps they won’t be able to push it that much higher, especially if we’ve just seen a low-volume rally fueled mostly by short covering. If we step back a little more, the longer term prospects look even less promising. We are in the middle of a very slow moving Uranus-Pluto square aspect that began in 2010. Due to the slow velocity of these distant planets, this aspect will be in effect until 2013. This is generally a bearish influence that often marks periods of dislocation and transformation of society that cause painful adjustments. It’s worth noting that the previous Uranus-Pluto square aspect occurred in the Depression from 1930-1932. This is not to say that we are due for a repeat of history. However, the experience of the 1930s does illustrate the potential damage of such an aspect and its essentially bearish character for equity markets. In other words, even if the bulls manage to maintain control of this market for another month or two and push it a little higher, it does not seem sustainable in the medium term.
 After the previous week’s successful defense of the 200 DMA and the channel support, the bulls really ran with the ball last week and fulfilled their wildest IHS dreams. The IHS from the 1258 low and 1295 neckline was completed in a blink of an eye as the market blew past the upside target of 1330 on Friday. An indication of the strength of the rally was the ease with which the resistance levels of the 50 DMA and upper Bollinger band of 1320 was broken. The next level of resistance is likely around that tell-tale left shoulder of 1345. A close above 1345-1350 and the SPX could make a run for 1370 fairly quickly. Support will likely be provided by the previous resistance of the falling trend line at 1320 and the 50 DMA. I would expect that level to hold for at least one retest in the event that we get a pullback this week.
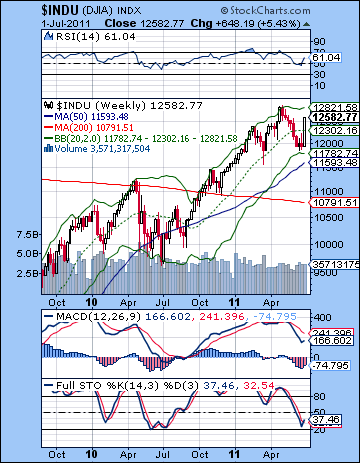
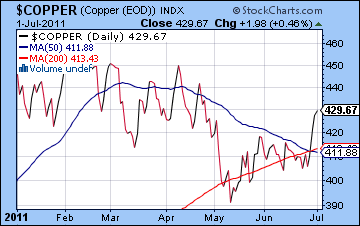
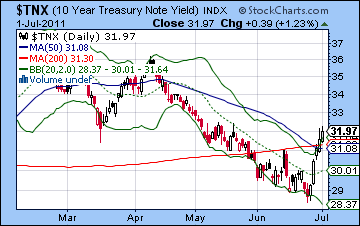
But while the bulls have regained control, they may be overextended here. The SPX closed above the top Bollinger band for two days running, and Stochastics (97) are very overbought. There is still some room for the RSI (63) to move to the upside, however. MACD has clawed its way back to the zero line, perhaps an appropriately ambiguous level that could signal a turning point one way or the other. The weekly Dow chart offers more support the bulls as Stochastics (37) may have bounced off a near-hit of the oversold 20 line. Also the previous week’s low did occur quite close to the lower Bollinger band line. This increases the likelihood that the correction may be over for now. On the other hand, the mid-2010 correction produced several touches of the this lower band in quick succession, so this should not be seen as definitive. The Euro continues to be a key factor in the market here as last week’s rally pushed it up against resistance of the falling trend line (see Currencies section for chart). The trend line largely held, albeit with some late week leakage. It’s not quite a divergence, but it’s close. If this reverses quickly, then a weaker Euro would undermine equities and would reverse the market. Meanwhile, copper surged above its immediate resistance and closed near its falling trendline at 429. A close above 435 would help stocks make a new leg higher, but that seems unlikely right now given how far it has climbed last week. So now the divergence between copper and stocks are diminished, although it is still present in a reduced form. If copper confirms the push above the trend line, then it would open a path back to previous highs in the stock market. I don’t think this is likely, but it is something to watch for. Not surprisingly, bond yields took flight last week on more signs of a recovery and possible inflationary consequences. Yields on the 10-year did not stop at the 50 and 200 DMA at 3.1%, however, as investors demanded a higher risk premium on US debt. This level matches the post-May 2 high for yields and we can now see that bonds are at a turning point of sorts. A move higher would suggest a return to relative normalization and likely keep equities out of trouble for the immediate future. A push below support at 3.1% may signal again that the risk trade is off and that stocks would stay volatile.
 This week will provide a glimpse into the post-eclipse reality. Stocks have tended to rally into eclipses and New Moons recently (May 2 high; June 2 high; July 1 high?) so it is conceivable that this pattern could repeat and we will retrace this week. I’m somewhat doubtful of that bearish scenario, however, since the bullish aspects appear to outnumber the bearish ones here. With Monday closed for a holiday, Tuesday will feature a Mercury-Jupiter aspect that could produce another up day. It’s quite close to exact, however, so it’s unclear it will be enough to produce higher prices. On the bearish side, the Mars-Saturn aspect will be exact on Wednesday so it is possible that will cancel out any positive vibes in the early week period. But the end of the week would suggest more upside again as Venus will move into alignment with that holy bullish trinity of Jupiter-Uranus-Pluto. Friday is arguably more positive than Thursday, but we could see two up days there quite easily. So if Tuesday ends up lower on the Mars-Saturn aspect, then it’s possible that the late week Venus influence may only take the SPX back near current levels. A bearish scenario would therefore have declines prevailing into Wednesday and retest support at 1320 and the 50 DMA. The late week would likely push it back over 1330 and perhaps back to 1340. A bullish scenario may see Tuesday actually close higher (1345?) and then pullback to 1330-1335 for Wednesday and then back up to perhaps 1350 or more by Friday. As you can see, I’m not confident in the ability of Saturn and the post-eclipse fallout to wrestle control from all these Jupiter aspects. It’s possible we could fall from here, but it does not seem probable at this point.
 Next week (July 11-15) looks bearish to begin the week as Mercury is in aspect with Mars and Venus is aspected by Saturn. Jupiter will have passed its exact aspect with Pluto by this time, so that is another reason to expect the bears to prevail here. A significant decline is possible, especially if the indexes are bumping up against resistance. The aspects are such that we could test support at 1320, assuming we have put in a fairly solid right shoulder at 1350ish. The following week (Jul 18-22) again tilts bearish, mostly due to the Mars-Ketu conjunction that is closest to exact on the 22nd. The end of July looks more bullish as the Sun and Venus move into range of Jupiter. D-Day for the US debt ceiling debate is August 2. If there has been no agreement reached by then, then the government can’t borrow any more money and risks defaulting. Most observers expect a deal will be hammered out in time, although perhaps with significant spending concessions from the Obama administration. Interestingly, Mercury turns retrograde on Aug 2 and it does so while in opposition to Neptune. This suggests confused (Neptune) communication (Mercury) that may contain a measure of deception or disappointment. While this increases the odds of some problem on this day, it doesn’t seem nasty enough to describe how the market would react to a failure to lift the debt ceiling. Even with this fairly bearish pattern, I still expect the US will reach a deal and avoid default on its debt. But the market may sell-off, perhaps in the manner of "selling the news." Or perhaps the debt deal will contain such reductions in spending that the market will have new growth worries. The first half of August may actually generate more gains, but I would expect more caution in the second half as Mars approaches its square aspect with Saturn. This could be the beginning of the end of the equity market with the Saturn-Ketu aspect looming in September. It definitely does not look good.
5-day outlook — bullish SPX 1340-1360
30-day outlook — bearish-neutral SPX 1280-1330
90-day outlook — bearish SPX 1100-1200
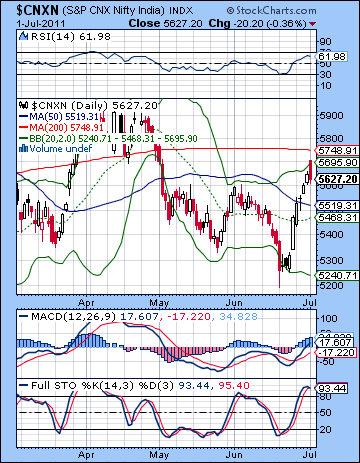 The bulls climbed back into the saddle last week as Greece’s acceptance of the EU’s austerity program reassured investors that all was not yet lost. The Sensex rose almost 3% closing at 18,762 while the Nifty finished at 5627. The planetary energies unfolded somewhat as expected as those multiple Jupiter aspects to Mars, Uranus and Pluto ruled the roost into midweek. In fact, stocks were somewhat more bullish than expected as the rally extended into Thursday when the all-important 5600 level on the Nifty was broken to the upside. While I thought such a test of 5600 was quite possible and even probable, I thought we would get more of a pullback with Friday’s solar eclipse. While Friday was lower, it was far more modest than I expected, and as a result, the Nifty stayed above the 5600 level.
Clearly, bullish Jupiter appears to be taking the reins here as all that aspect activity over the past two weeks is finally bearing fruit. The Saturn-dominated eclipse barely moved Indian markets and US markets continued to rise. Does this mean that Jupiter is ready to assume full control of this market and resume a major bullish advance? While bearish Saturn does seem to be in retreat at the moment and Jupiter is in the ascendant, Jupiter may be less reliable for producing a lasting rally here. That’s because Saturn will only stay weak for another month or so before it strengthens through its aspect with Ketu in August and September. Of course, that may still allow for more upside in the near term, but I would remain quite wary about any rallies here, even if they manage to push above the 200 DMA. The larger problem for the market is that the fundamentals are still in a precarious state. Developed economies are burdened by record levels of debt and are not growing as they should be in this part of the business cycle. The problems that triggered the recession of 2007-2008 have not yet worked themselves out of the system. And it seems unlikely that profligate government stimulus spending can right the ship, as rising debt loads will soon begin to force interest rates higher. This fundamental economic weakness is a millstone around the market and is perhaps analogous to the long term square aspect between Uranus and Pluto. As I have written previously, this long term aspect between these distant outer planets last several years and have the capacity to bring about major changes in the economic landscape. The square aspect between Uranus and Pluto is quite a difficult energy and describes situations where changes are forced and bring painful adjustments. The last such aspect occurred in 1930-1932 in the depths the Depression when some of the fundamental tenets of capitalism were called into question. The current Uranus-Pluto aspect began in 2010 and will last into 2013. This is not to say, however, that we will have an exact repeat of history. But it does suggest that there is a good chance we will see more transformations in the world economy over the next two years and these are likely to make equities less attractive. This is another reason why the current Jupiter-fueled rally is unlikely to mark a significant new bullish chapter. It may have a little further to go, but it is unlikely to last.
 The bulls came back with a vengeance last week as they pushed above the key resistance level of 5600. Certainly, the technical table had been set for a bull feast after the preceding week’s bounce off support at 5200. The Nifty made quick work of the 20 and 50 DMA and then punched through 5600 with ease on Thursday. Friday retested support at 5600 so we now are in a situation where the bulls need to hang onto 5600 or risk falling back into the somewhat bearish trading range of 5200-5600. If bulls can hold 5600, then can make a run at the falling trend line at 5700-5750. This also corresponds with the 200 DMA at 5748 so it’s importance is magnified. It’s close at hand obviously and most investors will be aware of the bullish implications of a close above this level.
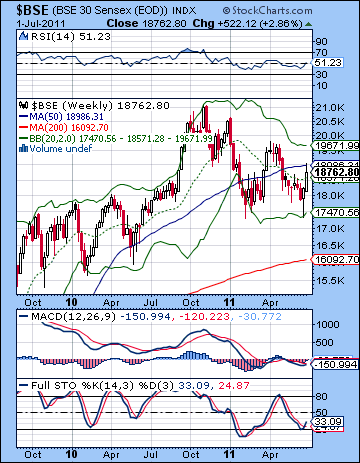
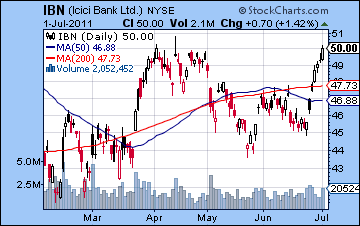
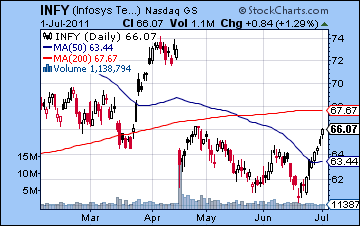
While the bull run was impressive last week, we should note that it is now at the top Bollinger band on the daily chart and therefore new upside may be harder to come by. Stochastics (93) are overbought but MACD is looking strong in a bullish crossover while RSI (61) still has room to move higher before becoming clearly overbought. The 200 DMA continues to slope downward, however slightly, and thus indicates a market that is precarious and possibly trending lower. Even the 50 DMA is sloping downward, thus underlining how much more the market needs to rally before sentiment returns to a more bullish bias. The weekly Sensex chart offers support to the bull case as price has bounced off the lower Bollinger band while Stochastics have also moved higher after touching the oversold 20 line. It is possible that the Sensex is encountering some overhead resistance near the 19K level as it matches the 50 WMA which acted as resistance in the first months of 2011. As if to emphasize this growing strength, ICICI Bank (IBN) has broken above its falling trend line and has now matched its April high. This is an important step towards a more robust revival of the stock price but it will need to close above current level if the rally is going to enter its next phase of challenging its previous 2010 high. We can see the outline of a bullish IHS pattern in May and June with a neckline of 48 and an upside target of 52. It will be interesting to see if it can achieve that last 4% rise. Infosys (INFY) has had a tougher go of it, despite last week’s gains. It has only managed to recapture its post-earnings crash high and is nowhere near to filling the gap. The next step would be reclaiming the 200 DMA which is now just 2% above its current price. A close above this level could generate enough enthusiasm for the stock that could spark a rally. So all eyes are on the Nifty’s 200 DMA and that falling trend line this week. If it can close above 5750, then it would embolden more investors to take long positions. A close below previous resistance at 5600, by contrast, would be a shot in the arm for bears looking for lower prices down the road.
 This week looks more mixed as both bearish and bullish aspects should have their chance to steer the market. The early week has a good chance of seeing some follow through from Friday’s positive result in US markets as Venus is in aspect with Neptune and Mercury is in aspect with Jupiter. This looks like we could test resistance at 5700 in fairly short order and I would not be surprised to see the 200 DMA tested at 5748 by Tuesday. But if the Nifty can climb to those resistance levels early, the midweek suggests there could be some pullbacks as the Mars-Saturn aspect could start to bite on Tuesday or especially on Wednesday. Some of this bearishness could be significant since we are close to an eclipse where Saturn figured prominently by aspect. It is therefore possible that we could see two or perhaps even three down days here between Tuesday and Thursday as the Mars-Saturn energy plays out. The end of the week should tilt towards the bulls again, however, as Venus approaches its aspect with Uranus and then Jupiter. Friday looks like the higher probability day for a gain, although Thursday could end up higher also. A more bearish scenario would have a rise on Monday that tests resistance at 5700 and then down into Wednesday that tests and may break below support at 5600. Friday would see the Nifty close somewhere at or slightly above current levels. A more bullish scenario this week would see the 200 DMA tested at 5748 and then a fall into midweek back to 5600-5650 with another rise that closes near 5700. Jupiter looks quite strong here so it seems hard to envision any significant pullbacks just now, and I would tend to favour the more bullish scenario for that reason.
 Next week (Jul 11-15) looks quite bearish as the Mercury-Mars aspect combines with the Venus-Saturn aspect early in the week. I would expect a significant decline (>3%) on Monday and Tuesday that could seriously test support at 5600. We should see some rebound at the end of the week, but likely not enough to offset the preceding declines. The following week (Jul 18-22) looks more mixed although the Mercury-Rahu aspect could induce uncertainty that compels weak bulls to sell. While it could prove to be somewhat bearish, it does not seem very bullish at all. This suggests that the Nifty will likely move back into the range of 5200-5600 by the end of July. There may be some buying just before the start of August. But early August looks troublesome as Mercury turns retrograde on the 2nd while in aspect with Neptune and Mars. This is not a very good combination of energies, so it is possible markets could fall again. August looks generally bearish, although we could see some gains in the middle of the month. I somehow doubt these August gains will be sufficient for the Nifty to recaptured the 200 DMA (5748) although that will depend on what kind of sell-off we see in July. Late August looks quite bearish, and September more so as Saturn is in aspect with Ketu. 4800 on the Nifty is quite possible by September, and I would not rule out 4000 by December or January 2012 on the Jupiter-Saturn opposition aspect.
5-day outlook — bullish NIFTY 5650-5750
30-day outlook — bearish NIFTY 5400-5600
90-day outlook — bearish NIFTY 4800-5000
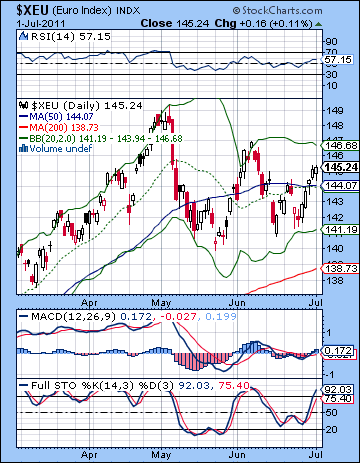 As Greece signed on to the EU’s austerity package and pulled back from the brink, the Euro gained ground last week closing above 1.45. The Dollar Index sank below 75 while the Rupee strengthened to 44.58. While I had expected some early week strength to help the Euro back to 1.44 and the 50 DMA, I did not expect the rally to extend into Friday and the solar eclipse. The bullish outcome on that day was particularly disappointing since it had lined up exactly with the Euro horoscope. It was a poignant reminder just how much astrology I don’t know and indeed how it does not function like a physical science. Despite the rally, the Euro is sitting on the falling trend line off the May high and so we are at an inflection point. Given the fundamental role of the Eurodollar in all financial markets, a break above this line will likely push equities higher for as long as it lasts. On the other hand, a reversal back below 1.45 could take the wind out of the equities’ rally very soon as the risk trade would again founder. We can see that the Euro is actually forming a triangle pattern with a series of lower highs and higher lows. When it breaks out of this pattern, it may be more likely to make a significant price move. Stochastics (92) are now overbought suggesting that the higher prices may become more difficult. MACD is rising and in a bullish crossover and have risen above the zero line — all bullish indications. RSI (57) is rising and has a lot more room to go before touching the 70 line. And despite the recent corrective move in the Euro, it’s worth noting that the 200 DMA still has an upward slope indicating a medium term bullish trend.
This week’s aspects look like they could boost the Euro further. The early week Mercury-Jupiter aspect seems quite likely to see the Euro pop over its resistance level. At the same time, it’s possible that we may have entered a post-eclipse dynamic where bullish aspects have less impact. I don’t think this is the case, but it is a possibility. In any event, some pullback is more likely midweek on the Mars-Saturn aspect although this may only bring the Euro back to test support from the broken trend line at 1.45. That is my most likely scenario anyway. The late week looks positive again for the risk trade, so I would expect the Euro to stay fairly strong going into Friday. All in all, we could see a breakout higher. What’s interesting, however, is that it may reverse quite soon — possibly next week given the range of difficult aspects. This makes it more technically messy, however, but it is important to note the divergences between the technical picture and the astrological one. It would be simpler and more logical for the Euro to reverse this week rather than next, but the astrology does not offer clear support that view. Both are only probabilistic approaches, however, so it’s best to keep an open mind at all times. I think the Euro will likely trend lower through July, perhaps back to 1.40 or even 1.38. Then it should undergo a significant rally sometime in August close to the Jupiter retrograde station. After that, I am expecting a fairly large swoon in September that lasts through the rest of the year.
Dollar
5-day outlook — bearish
30-day outlook — bullish
90-day outlook — bullish
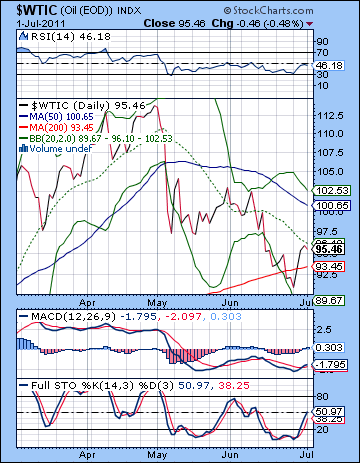 As economic prospects improved with the approval of the Greek austerity plan, crude oil rose back towards key resistance levels closing above $95. The week unfolded more or less according to expectations, as I thought we would get some early week upside that challenged resistance at $95-97. That rally played out in keeping with the strong Jupiter influence on its aspects with Mars and Uranus. The Venus-Ketu conjunction also helped boost sentiment significantly as crude climbed going into Friday’s session. As expected, Friday was lower, although the decline was more modest than expected. From a technical perspective, the bounce was to be expected as crude tested the 200 DMA in the previous week and was appearing to be oversold. However, the rally failed to recapture the 20 DMA which remains in a downward slope. In fact, crude’s rally was arrested right on the sharply falling trend line off the early May high. While we can agree that the steeper the line, the less likely it is to act as resistance long term, crude needs to break out higher here or it will remain mired in a significant bear trend. RSI (46) has recovered off its recent trip to the 30 line so that augurs somewhat positively for a continuation of the rally. MACD has just started a bullish crossover and appears to have formed a positive divergence with respect to a previous low. Resistance is still fairly significant at the neckline of the head and shoulders at $97 so it will be interesting to see if crude can close above that level. If it does, it would take the downside H&S target of $86 off the table. The next level of resistance would likely be at the psychologically important level of $100.
This week offers some bullish aspects that could offset some midweek bearishness from the Mars-Saturn aspect. With Comex closed for a US holiday Monday, Tuesday will open on the Mercury-Jupiter aspect. This looks bullish, although I wonder if it will be able to hold onto the gains by the close. The aspect itself is close to completion and the nasty Mars-Saturn aspect will follow soon after for Wednesday’s session. So I wouldn’t be surprised to see crude test resistance at $97 on Tuesday but the midweek dynamic looks more bearish so a pullback off resistance is more likely then. The late week looks somewhat more bullish again, however, as Venus forms positive aspects with Uranus and Jupiter. Overall, it seems likely that crude will stay fairly strong this week, so I would expect it to remain near resistance at $95-97. Next week looks more bearish as Venus lines up with Saturn, although I would note there is an absence of contacts with the crude Futures chart that reduces the probability of declines somewhat. I think crude will likely trade lower for much of July with that downside target of $86 quite possible. Some rebound in August is also likely, however, so we could see it trade between $86 and $95 until mid-August. After that, it looks likely to undergo a substantial correction.
5-day outlook — bullish
30-day outlook — bearish
90-day outlook — bearish
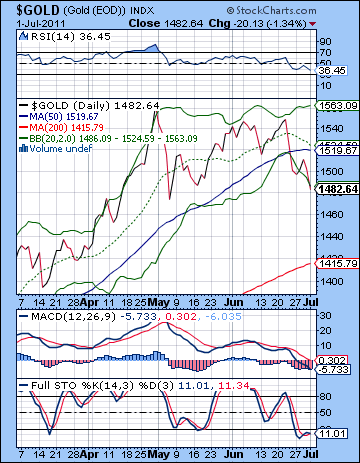 Gold continued its retracement as investors found other places for their assets amidst the apparent stabilization of Greece. Gold declined about 1% on the week closing near $1482 on the continuous contract. This bearish outcome was pretty much as expected, although Friday’s decline on the solar eclipse was quite modest. The early week unfolded according to forecast also as the Jupiter aspects boosted demand for gold and pushed it towards the 50 DMA. It did not quite get to the trend line resistance at $1520 although it did trade there intraday. Once the Jupiter aspects had moved off, gold began to slide and we finally saw it slide under $1500. It’s not exactly a stunning achievement for gold bears, although given the strength of this market recently, it is a start. Gold is testing its horizontal support here from the May low. It still has a little ways to go before testing its rising trend line support of $1450, however. Gold’s technicals are looking quite weak here as RSI (36) shows a clear negative divergence with the May low and it still has more room to fall before being oversold. Stochastics (11) is already oversold but this is a condition that can last for some time as we saw in January. MACD is looking quite sickly as the bearish crossover continues to dog it all the way down below the zero line. Not a pretty picture. A retest of support at $1420-1450 might be enough to turn things around as it would likely produce an oversold condition on the RSI.
This week could see gold stage a bit of a comeback, especially at the end of the week. What is more uncertain is if the midweek Mars-Saturn aspect will be sufficiently bearish to take gold lower. It might, although it lacks strong contacts in the gold natal charts. So I’m on the fence here a bit, although I would tend to think gold will have a bearish bias until Wednesday. After that, it may be able to recover as the Venus influence strengthens in its aspects with Uranus and then Jupiter. It’s hard to know where we will finish the week although I would lean bearish. But if Tuesday is higher, then we could see the week turn green. Next week looks more solidly bearish as Venus catches the full force of Saturn’s aspect. This could be a repeat of last week so I would not be surprised to see gold testing support at $1420-1450 by this time. Gold seems to be embarking on a fairly lengthy correction here that should last into August and September. The second half of August looks bullish, however, so we could get a back test of support at that time. Generally, the market looks weak with gold unable to mount a substantial rally until 2012.
5-day outlook — bearish-neutral
30-day outlook — bearish
90-day outlook — bearish

