- Bearish moves in stocks still likely to prevail as down trend comes to an end near solar eclipse
- Dollar likely to move higher this week; trend is still bullish into September
- Gold remain vulnerable to declines this week; medium term bear trend until October has likely commenced
- Crude to remain bearish with test of support at $70 likely
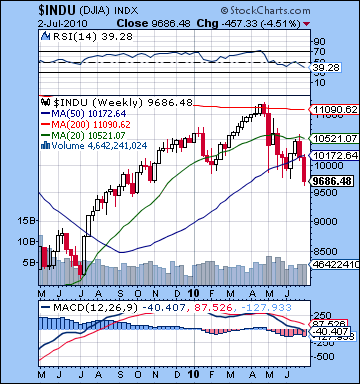 Finally! The market broke through key support levels this week as gloom deepened around the weakening US economy. The broader indexes fell on all five days as the S&P closed at a very slender 1022 while the Dow fell below 10,000 and finished at 9686. This bearish outcome was most welcome as I had anticipated some nasty days with the Sun-Mercury encounter with Ketu. My trouble was that I did not fully predict the extent of the selloff, although I alluded to "the potential for another major move down this week although I cannot quite bring myself to completely expect it". Monday turned out to be a negative day as the Mars-Rahu overpowered the positive vibes of the Sun-Mercury conjunction. I mistakenly thought we could get an up day Tuesday on the Moon-Venus, although the close proximity of Mercury to astringent Ketu made that more of a question mark. Wednesday saw the closest pass of Mercury to Ketu and that is when the S&P broke support at 1040 and it continued to fall further through Friday with an intraday low on Thursday of 1010. As the Sun approached Ketu for Friday’s session, there was little relief as even a valiant attempt at a end of day rally ultimately failed. While I underestimated the downside here, it is encouraging that the medium term influences of Saturn-Uranus-Neptune appear to be playing out more or less as expected. The market continues to weaken here as fears of a double dip recession are growing. The correction has now taken 16% off the April high and threatens to move into "danger territory" beyond 20%. Once the market declines more than 20%, it is no longer a correction, but rather a bear market. Once it falls past that level (976 on the S&P; 9007 on the Dow) it will force more bulls to reconsider their options as the standard mantra of buying of dips will be that much more implausible. Admittedly, those levels may be tough to reach in the next week, so we may have to wait until late July before they become reality. There is still a chance we could get there, however, as the Uranus station on July 5 opposite Saturn definitely contains a lot of disruptive energy. More likely it will take the Mars-Saturn conjunction on July 30 to send the markets over the edge.
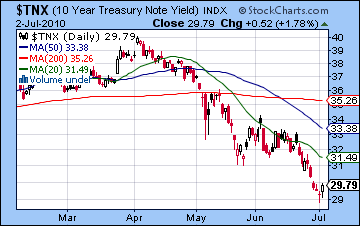
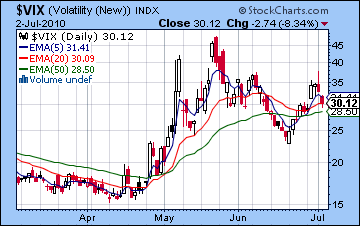
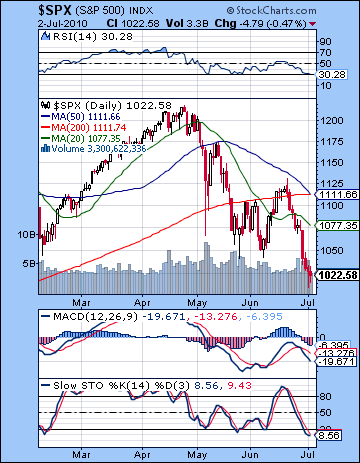 The technical pieces of the bearish puzzle are falling into place now as we can more readily imagine much lower prices over the next 6-12 months. It was all bears last week and they have the badges to prove it now. The key support dating back to the February low at 1040 was broken, thus pointing the way for lower levels in the near future. This also activated the bearish head-and-shoulders pattern since 1040 was the neckline. According to convention, the downside target for a head and shoulders pattern is equivalent to the distance from the neckline to the head. In the S&P, that is 180 points or about 860. On the Dow, that is 1450 points for the downside target of 8350. In my view, these are conservative targets for the eventual lows for 2010 but they may serve as useful benchmarks for a more delimited time frame, such as by the end of the Q3. The other main achievement for the bears last week was the death cross of the 50 and 200 DMA on the S&P at the rather neat number of 1111. This bearish crossing of these two key moving averages occurred last week on the NYSE Composite, but this more or less seals the deal and greatly increases the likelihood of a much deeper move lower in the coming months. The death cross does not have to have immediate effects and indeed it may actually function as a contrarian indicator for a short while and coincide with a rally. The previous crossing occurred in early 2008 and was followed by two positive sessions only to have the market turn much lower after that. The Shanghai market also saw a 50/200 crossing in March this year and prices actually rallied by 5% for the following three weeks only again to succumb to the bearish logic of the thing and fall sharply thereafter. Yield on the 10-year treasury also broke significant support last week as it fell below 3%. This points to rising fear in the market as more investors are seeking safe haven to protect their assets as the next round of deflation beckons. The $VIX also climbed back above 30 last week and we see the telltale crossing of the 5 and 20 EMA thus confirming the new break lower for equities.
For all that bear meat, there are hints that maybe this pullback may be coming to an end. Daily MACD is still in a bearish crossover but a negative divergence is forming with respect to the May 25 low. If we go significantly lower, that could push MACD down further and erase this divergence, but it is something to watch for. Also Stochastics (8.56) are now oversold and we”re on the verge of a bullish crossover. This does not preclude further downside but the likelihood of a bounce increases the longer it remains oversold with the crossover in effect. If that indicator starts to rise (especially over the 20 line) then it would indicate a bounce was in the offing. RSI (30) is very bearish but may also be setting up a bullish divergence since its current low matches the previous May low while prices have made new lows. Since the interim high of June 21, the S&P has followed a downward channel. By Tuesday, the support of this channel will be around 990-1000 while resistance will be in the area of 1070-1080. Interestingly, this resistance level roughly corresponds to the 20 DMA (1077) so that could be an important level at which any rebound rally could start to fade and reverse lower again.
 This week looks like more volatility as it will be marked by the upsetting potential of the Uranus station along with the solar eclipse on July 11. Eclipses tend to increase volatility and can be seen as symbolizing an interruption (just as the Moon "interrupts" the light from the Sun to the Earth). For this reason, a reversal is more likely around the time of an eclipse. That could mean the reversal higher may happen as late as Friday the 9th or perhaps as early as Tuesday the 6th. After the holiday closing Monday, Tuesday will feature Mercury entering the sign of Cancer so this may boost interest in real estate matters, both buying and selling. The Sun will still be quite close to Ketu here so we cannot rule out another down day, although it is likely to be less bearish than what we’ve seen last week. A better set up for gains looks more likely midweek on Wednesday and perhaps Thursday as Mercury forms a minor aspect with Venus. This is a fairly reliable bullish pairing although their close range to aspecting Saturn makes me wonder if the bounce will last more than a day or be that strong. It seems likely that we get at least one decent up day here, perhaps even two. But Friday is the bigger wild card as Mercury and Venus will run into Saturn’s brick wall. I should note that it’s even conceivable this could generate major gains. It has happened before that large multi-planet alignments with Saturn coincide with rallies, but these are not reliable indicators, especially with an eclipse in the offing two days later. I think the more bearish scenario is more likely here with the indexes losing more ground next week, even if we see some upside. If Tuesday ends higher, then there is a good chance that there will be follow through Wednesday. This could take us to 1050 before falling again later in the week. The more likely scenario is that Tuesday is lower, perhaps significantly (1000?) with a bounce Wednesday and then lower again towards the end of the week. In this more bearish scenario we could finish around 990 at some point, presumably towards the end of the week. I would not rule out even lower prices, but it seems like a stretch.
 Next week (July 12-16) looks more clearly bullish as Mercury forms an aspect with Jupiter in the early part of the week. This could be a really strong move up, especially if the previous week has seen a lower low made on Friday. I would not rule out a three-day rally here although it should fade by the end of the week as Thursday’s Mercury-Rahu aspect may change things up. The following week (July 19-23) also seems mostly positive as the Sun approaches a trine aspect with Jupiter on the 25th. Nonetheless, Mars enters Virgo to join Saturn on the 20th so that could make the situation somewhat more tenuous. If we are going to have a relief rally off whatever lows we get in early July, these two weeks are the most likely candidates. A rally up to 1070 is definitely possible and I would not rule out 1100. Of course, that presumes that the bottom doesn’t fall out this week. After that things get interesting as another leg down is likely around the Mars-Saturn conjunction on July 30. Actually things could get ugly before that as Mercury forms an aspect with Saturn on Monday, July 26. Since this is the day that Saturn forms its exact opposition with Uranus, it could be noteworthy. We should move lower into early August with a possible interim bottom around August 9 and the Venus-Saturn conjunction. There is a good chance for a rally in mid-August with a possible peak around August 18/19 and the Venus-Mars conjunction before the market slumps again going into September. I believe we will see a pattern of lower highs and lower lows until November.
5-day outlook — bearish SPX 980-1020
30-day outlook — bearish SPX 950-1000
90-day outlook — bearish SPX 800-900
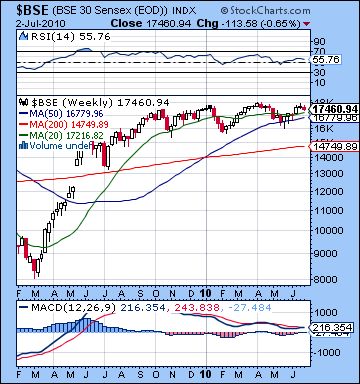 Stocks in Mumbai suffered a modest pullback last week amidst growing worries of a global economic slowdown. The Sensex failed again to crack the 18k level and settled at 17,460 while the Nifty finished the week at 5237. This outcome most mostly in keeping with our bearish forecast, although the decline was not significant. I had expected the early part of the week to tilt bullish on the Sun-Mercury conjunction and indeed Monday was higher, although Tuesday erased those gains perhaps as a reflection of the nasty Mars-Rahu aspect. Wednesday ended higher and the market turned more bearish after that on the (delayed) Mercury-Ketu conjunction and the approach of the Sun-Ketu conjunction for Friday’s session. Not really a dramatic week, but then again I was not expecting that much downside here. The planetary picture nonetheless favours the bears and this is already showing up in most other global markets as the approaching Saturn-Uranus opposition is having some effects. The Indian market has been largely spared thus far owing to positive aspects being cast in the natal chart of the NSE. Transiting Jupiter is sitting close to the 4th house in this horoscope and this has offset the worst effects of the current transit picture. But we are now upon the first phase of this Saturn-Uranus opposition this week as Uranus makes its retrograde station on 5 July. Uranus is a planet that symbolizes shocks of energy, restless freedom and independence and this will likely intensify trading volumes and volatility. Its encounter with cautious, reserved Saturn is create irreconcilable differences planets are diametrically opposed to each other. The result usually favours Saturn, although marked with sudden bursts of energy countered with a retrenchment of position. We may see this restless Uranian energy manifest as a need to re-balance portfolios or change one’s position or outlook. Bulls may shift their outlook to bearish and vice versa. The other element that makes this week particularly interesting is the total solar eclipse set for Sunday 11 July. Eclipses symbolize interruptions of the status quo and are sometimes associated with market reversals. More commonly they highlight times of greater uncertainty and volatility, even if the net result may not always be negative. But the close proximity of the eclipse to the Uranus station definitely favours the bears here since it is fairly unusual to see two events of this magnitude so close together on the calendar.
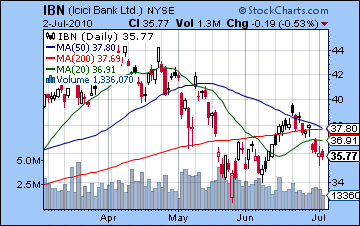
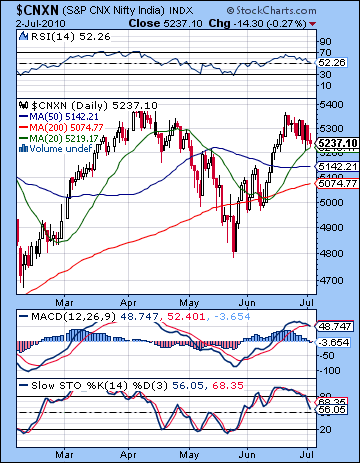 The technical situation moved towards the bearish camp last week. After the high put in Monday, prices largely fell through the week. Daily MACD on the Nifty chart appears to be rolling over and now shows a bearish crossover. This generally portends lower prices in the near future. The absence of a clear negative divergence is somewhat worrying for bears since MACD levels are about what they were near the April highs. RSI (52) is falling although it, too, lacks any clear negative divergence. Stochastics (56) are falling and appear to be headed lower as the market retraces from its recent gains. The weekly chart of the BSE still shows that enduring MACD bearish crossover which should be somewhat comforting to bears. At the same time, it has been in effect for a long time now with little downside move in the market. Volume was not particularly strong this week as both up days came on indifferent volume of 18-19k. Selling was also fairly restrained, however, as the down days were more or less on par with the green days. ICICI (IBN) had a more difficult week losing over 4% on the US exchanges. Perhaps the most outstanding feature of this chart is the imminent death cross of the 50 and 200 DMA. This will surely occur this week and may scare off more investors going forward. The Nifty is only marginally better in that respect as the 50/200 crossover is only 70 points away. If this week is as negative as I think it may be, we could well see that crossover occur. Death crosses may not have an immediately bearish effect on markets, but they cannot be ignored over the medium term. When we saw a death cross in March 2008, the market actually rallied 10% over the next month before it encountered resistances at the 200 DMA and it resumed its decline in earnest. So this crossover is a powerful indicator but not necessarily one that will correspond with its effects quickly. Current Nifty levels are close to support near the 20 DMA at 5210. A break below this line would induce more selling and perhaps test the next level of support at 5142. Below that, the 200 DMA at 5074 also bring in more buyers. The rising channel on this chart dates back to October 2009 and connects the highs and the lows in a broadly parallel formation. For the pattern to continue, a higher high is necessary in the very near future — perhaps around 5450. The bulls attempted to reach that level last week but failed so now the bears will their opportunity to retest the lower part of the channel. Currently, that channel support is about 4850. A successful defense of that level would help the bullish case for the rising channel. A break down of that level would initiate more selling pressure as bulls would have to abandon their hopes for higher highs in the near term.
The planets this week look bearish. We have the Uranus retrograde cycle beginning on Monday evening that could shake things up on either Monday or Tuesday. The Sun will still be just one degree past Ketu on Monday so that may be enough to take prices lower, perhaps significantly. On Tuesday, the Moon enters Ashwini and forms an alignment with Jupiter and Pluto which may buoy sentiment in the morning. It is unclear if this will be enough for a positive close. Wednesday will feature Mercury entering the sign of Cancer and hence real estate shares may hold a greater interest for investors. Nonetheless, the outlook seems bearish overall, especially in the morning as the Moon will highlight a minor aspect between the Sun and Mars. Some midweek strength is likely from a minor aspect between Mercury (4 Cancer) and Venus (4 Leo). This is perhaps somewhat more likely to manifest on Thursday although I would not rule out late Wednesday also. The end of the week looks more negative as both Mercury and Venus line up in an alignment with Saturn. This could affect prices as early as late Thursday or perhaps on Friday. Overall, the week looks like it will take the Nifty down significantly, perhaps under 5000. Given that the technicals are also leaning towards the bears, we have a greater expectation of a down week overall here.
 Next week (July 12-16) looks more bullish. The early part of the week in particular looks very positive as Venus will aspect both Jupiter and Pluto on Monday and perhaps Tuesday. This looks like a major up day, perhaps more than 2%. The greater the selloff from the preceding Friday, the greater the size of this move higher. Mercury will also be in separating aspect with Jupiter at this time, so that will give additional bullish energy to the market. We are likely to see some profit taking as this week progresses, however. The following week (July 19-23) also has a bullish bias, although not as strongly. We have an approaching Jupiter-Pluto square aspect that is mostly bullish in store here that may last until the Jupiter retrograde station on 23 July. So it is quite conceivable that the market will bounce for two weeks after this week’s lows are put in. The gain should range between 5-10% overall and could put the Nifty near the 5200-5300 level. This positive sentiment is unlikely to last, however, as Mars enters Virgo on 20 July. There is some overlap here with the favourable Jupiter patten so this third week of July may see an erosion of confidence. I am expecting a very bearish final week of July as Mars prepares to conjoin Saturn on 30 July. This next pullback will last at least two weeks and extent into early August. Another one to two weeks of gains is possible in mid-August and then the market will slump again in late-August until mid- September. At this point, we are likely to see a series of lower highs as the July high will be lower than the June high (which was lower than the April high). The August high will likely be under 5000 and the September high may not reach 4500.
5-day outlook — bearish NIFTY 4900-5100
30-day outlook — bearish NIFTY 4700-5000
90-day outlook — bearish NIFTY 4000-4500
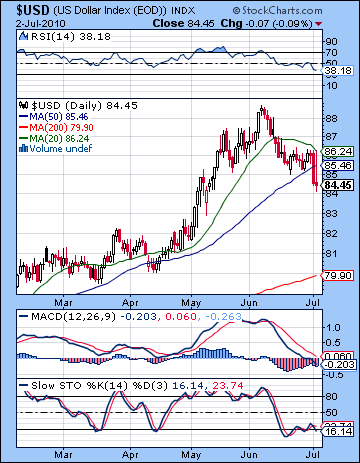 The Dollar suffered the consequences of last week’s bad US economic data as the Euro extended its recent rebound rally. Despite some early week gains, the Dollar closed near 85.5 with the bulk of the decline occurring Thursday. I had expected an interim low last week, although I thought it might come earlier in the week when the Sun-Saturn aspect was at its closest. In retrospect, it was the transiting Sun aspect to natal Ketu that pushed the Dollar lower on Thursday. The aspect was just one degree past exact but still strong enough to draw out pessimism from the larger patterns that were in play. But given last week’s decline, is the Dollar no longer a safe haven? I think it still is, but the Euro was due for a bounce and it has got one here. The US economic data have thrust its precarious economic situation back into the spotlight right alongside Europe and investors are having to reassess relative risk. In all likelihood, Europe’s problems will once again come to the fore and take the focus off the US, at least temporarily. While the technicals are quite weak here, it seems likely that a bounce is in the offing. MACD remains in a bearish crossover and has fallen below the zero line. Worse still, it is in a bearish divergence as it has fallen below its previous low. RSI (38) is bearish while Stochastics (16) are mired in the oversold area. There is some possibility of a breakout higher, however, as lows have been slightly higher. And yet not all is lost as the weekly chart is still features a bullish crossover in MACD. Volume on the UUP ETF is also not that high on the recent down move, suggesting that there has not been a rush to the exits. We can also see that despite this extended correction, the 20 DMA has yet to crossover the 50 DMA. Still, last week’s decline broke below the 50 DMA (85.5) so the next clear level of support would be the rising channel at 83-84.
This week looks more bullish as both Sun and Mars will aspect the ascendant in the USDX horoscope. This could manifest early in the week on the Mars aspect to the natal ascendant. The latter part of the week looks somewhat better, however, as both Mercury and Venus will aspect the natal Sun. The week should therefore post a gain overall with a big move possible, perhaps to the 20 DMA around 86. More weakness is likely to follow as we get some kind of sustained equities rally into late July. We may again touch the rising channel near 84 at that time. Then we can expect a stronger rally move at the end of July and into August which will mirror the selloff in the stock market. We can look for a possible high sometime in September.
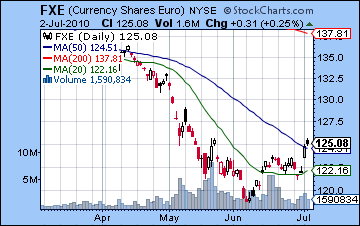 The Euro continued its winning ways last week as it traded as high as 1.26. Whether the market is being manipulated or not, it is nonetheless trying to push higher towards its falling resistance channel. I thought we might get a move up to 1.25 at least, and we did as the Sun-Mercury conjunction worked like a charm. While the Euro is enjoying this bounce, it has yet to really confront any significant resistance level. The falling channel is now around 1.27-1.28. Climbing above that will be very difficult so even if we get an early week test, it is likely to fall backwards and consolidate before trying again. While it has rallied over 6 cents, it had been so forlorn that the bullish crossover of the 20 and 50 DMA is still a ways off. Volume also seems unconvincing here, although we did see a rise in up volume over down volume this week. Nonetheless, if the move was solid, volume should be growing not falling. With that in mind, it is difficult to make a medium term bullish case for the Euro. This week will see Venus enter Leo and hence, the 12th house of loss in the Euro horoscope. This is a negative factor that could well tilt matters towards the negative this week. Early gains are possible as Mercury will come under the bullish aspect of Jupiter on Monday but enthusiasm may slide after that. The late week looks more precarious as Venus and Mercury enter into aspect with Saturn. Next week should be somewhat better although I wonder if we might be looking at a range bound Euro through much of July, say between 1.22 and 1.26. The Euro is likely to fall sharply at the end of the July, however, as Mars conjoins Saturn on the ascendant. Meanwhile, the Rupee edged lower last week closing at 46.8. It’s likely to extend the move beyond 47 this week as the Dollar is very likely to rally.
Dollar
5-day outlook — bullish
30-day outlook — bullish
90-day outlook — bullish
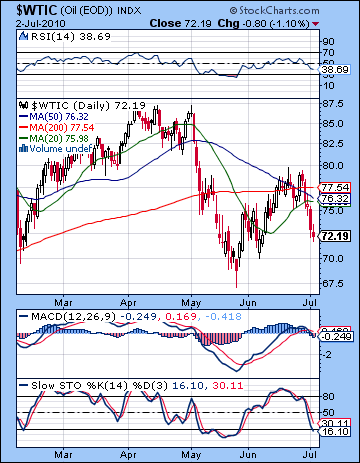 Crude suffered a huge pullback last week as economic slowdown fears gripped the market. Falling in all five sessions, crude closed Friday near $72 on the continuous contract. While I had been somewhat bearish in last week’s forecast, I underestimated the extent of this move thinking that the bulk of the downside would occur this week. I had expected Monday to be higher on the Sun-Mercury conjunction and we did see prices in the green on an intraday basis only to finish in the red by the close. This was perhaps the first clue how difficult the week was going to be. At least, I had allowed for the whole thing to come apart given some equivocal looking aspects in the natal chart. As predicted, the situation worsened as the week wore on with the Mars-Mercury aspect delivering significant pullbacks later in the week as prices fell below the 50 DMA. The technical situation has become dire for crude here as prices have fallen below key support levels and may be heading for a retest of $70. All of this takes place in a context of a bearish death cross of the 50 and 200 DMA that happened last week. To make matters worse, daily MACD is in a bearish crossover and is now rolling over. RSI (38) is falling here and Stochastics (16) have entered the oversold area. This is not to say that crude is primed for a reversal higher since prices can be oversold for extended periods of a correction. It is only when the Stochastics line turns up above 20 that a rally is more likely at hand. Resistance is likely provided by the 50 and 200 DMA around $76-77. Support may be engaged near $70 as that was the immediately preceding interim low. If the selling picks up as I think it will this week, these levels are unlikely to hold. A retest of the May low of $68 is more likely and even that may fall by the wayside. If the the $70 neckline of this rough and ready head and shoulders pattern is broken here it would indicate an eventual bottom around $52.
This week looks fairly bearish. Tuesday could conceivably begin positively as transiting Mercury sits in the 2nd house of the Futures chart. This is not a strong indication however, and given the overall tension implied by the Uranus station from the previous evening, I would not be overly bullish here. A gain is also possible on Wednesday on the Mercury-Venus transit aspect. It seems that we could have one down day and one up day early in the week. The late week period seems somewhat bearish also as Venus falls under the difficult aspect of Ketu on Thursday and Friday. So a retest of the recent low is quite possible here, especially if Tuesday’s session is negative. Assuming we do pullback further this week, the following Monday July 12 looks quite bullish as the Moon and Mercury form positive aspects with Jupiter. This may be particularly bullish for crude since all these planets will be in water signs. The rally will likely extend into Tuesday as Venus forms a nice alignment with both Jupiter and Pluto. The trend should be positive until July 19-23 and the start of the Jupiter retrograde cycle. Towards the end of that week, we may see the bearishness on the rise again as Mars enters Virgo and prepares to conjoin Saturn. A major decline is possible soon after that, perhaps on July 26 when a number of tense aspects will occur in the Futures chart. Another rally is possible going into mid-August and then prices will likely dip again as we enter September. After a bounce into perhaps the third week of September, we will likely fall hard again at the end of the month. The period around September 27 looks particularly bearish. This will likely be a series of lower lows that characterize bear markets.
5-day outlook — bearish
30-day outlook — bearish
90-day outlook — bearish
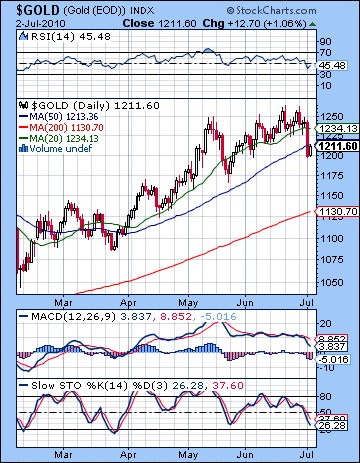 Gold got hammered last week as the growing possibility of a double dip recession reduced inflation fears and hence the attractiveness of this traditional inflation hedge. After falling 3% on Thursday alone, gold finished around $1211 and below its 50 DMA. I had expected more early week upside on the Sun-Mercury conjunction which I thought might offset the likely bearish move later in the week. Gold did attempt a rally on Monday but it didn’t stick and we ended lower. After a couple of mostly flat days, the sellers arrived on Thursday en masse very close to the time of the Sun-Ketu conjunction that I had suggested would put added pressure on gold. I had no clear sense the selloff would be that large, as most of my downside targets were completely blown away. I had wondered if we could get back to $1200 by the end of July! Last week’s action broke through support in the small wedge and tested support in the large wedge pattern around $1200. This was a critical development and increases the chances of lower prices in the medium term. Monday’s rally attempt did not quite make it to $1270 and hence the resistance of the small wedge survived intact. We may well have seen the high for a while here given the worsening technical picture. Daily MACD is in a bearish crossover and heading south rapidly. RSI (45) is bearish and in a negative divergence with respect to the previous May low. Stochastics (26) are bearish and appear to be wending their way the oversold area quickly. Volume in the GLD ETF is assuming a bearish character as big volume days are down and light volume days coincide with gains. Resistance is now at the bottom of the small rising wedge around the $1250 area. The 20 DMA at $1234 may also offer resistance in the event of a rally in the near term. With support from the 50 DMA now called into question, a more reliable line of defense for the bulls may be the 200 DMA around $1130.
This week may well continue last week’s bearishness. On Tuesday, the Sun will still be in fairly close proximity to Ketu so that should damage gold further. Also we should note that Venus enters Leo this week where it will join malefic Mars. While Venus often carries a positive influence when it transits Leo, the presence of Mars in the same sign may tarnish the allure of the shiny yellow metal. A midweek gain is possible on either Wednesday or early Thursday on the Mercury-Venus aspect. The end of the week looks less promising again as the Sun is in aspect with nasty Mars. Overall, the downside risks outweigh the prospects for gains in the near term this week. There is a good chance we will trade below $1200 this week, perhaps significantly below. Next week looks much more bullish as Venus will form a very nice alignment with Jupiter and Pluto early in the week. This is unlikely to take us all the way back to previous highs, and it may have a tough time retrieving the $1240 resistance level in the small wedge. Gold looks more bearish from July 19 to about August 4. A 10% downside move is very possible here, perhaps more. The trend should be mostly down until early September at least. It’s hard to know where it will end up but $1000 may be in th cards, as there will be a lot of buyers around that level.
5-day outlook — bearish
30-day outlook — bearish
90-day outlook — bearish

