- Equities outlook uncertain after rise into Monday; overall direction is still down
- Dollar to extend gains this week; medium term bullish trend still in place
- Gold vulnerable to pullback as Sun moves into Gemini Tuesday
- Crude oil may correct into early July
- Equities outlook uncertain after rise into Monday; overall direction is still down
- Dollar to extend gains this week; medium term bullish trend still in place
- Gold vulnerable to pullback as Sun moves into Gemini Tuesday
- Crude oil may correct into early July
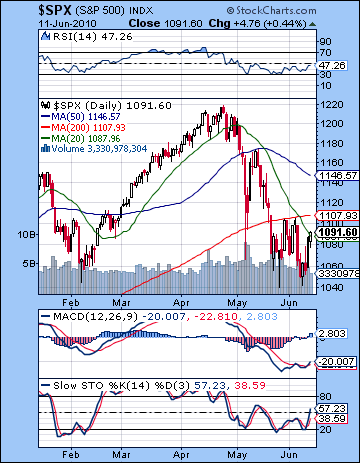 Friday’s rally capped another eventful week in the markets as we saw the lows retested early as traders maintained their fixation on the beleaguered Euro. The Dow closed up less than 3% for the week closing at 10,211 while the S&P finished at 1091. This bullish outcome was largely in keeping with last week’s forecast although we did not quite climb all the way back to test resistance at the 200 DMA at 1107. In retrospect, I was overly optimistic due my uncertainty over Monday’s Mars-Jupiter-Uranus aspect. I leaned towards a bullish result there but we instead went lower to retest 1040 before finally moving higher for the end of the week. It definitely was "white knuckle time" on Monday and Tuesday when it was an open question if support at 1040 would hold. I tended to think it would as I did not see enough negative planetary energy to create a wave of panic selling that would accompany a breach of such a key support level. I thought Tuesday would be bearish on the Mercury-Saturn aspect and while we did see the low for the week at 1042 then, bargain hunters came in and saved the day. We were also fortunate to call the basic outline of the bounce later in the week on the Mercury-Jupiter-Uranus pattern. I had thought that both Wednesday and Thursday would be positive but only Thursday turned in a positive performance. It’s worth nothing, however, that Wednesday saw a decent intraday rally but it failed to hold by the close. It was very important to see the market rally on the Mercury-Jupiter combo because that confirms that Jupiter has escaped Saturn’s short term influence and is acting again like a bullish planet. At the end of May, we saw how the Jupiter-Saturn opposition aspect was largely unhelpful as the market saw more losses as Saturn neutralized Jupiter’s potentially positive effects. In any event, if Jupiter has once again returned to form, then we may see more bullishness in the near term. But it’s important to recognize that while the Jupiter-Uranus conjunction may provide some fuel for the bulls, it is separating now and hence potentially weakening. And since Jupiter is moving faster than Uranus, it leaves Uranus more open to Saturn’s bearish influence as the Great Malefic is now moving forward again after its direct station on May 30. Admittedly, it’s a jumbled planetary picture which must seem confusing to non-astrologers — and astrologers, too, for that matter! As I’ve noted previously, this is a result of this very rare alignment of many outer planets. Saturn (4 Virgo), Jupiter (6 Pisces), Uranus (6 Pisces), Neptune (4 Aquarius) and eventually Pluto (10 Sagittarius) are all clustering around the same degree of their respective signs in the next two months. And whenever planets are in the same degree, they are "in aspect" and begin to resonate with each other. It is this simple geometric relationship that is at the heart of astrology. The singularity of this pattern means there are going to be some very scary times ahead — both for the markets and the world as a whole.
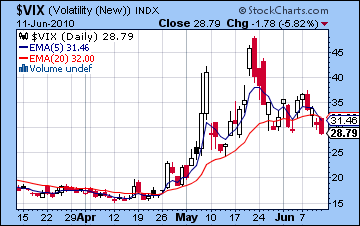
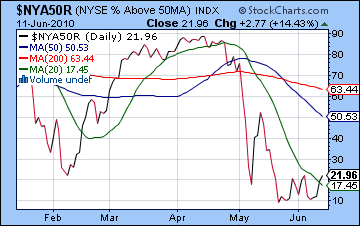
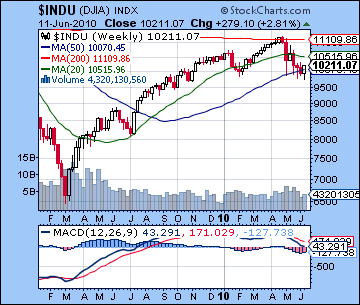 The technical picture received a much-needed boost as the February low of 1040 was tested on Tuesday and held. (about 9800 on the Dow). In fact, bulls can point to the fact that Tuesday’s low of 1042 was actually higher than the May 25 low of 1040. Higher lows are what rallies are made of. We can also note that daily MACD on the S&P is forming a bullish crossover and has turned higher. This became evident on Thursday and widened with Friday’s gain. There is also a clear positive divergence here with higher lows in MACD when compared with May 25 despite the fact that closing prices were lower last week. Slow stochastics also turned higher off a higher low above the 50 line and shows more momentum building. RSI (47) is also on the rise and shows higher lows and higher highs since the May low. On the bearish side, we can still note weak volume on the up days as a sign that this rebound rally may not have much conviction. All the up days this week occurred on lower volume than the down days. So while the double bottom is a very reliable indicator in most circumstances, there is a significant segment of market participants that are skittish about jumping back in. And I can’t blame them. The medium term indicators do not look good. MACD is forming a lower low compared with the February low and hence sets up a negative divergence that suggests lower prices in the near future. The weekly Dow MACD still looks bearish and points to significantly lower prices to come. Our $VIX indicator is working fairly well here as we saw a crossover of the 5 and 20 DMA late in the week suggesting higher prices in the short term. The correction has thus far formed a falling wedge pattern which culminates around 975 on the S&P in early July. While this is a bullish pattern that suggests an eventual rise in prices off the bottom, we’re still stuck inside it. A break out above 1100 this week would perhaps nullify it but it could just as easily be a passing head fake higher that doesn’t last. That is my expectation actually: a one or two day fake out higher above 1100 and then back down into this falling wedge for the rest of June and into early July. There’s a ton of resistance above 1107 and the 200 DMA so I would be very suspicious of any closes above that level since they are unlikely to last. Above that, the 50 DMA at 1146 would be the next major level, although 1130 may bring in more buyers since it is a significant Fib number. Support is around 1080 now since we bounced off that a few times in Friday’s session. Below that, we may revisit 1040 quite quickly. And if that key low breaks, we will likely see a one day panic type selloff down to 1000 or perhaps 980. This roughly correlates with the bottom of the falling wedge off the May highs and also matches with some horizontal support that goes back to 2009. 920 stands out as more support, but I do not things to get that dire just now. Still, anything is possible in this crazy market with these frightening planets.
 This week looks like the bulls will dominate the early part of the week and then give up towards the end. Venus forms an aspect with Jupiter-Uranus on Monday and Tuesday so that should generate some significant gains over the two days, perhaps on the order of Thursday’s 3-4% gain. If this were to occur, we would vault over the 200 DMA and perhaps close around 1120-1130. This seems like a tall order but sentiment has changed here and bears are caught in potential a short squeeze. If we go through 1107 quickly as I believe we might, then adding another 20 pts on the SPX would happen soon after. Monday looks to be the more reliably bullish day as the aspect has not yet perfected. If we see a big up day Monday, then Tuesday should be treated with more caution. While the Venus aspect will still be very close, it will be past exactitude and hence more prone to weakness. Perhaps we open higher Tuesday but fall through the day. That is one possible scenario. I would definitely not trust rallies to last very long. It’s possible we could trade above 1100 until Wednesday, but the odds increase of a selloff the further along we go. Tuesday could see a new vibe enter the mix as the Sun enters Gemini. There’s nothing inherently bad about Gemini except that it comes under the aspect of Saturn which will be more exact and hence more powerful as we move towards Friday. And Ketu currently resides in Gemini and so planets that share a sign with Ketu will tend to suffer somewhat. Wednesday sees Mercury form an aspect with Ketu and this could well correspond with a major down day. Mercury will then form two minor aspects with Neptune and Saturn on Thursday, so we should be bearish there, too. On Friday, the Sun makes its closest aspect with Saturn, so that also does not bode favourably. So my best guess here would be a big rally on Monday followed be growing weakness thereafter. I believe many investors will short at key resistance levels like 1100-1110 so that may get the ball rolling down the hill once again. While the end of the week looks bearish, I still think there’s a good chance we will finish above 1040 by Friday. If we don’t, then look out, because the low may occur as late as June 30 – July 6. Uranus turns retrograde on July 6 so that period will be worth watching carefully.
 Next week (June 21-25) may begin positively as Sun aspects the Jupiter-Uranus conjunction. I would expect one or probably two up days there Monday and Tuesday. Things look more negative after that on the Mercury-Saturn aspect with the possibility of a gain Friday the 25th. It is possible that the week is mildly positive. Perhaps we will even trade within the range of 1040-1100 for this week. Prices look more vulnerable in the last week of June as the Sun conjoins Mercury and both approach Ketu. This is perhaps the time that we fall through support at 1040 and make new lows. July looks more positive so some kind of rebound rally is likely then. It may well last two to three weeks. If we break support at the end of June, then the July rally may only get the market back to this level at its peak. That would be a very bearish signal as previous support becomes resistance. That would set the stage for the massive selloff (or crash) that we expect in August and September. A somewhat more bullish scenario might be that we break support at the end of June but not by much and the July rally takes us back above 1040, perhaps all the way to 1080-1100 and the 200 DMA. This would be the result I most favour, although I am not dogmatic about it right now. A still more bullish possibility would be that support holds at the end of June at 1040 and that we get a high of 1150 in mid to late July and fall sharply thereafter. This would complete the classic head-and-shoulders pattern that many investors are expecting. While appealing in its simplicity, I’m less inclined to believe it will happen.
5-day outlook — bearish SPX 1040-1080
30-day outlook — bearish SPX 980-1020
90-day outlook — bearish SPX 800-900
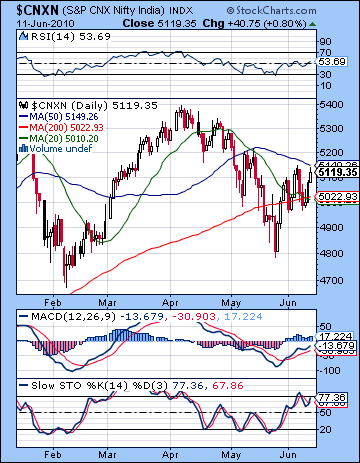 Volatility continued to characterize equities markets as uncertainty about the Eurozone cast a pall over early week trading. Despite a late week recovery, however, stocks ended marginally lower as the Sensex closed at 17,064 and the Nifty at 5119. This mixed outcome was not wholly unexpected since I had been uncertain about Monday and the Mars-Jupiter-Uranus aspect. As it happened, it was negative and sent prices tumbling. Tuesday was lower as expected on the Mercury-Saturn aspect as the Nifty closed below 5000 and the 200 DMA. As forecast, we saw sentiment turn midweek as Venus entered Cancer and Mercury formed a nice aspect with Jupiter. I thought Thursday might be the most bullish day of the week and it was, as the averages climbed 1.5%. The good mood extended into Friday despite my call for a possible down day on the Mercury-Mars aspect. The gain was more muted, however, and thus offered some evidence of the negative influence of Mars. Overall, Indian stocks fared quite well compared with other global markets as the Nifty closed just under its 50 DMA. That said, we should not be complacent since the current planetary alignment still has the capacity to inflict damage throughout the world financial system. Sentiment got an important boost last week from Jupiter and Uranus as they moved away from Saturn’s bearishness. While this conjunction is quite positive, there is a genuine question about its durability. Since Jupiter moves at a faster rate than Uranus, these two planets are separating and with it, perhaps a greater appetite for risk. And not only is Uranus losing the beneficial influence of Jupiter, but here comes Saturn again forming its final opposition aspect on 26 July. Admittedly, this is slower, almost background influence that needn’t activate selling exactly on the date of its aspect. But as we saw in April, the exact dates of these aspects can sometimes correspond with significant reversals. Global stocks made their top on 26 April which happened to exactly correspond with the date of a previous Saturn-Uranus opposition. I believe there is a good chance that the 26 July may mark the beginning of a new down leg. Another date to watch is 27 June when Saturn forms a tense aspect with Neptune. Since pessimism of Saturn and lassitude of Neptune do not mix well, we should expect the time around this aspect to be weak for stocks. Even if we don’t see a big down move, it nonetheless makes rallies less likely. And on 6 July Uranus will turn retrograde whilst in a very tight two degree aspect with Saturn. As we have seen, there is a significant correlation between reversal in planetary direction (forward to retrograde and vice-versa) and the overall trend in the market. So there are a lot of very important dates coming up over the next two months that will likely make life very difficult for the bulls. 4000 on the Nifty (Sensex = 13,000) is my target for September, but we may end up overshooting that on the downside.
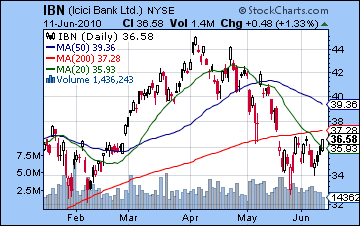
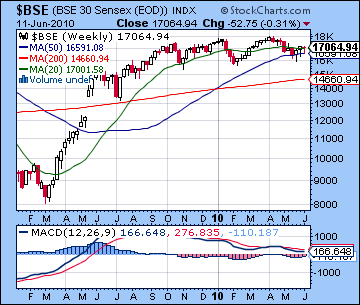 The technical picture offered sustenance to both bulls and bears last week. The bulls can rightly point to a successful defense of the 200 DMA as Tuesday’s close below it did not last into the following day. The 200 DMA is a key technical support level and divides the market in two: if prices are below, it is a bear market and if prices are above, it is a bull market. The fact that bulls pushed up stocks back to the 50 DMA was a significant victory for them last week. The Daily MACD on the Nifty is also in a strong bullish crossover, although it is still below the zero line. Slow stochastics are also trending higher and are almost at the critical 80 line, a sign of bullishness. RSI (53) is also on the rise and has followed prices up off the late May bottom. The bulls can also justifiably note that there are no clear negative divergences in these indicators. Price and momentum are moving in lock step. This suggests that the market may be salvageable. On the other hand, we did see a very ominous crossover of the 20 and 200 DMA at the end of last week. Along with the 50/200 DMA crossover, the 20/200 is a key turning point in the market trend. The last time is happened was in early 2008 after stocks had begun their long descent from the January 2008 all-time high. While there can be some lag between the date of the crossover and the market turning lower, it is a fairly reliable indicator of a lower market in the near future. Volume was another factor that sides with the bears. Selling rose to 26k and 27k on the down days and peaked at 36k on the reversal day Wednesday. But follow through volume on the up days Thursday and Friday sagged back to 24k. When up days are not confirmed by higher volume, it is a bearish signal. The same thing can be seen in the ICICI chart (IBN). The late week rally occurred on falling volume as the stock continued to trade below its 200 DMA. If prices do not rise above the 200 DMA soon, bulls will gradually give up the fight and sell out. MACD on the weekly Sensex chart is also looking quite ugly with both the bearish crossover and the negative divergence still indicating lower prices in the near future. Immediate resistance on the Nifty is still the 50 DMA at 5149. Above that, the bottom of the rising wedge at 5250 may also bring in more sellers in the event the rally continues to that point. This will form the right shoulder of a rough head-and-shoulders pattern that will signal lower prices in the weeks ahead. The exact price of that mirror-image right shoulder should be around 5300 but we needn’t get back to that point exactly in order for the pattern to become recognizable and hence effective. Support is still the 200 DMA at 5022. As we saw last week, one close does not mean that much. But two or three straight closes below it will cause the bulls to fret that they are on the wrong side to the market. Beyond that, the May low of 4800 may offer the bulls hope of a double bottom from which to rally. Actually, this is a decent set up and could well spark a rally if it happens. If we head lower as I think we might, there is a reasonable chance we could bottom out in early July around 4800. This would then spark a rally into late July. It is unlikely that it climbs all the way back to 5300-5400 from there, however.
 This week looks to begin favourably as Venus aspects the Jupiter-Uranus conjunction on Monday and Tuesday. Monday looks like the better of the two days as the Venus aspect will still be applying. Tuesday is more of a question mark, however. Venus will be past exact (but still close) so that could generate gains but by this time the Sun will have entered Gemini. This is a potential problem since Gemini is currently afflicted by both Saturn and Ketu. Saturn aspects Gemini and hence the Sun’s entry here will tend to reduce investor confidence and encourage selling. Ketu is also bearish because it is a anti-materialist planet that does not look kindly on the mundane affairs of money and investment. As both Sun and Mercury approach to conjoin Ketu over the next two weeks, we may see increased desire for investors to liquidate their positions and seek the spiritual comfort of otherworldly Ketu, at least in the metaphorical sense. Wednesday will see a potentially troublesome aspect between Mercury and the aforementioned cosmic sadhu, Ketu. It is possible that Wednesday won’t be that bad, however, so we should look at this as a possible flat day. Thursday and Friday seems pretty negative as the Sun-Saturn aspect becomes closer as we get to the end of the week. Friday looks worse. The only clearly positive day that I can see here is Monday and after that, it’s more uncertain. While I very much doubt we’ll have four losing days in a row, I do think the tenor of the market will turn decidedly mixed to negative after Monday.
Next week (June 21-25) looks difficult, albeit with a possible bullish beginning on the Sun-Jupiter aspect. The mood will sour by Wednesday, however, as Mercury enters Gemini and falls under that same Saturn aspect. It’s possible we will still be trading above the 200 DMA at this point although that is not clear. The following week (June 28-July 2) looks very bearish as nasty Mars is in aspect with malicious Rahu and then Sun and Mercury conjoin with ethereal Ketu. The simultaneity of these two aspects greatly increases the chances of a big move lower. A more bullish scenario would be that we form a bottom around 4800 around 6-8 July and then move higher for another two weeks. A more bearish outcome would be that we break through 4800 sooner (June 24th?) and then fall down to 4500 by early July. This would eliminate the bullish double bottom pattern and make the subsequent rally that much weaker and short-lived. A deeper move down in August would then be easier to rationalize in this model. Indian stocks have held up very well lately considering all the hand wringing over Europe, so I’m loathe to get too bearish. Overall, I would say there’s a 50:50 chance for both scenarios. Either way, we are going lower.
5-day outlook — bearish-neutral NIFTY 5000-5150
30-day outlook — bearish NIFTY 4800-5000
90-day outlook — bearish NIFTY 4000-4500
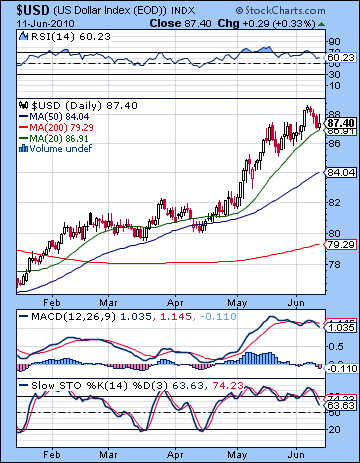 As Euro phobia gradually abated, the Dollar lost some steam and closer lower last week. After a brief pop up to 88.7 on Monday, it tumbled back down to earth closing below 88. This negative outcome was largely in keeping with expectations as the Mercury aspect to natal Saturn in the USDX chart reflected sagging interest. Friday’s up day was also foretold by the Venus aspect to the natal Sun. The Dollar still looks pretty strong here as it is still trading above its 20 DMA at 86.91. Since the equity correction in late April, it has never traded below the 20 DMA and has demonstrated renewed bullishness. This is unlikely to continue through the summer however, but the broader up trend would still appear to be in place. Of course, we can still see signs of a possible break down in the daily MACD that shows a bearish crossover and a negative divergence. This indicator alone should give bulls considerable pause since it suggests a larger correction is imminent. Stochastics have broken decisively below the 80 line and may well be headed towards correction. RSI (60) is also showing a clear divergence of falling peaks as price has increased and does not bode positively for the near term. How long would such divergences persist before the price falls into line? As the equity markets taught us (or better, schooled us) this past winter, divergences can last for months without major correction. I would not rule out a similar scenario here for the Dollar. Volume on the UUP ETF has continued to ebb through both up and down days, so that may not be seen as confirming the bearish trend. It is more bearish is volume rises on selloffs. Falling volume on selloffs can be interpreted either way since many investors are choosing to hold onto to their long positions despite falling prices. As always, the weekly chart offers a better case for the bulls as MACD shows a bullish crossover. Momentum indicators have a better track record in the weekly chart, and that is reflected in the movement of the SPX chart through the winter. Unlike the daily chart which did show a divergence for months, the weekly chart only began to show a crossover after January, and a divergence after March. In any event, I would still not rule out a correction to the 50 DMA (84) at some point this summer. Since I am expecting more gains over the next couple of weeks, it will be interesting to see how high the Dollar can go. The previous March 2009 highs of 89 loom very large in this respect. Any break above that level could shake up the market considerably and lay the groundwork for further Dollar gains. I’m not sure that we get there by the end of June but new highs are looking increasingly likely sooner rather than later.
This week looks fairly bullish for the Dollar once we get past the Venus-Jupiter-Uranus alignment on Monday and Tuesday. Tuesday may actually mark the beginning of the next move up since Venus will form a nice 135 degree angle with the natal ascendant. This is perhaps further evidence that the equity rally is unlikely to last into Tuesday. Wednesday also looks positive as Mercury forms an aspect with natal Jupiter. Thursday is more of a toss up (but leaning bullish) with Friday hinting at more gains as Mercury then aspects the ascendant. So even if Monday’s decline is significant back below 87, there is good reason to expect it to close above 88 and indeed, even higher than that. Next week looks more mixed with some serious early losses on Monday and Tuesday. We should be back in rally mode by Wednesday and stay more or less positive until Friday. The end of June also looks more mixed with gains possible on the 28th but losses thereafter. We could see a period of consolidation that lasts until late July. The next exact Saturn-Uranus aspect occurs on July 26 and Jupiter turns retrograde on July 23 so that general time frame are possible trend reversal points after which the Dollar may move higher.
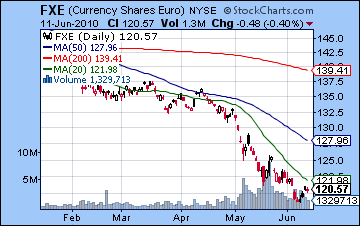 The Euro has finally been admitted into rehab to begin its convalescence. The medication appears to be working already as it managed the forecast bounce and closed above 1.21. This outcome was in keeping with expectations as the good vibes from the Mercury articulation of the Jupiter-Neptune conjunction lifted all boats, even the Titanic-like Euro. I had wondered if we might see more of a short squeeze back to 1.22 and the 20 DMA at least, but it remains to be seen if it can climb back to those levels here. Daily MACD shows a bullish crossover and a divergence but the volume belies much chance for a major rebound. The up days really did not bring in a lot of new buyers here so there is no reversal at hand. On the plus side, we should nonetheless note that up day volume exceeded down day volume last week so that is something for the bulls to cling to. This week offers a good chance of extending the bounce into Monday as Venus sits on the 11th house cusp (= gains) while in aspect to Jupiter. I would not be surprised to see a two cent move here. Things get decidedly murky after that as the transiting Sun comes under not one but two Saturn aspects: the Sun is squared by Saturn in the current sky on Friday/Saturday and also falls under the sextile aspect of natal Saturn in the Euro horoscope on Friday. So we could well be testing the lows again by Friday. Transiting Saturn (4 Virgo) is now moving forward and is again threatening the ascendant in the Euro chart at 5 Virgo. This is likely to keep the Euro in rough shape until the end of June. Meanwhile, the Rupee staged a decent comeback last week closing at 46.8. This was in keeping with expectations as we thought the full flowering of the Jupiter-Uranus conjunction would bring out the best in emerging market currencies. The trend is unlikely to last long, however, and we should again see the Rupee weaken to over 47 by Friday.
Dollar
5-day outlook — bullish
30-day outlook — bullish
90-day outlook — bullish
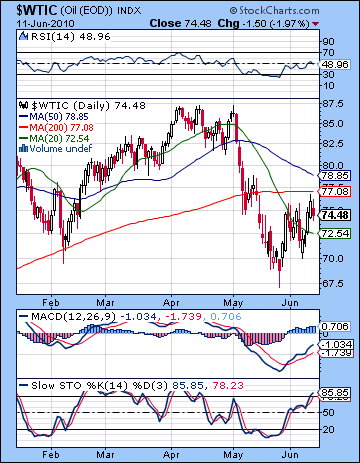 Crude extended its rally off its May low last week and gained 4% closing above $74. This was in keeping with expectations as benefic Venus did its job as it moved into the 2nd house of wealth in the Futures chart. We could also note that Venus entered Cancer on Wednesday and thus gave a boost to sentiment surrounding liquids. Since Cancer is considered a water sign, a positive planet in a water sign will tend to improve the fortune of liquids such as crude. While I missed Monday’s decline, I did correctly note the possibility of a decline Friday as natal Mars cast its shadow over the transiting Venus. While the rebound here has been solid enough, questions remain about its staying power. Daily MACD is in a nice bullish crossover and is again approaching the zero line. Stochastics are once again above the 80 line and RSI (48) appears to be building towards a series of higher peaks on this little rebound. But how far can it go? Unless or until it trades above the 200 DMA, all of these hopeful technical indicators may not amount to much. We have a nasty 20/200 crossover since late May that isn’t on the verge of being undone anytime soon and the 50 DMA is falling and fast coming up on its own crossover of the 200 DMA. It is not a chart that should give bulls much hope over the medium term.
This week may begin well enough on Monday’s Venus-Jupiter aspect but all bets are off after that. Monday could see a terrific spike because the Sun (29 Taurus) will conjoin the ascendant in the Futures chart. Tuesday could also squeeze out a gain as Mercury aspects the natal Sun-Uranus aspect. By Wednesday, however, transiting Venus (8 Cancer) will fall under the aspect of natal Saturn (9 Libra) and then on Friday the Sun will conjoin natal Rahu. It does not bode well for a bullish week. I would therefore expect to see a pop up to the 200 DMA around $77 by Tuesday and then a selloff after that. It’s possible crude could test its recent support levels by Friday. It may be difficult for that support to hold through to early July as there are a number of tense aspects to contend with. Another rally attempt in July is likely as Jupiter (9 Pisces) will approach its July 23 station while in aspect with natal Saturn (9 Libra). It’s pretty much downhill after that.
5-day outlook — bearish
30-day outlook — bearish
90-day outlook — bearish
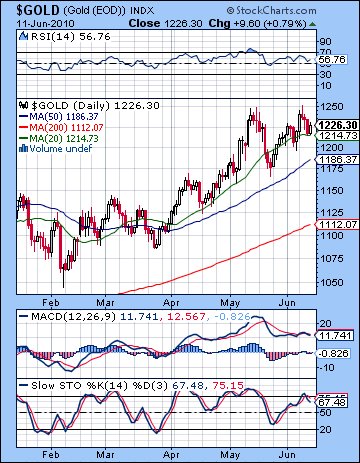 Gold was noteworthy last week for matching its previous high of $1250 on Tuesday and then slipping back before closing slightly higher overall at $1230. Gold continues to enjoy safe haven status here as currency worries plague the financial world. What many gold bulls are not factoring in is the deflationary pressure the yellow metal will soon come under as the next wave of de-leveraging will force some gold investors to liquidate their holdings in order to raise cash. I thought we might see more weakness later in the week and that largely came to pass as the return to equities prompted some selling. However, I overestimated the selling pressure as gold continues to defy gravity near its recent highs. The technical picture looks increasingly mixed as a potential bearish double top has formed. Daily MACD is also showing a negative divergence as the second top occurred at a much lower level on the MACD scale. RSI (56) is also doing a slow fade here as we can spot a series of declining peaks despite the attempt for new highs last week. Even more telling perhaps was the volume story on the GLD ETF chart. Tuesday’s dash to $1250 occurred on low volume — just half of what we saw on its first push to $1250. This is not suggestive of a big run higher here as there are fewer long positions in play. We found support on Thursday near the 20 DMA at $1218 but a pullback would likely take us down to the 50 DMA at $1186 fairly quickly. Below that we could see some support around $1160.
This week looks bearish for gold. Monday may begin well enough as the Venus aspect with Jupiter could restore some of its shine but it looks like a minefield after that. The main planetary significator for gold, the Sun, enters Gemini on Tuesday. This could well alter sentiment on gold in a fundamental way. While Gemini isn’t that bad for the Sun, the current situation makes Gemini more inimical to its energy. First, Saturn is aspecting Gemini and so the Sun will come under its pessimism here, especially later in the week when the aspect is at its closest. Also, Ketu is currently transiting Gemini. Ketu is an anti-materialist planet that tends to have a bearish effect on planets that it associates with. The conjoining of the Sun with Ketu this week will increase the pressure on the gold. At the same time, we should note that this conjunction will still be quite wide and hence fairly weak over the next few days. It becomes exact on July 3 so we should keep that date in mind as a possible low point for gold in any correction process. This is not to say that gold will head straight down between now and then, but it is one of the key factors worth watching. July could be a time of recovery for gold as transiting Jupiter will make an extended aspect with the natal Moon in the GLD chart.
5-day outlook — bearish
30-day outlook — bearish-neutral
90-day outlook — bearish

