Summary for week of June 20 – 24
Summary for week of June 20 – 24
- Stocks could decline in first half of week, with more bullish moves later
- Dollar could rise in first half of week but gains may be threatened by Friday
- Crude prone to more selling early in week with possible recovery later
- Gold under pressure early but recovery likely by Friday
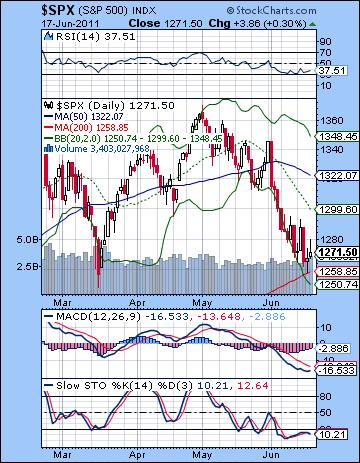 After a volatile week marked by Greek default fears and China’s ever-tighter monetary policy, stocks ended largely flat as the latest EU bailout offered fresh signs of hope. The Dow significantly retested the 12K level but closed slightly higher at 12,004 while the S&P500 finished at 1271. While we got a nice decline on Wednesday’s lunar eclipse, the market was more bullish than I expected. Although I allowed for the possibility of some early week gains, I did not fully anticipate that the market would stay positive across both Monday and Tuesday. Fortunately, Wednesday’s sell-off arrived right on time as the eclipse highlighted pessimism from Saturn’s direct station just three days previously. As expected, the end of the week was mostly bullish as the Mercury-Jupiter aspect lifted sentiment after Wednesday’s decline and the initial bearishness at the opening bell on Thursday.
Given we’ve just had a Saturn station and a lunar eclipse in the same week, it’s perhaps not surprising that the news is mostly bad. Despite the latest bailout package, a Greek default is looking more likely as the government struggles to stay in power amidst continual rioting in the streets. While the latest US job numbers were not completely bleak, there isn’t much for the market to cheer going forward. Hence we see much hand-wringing and gnashing of teeth about the lack of policy options for the Fed to fix the current economic situation. It’s very much a reflection of a powerful Saturn at the moment as the emphasis is on constraint, recession, pessimism and all those other stark Saturnian themes. Growth is increasingly seen as temporary or unsustainable as Jupiter has yet to exercise much influence on the market’s collective consciousness. This is perhaps fitting since it has yet to make its next significant aspects with Uranus and Pluto. Once it does, it should help to lift the mood a bit and wrestle control of the market away from Saturn’s bearish embrace. Indeed, we could be close to a significant low right here since Saturn is beginning to pick up velocity. As Saturn speeds up, it will gradually lose some of its strength. This will be one less burden on sentiment and will tend to boost prices — or at least reduce the downside risk. Just how long we could see a Jupiter-fueled bounce is less clear, however. Previously, I thought we could get a fairly sustained summer rally that would carry into August. Now I’m not so sure. While I don’t see the market completely unraveling here, it is possible that this rising Jupiter influence and declining Saturn influence could translate into a sideways market. Higher highs above 1370 are still possible, but they are looking less likely as more investors start to accept the fact that QE3 may not be forthcoming to save the day. It’s safe to say that there is a fair amount of skepticism about the economy’s ability to stand on its own feet in the midst of falling house prices, high unemployment, and an as-yet untamed government deficit.
 We didn’t quite get down to the much-advertised 1250 bottom but we came close — 1258 to be exact which was hit early on Thursday. Support kicked in from the March low at 1250 as buyers did not wait for the final digit to arrive. Thursday’s low exactly coincided with the 200 DMA so that is another fairly obvious source of support that adds to the likelihood that the market could be in for a bounce. Nonetheless, the rally looks a little shaky as Friday’s inverted hammer candle reflected the caution of investors taking long positions. If the bulls have successfully defended 1250 for now, they will still have to break above 1295-1300 to make any kind of convincing case. Even if the SPX can close above 1300, it will not change the more fundamental assumption that the market is in the hands of the bears. For a more sustained up move, bulls will have to work on violating the two head and shoulders patterns that are still in play. The shorter term H&S with the early April left shoulder (1339) features a sloping neckline that averages out to 1300-1305 although it is tilting upward to about 1320. A break above these levels would nullify it. The longer term H&S has now arguably been formed with last week’s low at 1258. This can be nullified only with a close above 1345.
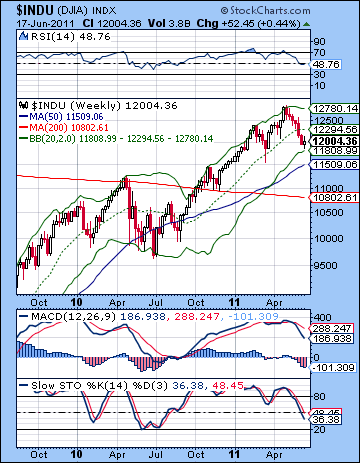
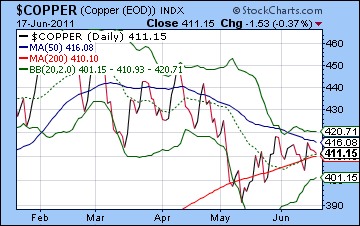
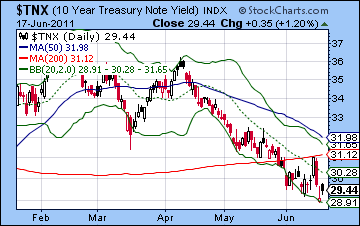
Bears are likely waiting for additional opportunities to short the market as key resistance levels such as 1295-1300 or 1320-1345. More enthusiastic bears may attempt to retest the March low further in the event of more bad news coming out of Europe over the weekend. It is important to note that while a close below 1250 would be bearish, it would still keep the same H&S in place only it would have a downward sloping neckline. The SPX has finally moved off the bottom Bollinger band and MACD looks to be moving higher. The same goes for the RSI (37) although it is important to note that lower lows in the coming days could still occur while the RSI is at or above the 30 line. We can see how the weekly Dow chart has now moved very close to the bottom Bollinger band (11,808). This is more evidence that we could be very near a low since we saw this line touched a few times during the correction in 2010. Copper continues to hang in there near its 200 DMA and its continuing strength should give bulls some reason for optimism. If industrial production was about to fall off a cliff, copper would be doing much worse than it has. But the next test for the bulls will be to see if it can break above its declining 50 DMA at 416. If copper is somewhat bullish, the bond story remains bearish for equities. We saw yields make fresh lows last week before recovering slightly on Friday. As long as 10-yr yields maintain their downward momentum and do not close above its 200 DMA at 3.1%, then it will be difficult for equities to make much headway. The renewed strength in the US Dollar is another impediment for stocks since a rising Dollar will tend to undermine the appeal of the risk trade.
 The stars this week look mixed although the early week looks more bearish. The focus will likely be on Tuesday’s Mercury-Saturn square aspect which often occurs around bad news and disappointment. In addition, there is a Mars-Neptune square aspect on that day that may provide more bearish fuel. The fact that these aspects occur early in the week increases the likelihood that the SPX could retest support at the 1250-1260 level. I would think this is the more probable outcome. It’s possible that it could move lower than 1250 although I would be surprised if it was much lower, such as to 1220. I would expect a turnaround to occur by Wednesday. That said, there may be a slightly higher probability (60/40?) of one down day rather than two. The second half of the week looks more bullish, so there is an increased likelihood of gains to occur between Wednesday and Friday. The Sun-Jupiter aspect is closest on Friday so that is perhaps the best bet for an up day. I would not be surprised if we got two positive days in the Wed-Fri window. A more difficult question concerns where the market will close on Friday. I don’t have a strong opinion either way on this as it seems possible that the early week declines may be offset by the late week gains. If support holds at 1250-1260 by Wednesday, then it seems more likely that we will close higher by Friday, perhaps around 1280. If there is a deeper pullback, however, then it could be a struggle to get back to 1271. My best guess would suggest a weekly finish that is flat to modestly higher.
 Next week (Jun 27-Jul 1) looks fairly bullish as a Mars-Jupiter-Uranus alignment should move markets higher. A Venus-Ketu conjunction on Tuesday may give added thrust to the move which may last into midweek. But we could see this little bull run peak there as Friday brings a solar eclipse. This will likely increase volatility, especially since the eclipse will occur in close aspect to bearish Saturn. This is a very bad pattern that may correspond to a significant decline. If the market has moved up to a major resistance level by Wednesday June 29 (e.g. 1300 and the 20 DMA), then we will likely see some selling at the end of the week ahead of the long weekend. The following week (Jul 5-8) is harder to read due to the very mixed aspects. The early week has a nice Mercury-Uranus aspect which could lift sentiment but Wednesday’s Mars-Saturn aspect could be more difficult. There still does not appear to be enough bearish potential there to extend any down trend. For this reason, I am expecting the market to gradually rise, albeit with a lot of choppiness. July is a potential time frame when the market could rise as Jupiter strengthens ahead of its retrograde station in August. If 1370 looks a little too optimistic, 1345 may be within reach. August looks more vulnerable to declines, however, as Mercury turns retrograde and Saturn comes under the influence of Ketu. September looks quite bearish so we may see some important new lows formed at that time. I am expecting the lows of the year to occur sometime in Q4, most likely in November and December.
5-day outlook — neutral-bullish SPX 1265-1285
30-day outlook — bullish SPX 1280-1340
90-day outlook — bearish SPX 1150-1250
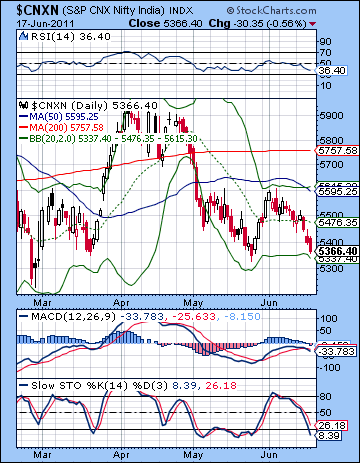 Stocks followed a familiar script last week as another RBI rate hike and ongoing Greek default worries weighed on sentiment. The BSE-Sensex declined more than 2% closing at 17,870 while the Nifty barely managed to hang onto a critical technical support level at 5366. This bearish outcome was largely in keeping with expectations as the double whammy of the lunar eclipse and the Saturn direct station overshadowed most other short term planetary aspects. I wondered if we might test 5350 around the eclipse on Wednesday or Thursday and we came close to that level but only on Friday’s close. More disappointing was the absence of any rebound at all late in the week as the Mercury-Jupiter aspect failed to correspond with any buying. The bearishness also manifested a little later than expected as the early week conjunctions of Mercury and Sun to Ketu did not generate any downside.
Sentiment remains pretty negative these days as there as domestic inflation concerns are forcing the RBI to assume a hawkish stance for the balance of 2012. The market has therefore priced in several more rate hikes as efforts continue to tame the inflation monster. Obviously, higher rates will make economic expansion more difficult and this will likely impact corporate bottom lines. All this talk about constraining and limiting inflationary growth is very much in keeping with Saturn, which continues to dominate the sky. Global cues have been equally negative as the chances for a Greek default increase alongside the growing possibility of a double dip recession in the US. But now that Saturn has finally ended its 4-month long retrograde cycle and is once again moving forward, we should reconsider the relative planetary energies that may be driving this market in the medium term. While Saturn has now turned direct, it is still moving very slowly. Since slow planets tend to be quite strong in their effects, Saturn is still a force to be reckoned with. Over time, it will likely diminish in strength, but it may be too soon to expect a significant reversal higher. That said, the reversal of its direction did occur last Monday during the same week as a lunar eclipse, so there is a certain astrological logic in thinking that we could be at or close to an interim low. The other side to the market equation, of course, is Jupiter. It appears to be gathering strength as it aspects Uranus and Pluto over the next three weeks. It is the ongoing interplay of bearish Saturn with bullish Jupiter that offers a unique window into the movement of the market. If the economist J.M. Keynes had studied astrology, he might have recognized that the market could be described by this eternal dance of Saturn and Jupiter just as much as by the "animal spirits".
 Bears gained the upper hand last week as the potentially bullish inverted head and shoulders pattern was violated when the Nifty fell below 5450. As gloomy as this development may be, all is not lost for the bulls. If the Nifty can hold above the previous low of 5328, then it would form a double bottom pattern which may generate a rebound rally. Also, the Nifty is now close to its bottom Bollinger band on the daily chart so that offers some evidence that we may be nearer to the low in this current down move. Stochastics (8) are again oversold and this is another factor which would argue for a near-term bottom. RSI (36) is falling and is once again moving towards the 30 line where short positions hold less appeal. MACD is, however, rolling over again here and has begun a fresh bearish crossover.
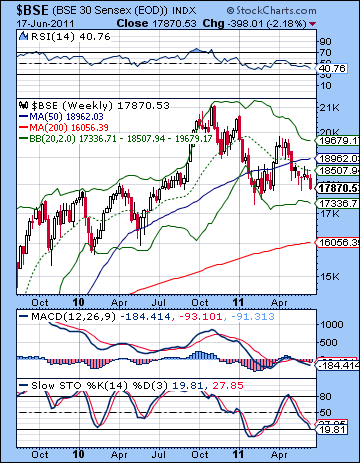
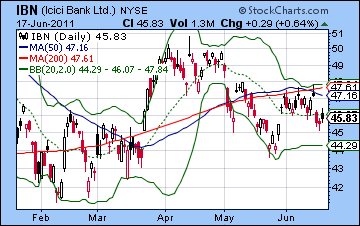
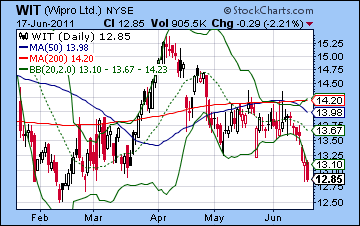
Perhaps most important is the fact that the Nifty is clinging to the rising trend line that connects the 2011 lows. We can see a series of progressively higher lows here and as long as the current level holds fast, this default bullish pattern can be maintained. But a close below this line (at 5350 or below) would likely encourage more selling, which would increase the odds of a retest of the February low of 5177. Resistance is still around the 50 DMA at 5595 as the market just cannot gain much traction in the current environment of inflation and rising interest rates. Since the April high, rallies have been sold quite early as investors with long positions do not want to get trapped. The weekly BSE chart offers a more mixed picture as price has moved towards the bottom Bollinger band at 17,336. This band has provided support in past corrections, although it is quite a loose form of support. As Stochastics (19) are now below the 20 line, there is further evidence that this downward move may be close to exhaustion. Bellwether ICICI Bank (IBN) is mirroring the indices fairly closely here as it failed again to break above the 50 and 200 DMA. Tuesday’s action saw intraday price rise above both of those resistance levels, but it could not hold onto gains by the close. It still has some breathing room above its May low and also shows a series of higher lows since February. But the highs have also been lower and have created a rough triangle pattern. Until this is broken up or down, price may continue to move sideways. Wipro (WIT) had a tough week and threatened to retest its February low. It has been falling since retesting resistance at the 50 and 200 DMA. Bulls will likely try to defend the February low which is just 3% below current levels. A pullback to that low will likely bring in new buyers and could be a good long opportunity.
 This week looks mixed although the early week seems to tilt bearish. The main culprit in this regard is the Mercury-Saturn aspect that makes its closest angle on Tuesday. Mars will square Neptune on Tuesday so that is another potentially difficult energy that could correlate with declines. While both of these influences will tend to depress sentiment in the first half of the week, it is still possible that Monday could be higher, especially in afternoon trading. However, the possibility of a gain Monday is less likely than the probability of a decline on Tuesday and perhaps Wednesday. This may also manifest in terms of relative size of the moves. The downside is likely to be larger than the upside during the first half of the week. Given the current technical situation, that may mean that the Nifty could break below that rising trend line and test the previous low of 5328. I don’t think there is enough negativity for a sudden move back to 5200, however. Once Mercury begins to move away from Saturn’s influence on Wednesday, there is a better chance for gains. Thursday looks like a good candidate for an up day given the Moon-Jupiter aspect and the Sun’s approach to Jupiter. Friday also may be bullish although the Moon-Saturn aspect in the morning may cause some worries near the open. If we get only a modest decline into Wednesday to 5300-5330, then we could regain current levels by Friday’s close. This is perhaps the most likely scenario. But the early week planets have the potential for a more significant decline that we should watch carefully. This isn’t exactly probable, but it is nonetheless there. Of course, if Monday turns out to be higher, then the midweek damage may not threaten support levels and we could actually finish higher overall.
 Next week (Jun 27-Jul 1) looks fairly bullish to start as Mars is in aspect with Jupiter and Uranus. Tuesday’s Venus-Ketu conjunction could be similarly positive for the market so this should introduce a bullish bias for the first half of the week. Given the Jupiter-Uranus conjunction in play here, we could see significant upside. However, the bullish momentum may end on Thursday’s Moon-Venus conjunction that occurs in the morning. This could well be the high point for the week ahead of Friday’s solar eclipse. What makes this solar eclipse particularly tricky is that it occurs in an exact square aspect with Saturn. This increases the odds for a significant decline at the end of the week. The following week looks bullish, at least the outset. Thursday’s Mars-Saturn aspect could be bearish enough to erase previous gains. July may have a bullish bias, although it is unclear just how high the market could go. I tend to think gains will be fairly modest but the Nifty still has a good chance of testing resistance from the falling trend line from the 2010 high, which should be around 5700 by late July. Even if it should go above this level, I think August will be much more bearish and will likely mark a new corrective phase. September should continue this down move on the Saturn-Ketu aspect. There is sufficient negative energy in this Aug-Sep period to form new lows below 5200. After a relief rally in October or November, there is a good chance for lower lows in December and January. 4800 seems probable by this point and I would not rule out 4000 on the Nifty.
5-day outlook — neutral-bullish NIFTY 5350-5450
30-day outlook — bullish NIFTY 5500-5700
90-day outlook — bearish NIFTY 4800-5000
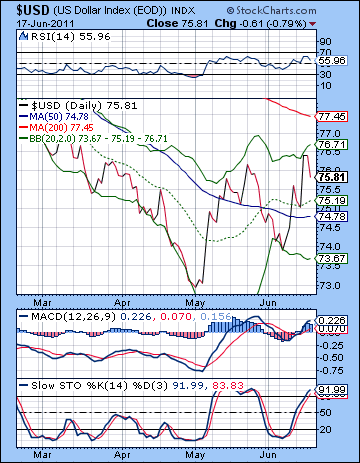 The Euro continued to weaken on fears of a Greek default, although Friday’s bailout package prevented further carnage. The Euro ended slightly lower at 1.43 while the Dollar made modest gains closing at 75.81 and the Rupee finished slightly weaker at 44.86. As expected, the Euro did move sharply lower on Wednesday’s lunar eclipse and we briefly saw trades below 1.41/76.5. Friday’s gains were also in keeping with expectations as the Mercury-Jupiter aspect activated a positive alignment in the Euro horoscope. Even if this latest bailout package can delay Greece’s default, there is a growing consensus around its inevitability. It’s just a matter of when. While the Euro did not make a lower low last week, the Dollar index did make a higher high, This is a very bullish pattern since we have higher highs and higher lows as it moves to reclaim the 200 DMA at 77.45 It will likely encounter significant resistance there but it seems likely to test that level quite soon. MACD has crossed over the zero line and is once again in a bullish crossover. RSI (55) is moving higher and still has lots of room to go before it becomes overbought. Stochastics (91) are already overbought, however, so it is possible we could see a short period of consolidation before moving higher. Thursday’s gain topped out around the upper Bollinger band as the Dollar once again vaulted over the 20 and 50 DMA. The 50 DMA now appears to be flat as its long decline has come to an end. An upward sloping moving average is the good sign of a bull market, and the longer the moving average, the better. Even if the 200 DMA has a long way to reverse its slope, an upward-sloping 50 DMA would be a significant achievement for the Dollar.
This week looks like more upside for the Dollar in the early going as the Mercury-Saturn aspect on Tuesday will line up against the Euro’s natal Sun. I would not be surprised to see the 200 DMA tested above 77.45 at that time, although that may be pushing it. This would correspond to the 1.40 level on the Euro. A Dollar decline is more likely to take hold after Tuesday with the best chance for losses occurring on Thursday and Friday. Next week (jun 27 – Jul 1) is harder to call, although I would lean bearish on the Dollar. If it does retrace lower in the early part of the week, it should make a sizable gain at the end of the week near the solar eclipse of Friday, July 1. July could see a period of consolidation for the Dollar, although I admit I’m not sure about that. There are conflicting indications for July although I think the bullish ones may tip the balance somewhat. The second half of July does look more bullish, however, so perhaps we will see the Dollar rally again going into early August. After a correction in August, more upside looks likely in September and the move could be quite sharp indeed. September is therefore a time when I am expecting the Dollar Index to hit 80 if it hasn’t already done so. This would correspond to 1.30 for the Euro. The Dollar should continue its rally into Q1 2012 at least.
Dollar
5-day outlook — neutral
30-day outlook — bearish-neutral
90-day outlook — bullish
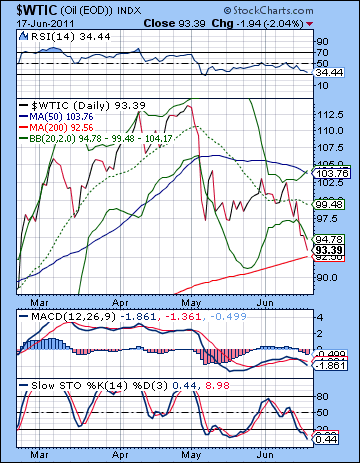 As supply forecasts rose, crude plunged back down to earth closing below $94. After a weak rally attempt to recapture $100, crude collapsed with the onset of Wednesday’s lunar eclipse and continued to decline into Friday. While I had been bearish last week, I did not fully expect crude to fall this far so quickly. However, the eclipse provided the necessary energy to break that critical support level at $95 as it traded as low as $92. The bulls have been defeated here as that rising trend line was broken, just as the horizontal support at $97 was broken. The $95-97 level will likely set up as resistance now as bears will try to push price down towards the next support level at $86. Before they do that, however, there is likely considerable support at $92 which was the upper range for crude in late 2010 and early 2011 before the Middle East exploded in civil unrest and revolution. $92 may also be difficult for the bears to crack since the indicators are close to being oversold on the daily chart. RSI (34) is close to the 30 line and may form a bullish double bottom pattern in the coming days. Stochastics (8) are hugely oversold here although this is perhaps less telling. Not surprisingly, MACD is again in a bearish crossover and headed lower while below the zero line. Crude may find additional support at $92 because the 200 DMA is currently at $92.56. If $92 brings in new long positions, then a break down below $92 would likely trip many stop losses and we could see crude fall back to that $86 level in short order. And it’s worth remembering that the downside target for the still-valid head and shoulders pattern is $81.
This week should begin fairly negatively as the Mercury-Saturn square is likely to correspond with falling demand and lower prices. It seems likely that we will test support at $92 by Tuesday and I would definitely not rule out lower prices than that. We should reverse higher by Thursday and the end of the week offers some promise of a rebound. It is unclear if crude can finish at current levels, although I would lean towards a neutral to bullish outcome. Next week (Jun 27 – Jul 1) looks more bullish so any rally we see started here will likely extend into a second week. However, the good mood may only last until midweek as the sentiment should worsen around Friday’s solar eclipse. This may mean a rally back to resistance at $95-97 by Wednesday, followed by another decline to $90-92 or perhaps lower. Crude should see another rally in the first half of July so we could see sideways movement with occasional spikes higher. The second half of July looks more bearish, especially around the Mars-Ketu conjunction on July 22. Mid-August looks fairly bullish so we could see a final rally attempt there which will be followed by a large sell-off on the Saturn-Ketu aspect in early September. If crude peaks around $100 in July and August, September could see support at $80 tested. Q4 looks quite bearish so the lows of the year are most likely to occur then. I would not be surprised to see $60 by December although that is very much a guess.
5-day outlook — neutral-bullish
30-day outlook — bullish
90-day outlook — bearish
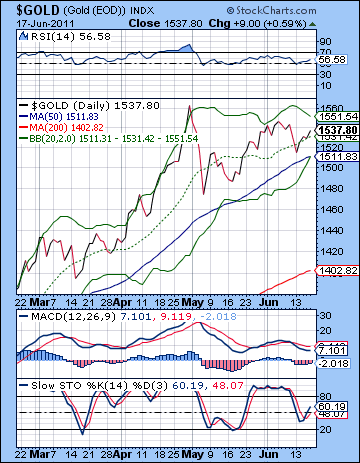 As the Eurozone continued to struggle with the Greece situation, gold bucked the bearish trend last week and eked out a small gain closing at $1537 on the continuous contract. As expected, gold declined around the midweek lunar eclipse and we did break the rising trend line off the January low as it traded below $1520. The late week rebound also arrived on schedule as the Mercury-Jupiter aspect brought gold back above $1530 in a back testing of the trend line. While the broken trend line was an important technical development, the fundamental pattern has not really changed as the longer term trend line at $1450 is very much intact. We can also see a series of higher lows here which is generally bullish. What is uncertain is whether gold will form higher highs. If gold can close above the previous high at $1546 then it will give bulls control again as they will make a run to the all-time high at $1563. Gold is still very much in a bull market as the rising 50 and 200 DMA reflect. We’ve had several tests of support near the 50 DMA on the way up and it is likely to be tested again in the near term. Last week’s test was a successful defense by the bulls but we will see how much follow through they can generate. With the 50 DMA now standing at $1511, a close below this line might shake out some weaker bulls. The daily momentum indicators and Stochastics oscillator do not offer any clearly confirmatory evidence for either bulls or bears at this point.
This week may begin somewhat negatively for gold as the Mercury-Saturn aspect could boost the Dollar. It is quite possible we could test the 50 DMA here and challenge last week’s low. I don’t quite expect any huge drop here, however. The late week looks more bullish for gold as the Sun moves into aspect with Uranus and Jupiter. Both Thursday and Friday have a decent chance for gains so that could easily return gold to current levels. Next week (Jun 27 – Jul 1) should tilt bullish, at least at the start. Friday’s solar eclipse may be quite bearish, however, as Saturn will line up exactly square to the Sun. This has the potential of a major decline at least as large as what we saw last week on the lunar eclipse. This may not be enough to break the long-term upward tend as gold should generally be fairly firm in the first half of July. Whether or not it can make new highs is somewhat uncertain although I think it won’t. It’s more likely to be range bound between $1480 and $1550. More bearishness should return by the second half of July and that is the time when we could see a more serious test of the long term trend line at $1450-1480. Gold will likely break below this trend line by September when a major correction will take place. A 10-20% is possible in a fairly short time span during the Saturn-Ketu aspect. Gold will likely stage a full scale retreat in Q4 as the US Dollar strengthens. This bear market in gold may become more firmly established in 2012.
5-day outlook — neutral
30-day outlook — neutral-bullish
90-day outlook — bearish

