- More stock gains likely into midweek but rally is unlikely to continue
- Dollar will fall significantly into midweek; medium term bullish trend still in place
- Gold likely making new highs this week
- Crude pushing to $80 this week before correction ensues
- More stock gains likely into midweek but rally is unlikely to continue
- Dollar will fall significantly into midweek; medium term bullish trend still in place
- Gold likely making new highs this week
- Crude pushing to $80 this week before correction ensues
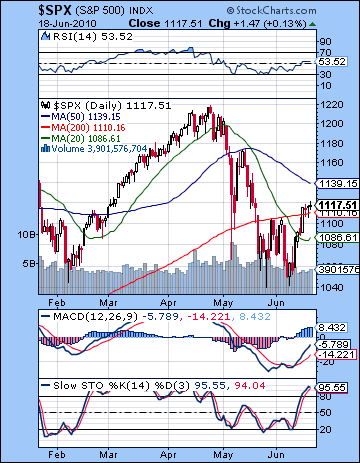 Stocks rallied for the second week in a row as the European soap opera became less riveting somehow, despite new rumours that Spain may be on the verge of accepting bailout money. The Dow closed higher by more than 2% at 10,450 while the S&P finished at 1117. While I had expected a run to 1110 here, I thought it would be confined to the early week and the Venus-Jupiter-Uranus alignment. Certainly, we did see a big gain on Tuesday just as the aspect became exact and that vaulted the key indexes over their 200 DMA, a key resistance level. Significantly, the gains held by the close and bulls had the market to themselves after that, as the successful breaching of 1107 allowed prices to drift higher for the rest of week. I had expected more selling as we drew nearer to Friday’s Sun-Saturn, but in retrospect that merely signaled the end to the upward move for the week. Wednesday to Friday were mostly flat with a mild bullish bias as the S&P traded between 1106 and 1121 — now fervently claimed as bullish territory. This bullish result was a little disappointing, if only because I was hoping that the effects of the Jupiter-Uranus conjunction would start to fade fairly soon after their exact conjunction. Not so fast. The inability of the late week Sun-Saturn to promote any selling was a clue that we may have a few more days of Jupiterian enthusiasm for stocks, especially since we will have that Sun aspect coming up this week. Overall, however, the durability of the rally does not radically change the road ahead. Jupiter gets a little weaker with each passing day and Saturn that much stronger as they gradually switch places as Uranus’ dance partner over the next month. Uranus begins its retrograde cycle on July 5 so that date may figure prominently in forming the interim bottom. At that time, Uranus will be equidistant from the influence of bullish Jupiter and bearish Saturn. It is worth nothing also that the Uranus station occurs just a day after the birthday of the US and this may foreshadow a year that is very Uranian in nature, i.e. marked by sudden and unforeseen events with an increase in turmoil and change. Then we get the next installment in the Saturn-Uranus opposition on July 26. As we know, this is the aspect that arguably started this whole correction with its last aspect on April 26 when the market had reached its high of 1219 on the S&P. And as if that wasn’t enough, we have Pluto, the planet of transformation and ruthlessness (not necessarily in that order), squaring Saturn during the month of August. It’s a stunning line-up of planets that are likely to shake up the status quo in a profound and at times shocking way.
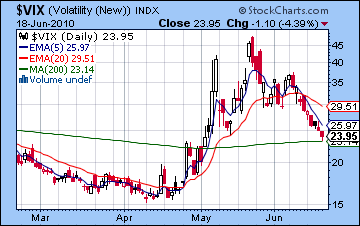
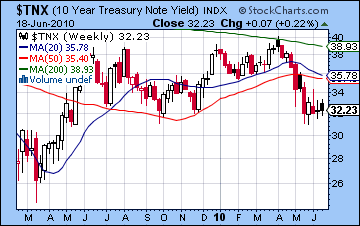
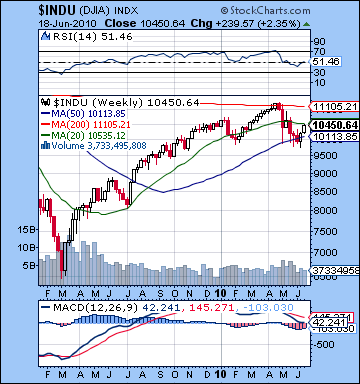 The technicals definitely turned in favour of the bulls last week as resistance of the 200 DMA was breached and it held through Friday. This was important confirmation of the rally off the double bottom from May 25 and June 8 and the start of a legitimate rising trend. The falling wedge is now a thing of the past as prices have moved higher and now that they exceed the 200 DMA, bulls have their eyes on the next levels of resistance. The 50 DMA at 1139 is the next important level. This moving average brought in a lot of sellers back on May 12 after the Euro bailout was announced as prices made it as high as 1170. It may well do the same thing in the coming days as the bulls take a run at it. Of course, we are dangerously close to forming a head and shoulders pattern that dates back to the January highs of 1150. This is a bearish pattern and it will likely presage the market taking its next move lower. It is important to realize that it needn’t climb all the way back to 1150 (10,700 on the Dow) in order for the pattern to be "real." Given the slightly lower lows in the current correction compared with early February, we may see lower highs on the right shoulder also. You can see this pattern on the daily RSI and MACD in the SPX chart as the May lows are lower than the February lows. Volume continues to be unimpressive here, so that is another clue that the rally may be a mile wide and an inch deep. Slow stochastics (95) are back again over the 80 line, suggesting that the current bounce could conceivably end at any time. The $VIX has tumbled all the way back to its 200 DMA here and it clearly shows a bullish crossover of the 5 and 20 day exponential moving averages. We may see this support level tested this week on any further up days for the stocks. While it may briefly move below this level, the near term prospect of the head and shoulders pattern suggests that it will make another spike higher. The yield on the 10-year treasury fell last week, a potential divergent indicator given the stock rally. This suggests that despite the rise in equities, there is also some money that continues to seek safety in the bond market. Yields are very close to recent support levels of 3.1% and we can see how they have fallen below key moving averages, suggesting a possible further move lower. For the short term, a further correction in stocks will likely occur alongside lower US government bond yields. While that relationship may be called into question eventually as the US deficit gets out of control, it seems more likely that treasuries will continue to act as a safe haven when stocks selloff. To conclude, the technical picture offers a painfully obvious bearish head and shoulders pattern. Everyone and their grandmother is expecting it so one wonders if it will somehow not come to fruition. Very often when something is widely expected, it never happens. Or maybe it won’t quite make it all the way back to 1150. I suspect we will see a round of selling very soon when the right shoulder is considered "completed" around SPX 1125-1150. (Actually, it could be said to be already completed at current levels.) Perhaps the larger question is what happens after that. One rough estimate of the size of any down move is to take the distance from the head (1219) to the neckline (1040) and project that underneath the neckline. This equates with a low of 860 (Dow 8300), which is roughly within the of our target for September. If 1040 is violated in the next down leg, then that level would become important resistance in the event of any rallies in July which would retest the neckline (1040).
 This week offers up a rough analogue to last week with possible early week gains coming from the activation of the Jupiter-Uranus conjunction. While Venus played that role last week, the Sun takes its turn here. On Monday, the Sun will form a square aspect with Uranus (6 Pisces) and then on Tuesday it will aspect Jupiter (7 Pisces). This should provide some more upward momentum for stocks, although we should note that Jupiter and Uranus are not as close as they were last week, so the gains may not be as strong nor as reliable. Of the two days, Tuesday looks better than Monday. Wednesday also holds the possibility for gains as the Sun-Jupiter aspect is still quite close although past exact. So the first three trading days of the week look net positive although I would doubt we will see gains on each day. The end of the week looks more decidedly bearish as Mercury is in aspect with Saturn on Thursday (and this may be felt as soon as Wednesday afternoon) while the Sun opposes Pluto on Friday. These look net negative with Thursday looking worse than Friday. Overall, I think there is a good chance we close above support at 1110 and the 200 DMA. But much depends on what kind of lift we get from the early Sun aspects to Uranus and Jupiter. In the event that Monday is negative, we may only be able to climb up to 1130 by Wednesday and then it might be very challenging for the bulls to keep prices above 1110 by Friday. Of course a Friday close below 1110 would be very bearish indeed as it would suggest that the bulls fumbled the ball in this rally and that we are heading lower. I certainly hope that is the case since I am forecasting a more clearly negative week next week, but the presence of some good aspects this week is tempering my downside expectations.
 Next week (June 28-July 2) looks like crunch time. We will see a close Mars-Rahu aspect on Monday, just at the same time we will get a Sun-Mercury conjunction. This is likely to spark a major move. It is conceivable that we could move higher for one day, but I would still tend to think we’re headed lower on this combination. The difficulty is that Sun-Mercury conjunctions can be positive although the Mars-Rahu is usually quite negative. By midweek Mercury conjoins Ketu and sets up with the Mars to produce a very foul trinity. Friday also looks pretty nasty as the Sun is in a one degree conjunction with Ketu. This looks like the start of a pullback. The following week (July 5-9) will be shortened for the holiday (Monday closing) but we may well see more downside as both Mercury and Venus are in aspect to Saturn late in the week. We should see a bounce after that until perhaps July 23 and the Sun-Jupiter aspect. In terms of levels, I am uncertain if there is enough bearishness to take down stocks below 1040 in early July. If we see the S&P climb to 1150 this week, then it may somewhat less likely for more than 10% to be taken off stocks in a two week period. An lower right shoulder high around 1130 or 1140 would provide more downside momentum that could be enough to break below 1040 by July 9. If we do break below, we could get to 975 in a hurry. Then the July rally would take us back to 1040 by around the 23rd, and then the next round of selling would begin. Alternatively, a late June selloff may only see us re-test 1040 again and then stocks would try to mount another rally. This would produce more range-bound trading in July between 1040 and 1150, perhaps in a pennant formation which would feature a narrowing price range of higher lows and lower highs. This narrowing price pattern would then be resolved in late July with a breakdown which would take prices lower into the fall. This is a somewhat less bearish scenario, although prices may wind up in a similar place — around 800-920 in September or October. I think the first more bearish scenario is somewhat more likely but perhaps not by much.
5-day outlook — bearish-neutral SPX 1100-1130
30-day outlook — bearish SPX 1000-1080
90-day outlook — bearish SPX 850-950
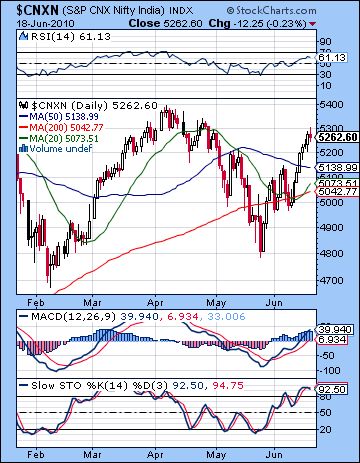 Stocks in Mumbai continued their rebound last week as Euro worries retreated to the background and more favourable domestic data took centre stage. The Sensex rallied almost 3% before closing at 17,570 while the Nifty ended the week at 5262. This bullish outcome was disappointing since I had expected more weakness later in the week. While I did correctly forecast early week gains on the Venus-Jupiter-Uranus alignment, the negativity from the Sun’s entry into Gemini did not come to fruition. Monday’s gain was the biggest of the week and that arrived more or less on schedule as Venus was moving into position with Uranus. Tuesday was also slightly higher, as was Wednesday. These three days were broadly in keeping with expectations of the bullish energy. The real anomaly was Thursday which saw a 1% gain instead of a loss. I had expected more uncertainty from the Mercury-Ketu aspect but that seems to have been offset by the continued strength of the Jupiter-Uranus conjunction. And while I was correct in anticipating Friday as worse than Thursday, we only got a very modest decline on Friday as the Sun approached Saturn. The rally has therefore gone a little further than expected here although we are still generally adhering to the my broader expectations. Due to the presence of a number of stressful medium term aspects, this rally does not appear to have sufficient planetary strength to form new highs. It is true that the bulls can draw strength from the Jupiter-Uranus but as Jupiter gradually begins to move out of range, Uranus will lose its benefactor. Moreover, Saturn will soon come into the picture as it moves into position for its next portentous opposition aspect with Uranus on 26 July. Between now and then, we should expect the tug of war between bulls and bears as both will attempt to win over the majority of traders. Indian markets are faring somewhat better than most other global markets here but they will not escape the full weight of the late July and August aspects that are lining up against it. This is very likely to initiate another major down. Now the question is: from what levels will this next leg down commence? Up to this point, I had expected the completion of a shoulders pattern in late June around the 5250-5300 level and then a move down to 4800 by early July followed by another rally attempt in July that culminated perhaps around 5000. I still adhere to the basic contour of this pattern but last week’s action suggests more upside is likely. We may still complete the head and shoulders pattern over the next week or two, but the upper range may be 5400. Then the move lower into early July would similarly be at a higher level, perhaps 4800-5000 with a subsequent failing rally attempt culminating around 5200.
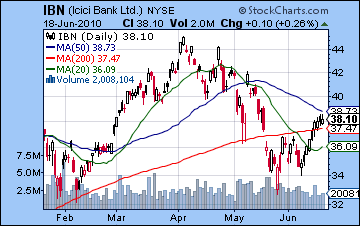
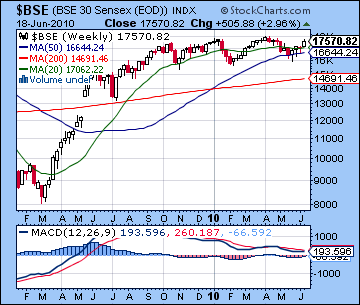 The technical situation of the market improved significantly last week as prices closed above both 50 and 200 DMA. The 20 DMA is now rising and with the recent rally, we are unlikely to see a "death cross" of the 50 and 200 DMA in the near future. Bulls have also managed to climb over the falling trendline off the April highs. They will have to prevent prices from falling below this line (currently at 5150) in order to keep their current rally intact. We should also point out that this roughly coincides with the rising trendline off the late May bottom and the 50 DMA at 5139. Therefore we should regard the 5100-5150 level as a crucial level of support of this rebound rally. If the market falls below this level, it may quickly revisit 5000 and then 4800. We can also discern a bullish inverse head and shoulders pattern with the left shoulder forming 9 May, the head on 25 May and the right shoulder 7 June. This is a bullish pattern that reflects growing bullishness in the market that will likely propel it higher. Just how high remains to be seen, due to the significant overheard resistance around 5300. In a sense, we are shaping up for a battle between the longer term bearish H&S pattern from January and this more recent IH&S. I think the longer term H&S will eventually carry the day, but it nonetheless increases the odds of a somewhat higher right shoulder, say in the 5300-5400 range. Daily MACD is also looking bullish as is RSI at 61. Slow stochastics have moved into the overbought area (92) and may be preparing for some consolidation. On the bearish side, volume remains a problem for this rally. Monday’s 2% gain came on only 17k shares traded and while volume picked up to 27k on Wednesday, that was a largely flat outcome. Thursday’s gain came on 25k which was better. Overall, it doesn’t appear to have the volume necessary to take prices to new highs. MACD on the weekly Sensex chart is still in a bearish crossover, although the gap is narrowing. More bearishly, however, is the negative divergence evident in the recent lower lows and lower highs compared with February. This suggests prices will be moving significantly lower in the medium term. Financials are perhaps under performing in the rebound, as the ICICI chart shows. It closed below its 50 DMA on Friday and has a long way to go yet to reach its previous high. Volume has also been light on this bounce which suggests that it may not be reliable in the medium term. The overall technical picture offers more comfort to the bulls but sellers may have a greater say in the market as we get closer to 5300 and 5350.
This week is likely to be bullish in the early week period as the Sun forms an aspect with Jupiter and Uranus. Actually, it forms an aspect with Uranus (6 Pisces) on Monday and then on Tuesday it will aspect Jupiter (7 Pisces). Monday looks less solidly bullish and may actually produce a negative day. Tuesday looks to be the better of the two as the Sun aspects Jupiter more closely. On Wednesday, the Sun-Jupiter aspect becomes exact so another up day is quite possible here also. Those first three days therefore will likely be net positive and so we could see the Nifty trade over 5300 at that time. The end of the week inclines towards the bears, however, as Mercury falls under the aspect of Saturn on Thursday. Friday also is likely to be bearish as the Sun opposes Pluto. Overall, there is a chance we will be negative for the week, but with that Jupiter energy likely prevailing into midweek and the strength of the recent rally I would be reluctant to bet against a close Friday at or above current levels. Nonetheless, there is a good chance that the high water mark for this rally may well occur this week.
 Next week (June 28-July 2) looks more thoroughly bearish as we begin with a Sun-Mercury conjunction in Gemini and a Mars-Rahu aspect. While the Sun-Mercury conjunction can produce gains due to increased interest in trading activity, the presence of Mars-Rahu suggests that volume will rise due to fear rather than enthusiasm for equities. On Wednesday, Mercury conjoins Ketu which will likely create more uncertainty that will be bad for stocks. Friday sees the Sun take its turn to conjoin unpredictable Ketu, although we should note that it will make its exact aspect until Saturday. Even worse perhaps is that Jupiter, Saturn and Uranus will form an unusual midpoint pattern where the midpoint of Jupiter (8 Pisces) and Saturn (4 Virgo) will be in exact aspect to Uranus (6 Pisces). This is another potentially difficult energy since Saturn’s pessimism will be affecting two other key sources of bullishness. The following week (July 5-9) will begin bearishly as Mars lines up in aspect with Ketu in the NSE chart. Some recovery is possible midweek but the end of the week looks bearish again as both Mercury and Venus will move into aspect with Saturn. This may well be the week that we see an interim bottom formed as Uranus turns retrograde on 6 July. After that, another rally may be attempted which is unlikely to last much beyond July 23. It does not look like a forceful rally in any event and may be quite choppy. The situation looks increasingly precarious after 26 July as Mars enters Virgo and approaches its conjunction with Saturn. August and much of September will likely see the market move down significantly, perhaps to Nifty 4000. Whether or not it gets there will depend on what kind of pullback we have in early July. If we can fall below 4800 in early July, then the chances are good of reaching 4000 by September. The Q4 period looks fairly bearish with lower lows likely by December.
5-day outlook — neutral-bullish NIFTY 5200-5300
30-day outlook — bearish-neutral NIFTY 5000-5200
90-day outlook — bearish NIFTY 4000-4500
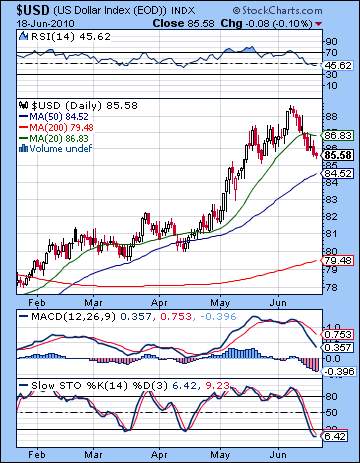 As Eurozone fears retreated last week, the US Dollar surrendered a good portion of its recent gains closing under 86. While I expected some pullback early on the Venus aspect, I did not expect the decline to be this severe. I underestimated the effect of the aspect of Saturn (4 Virgo) on the natal Sun (4 Scorpio) in the natal chart. This is a bearish influence to be sure and will likely continue to dog the Dollar for another week or so before moving on. As pullbacks go, it wasn’t anything particularly shocking or sudden as the decline was fairly orderly. The 20 DMA was broken early on, and now we appear to be headed for a rendezvous with the 50 DMA below 85. This is a more reasonable downside target than, say, the rising trendline off the December lows which now currently stands at 83. So more downside is likely but perhaps not that much. Daily MACD is still deep in a bearish crossover and from the look of things, may be setting up some negative divergences once it finds its footing again. This perhaps foreshadowing for the eventual collapse of the Dollar that I am expecting in Q4. RSI (45) is also slipping into bearish territory and is in the verge of becoming negatively divergent with price. For the bulls, slow stochastics (6) have at least moved into oversold territory so this may precede another move higher in the near term. One other important factor for the Dollar bulls is that volume is fairly weak on this pullback at least as seen in the UUP ETF. It is much lower than the volume we saw on the way up and hence it is an indication that most traders are maintaining their long positions in expectations for higher prices in the future.
This week looks fairly bleak at least in the early going on the Sun-Jupiter-Uranus alignment. Look for the Dollar to fall to the 50 DMA by Wednesday. Not only do we have slow moving Saturn still in aspect to the natal Sun, but transiting Mars is in aspect with the natal Rahu. This has all the makings of spike-type move, perhaps one cent in a day or more. We could see recovery begin as early as Wednesday or as late as Thursday as Mercury enters Gemini and Venus aspects the Moon-Jupiter in the natal chart. Friday could go either way, but a decline may be more likely. Therefore, the week looks negative overall. Next week looks better with gains more sustainable as the Sun-Mercury encounter with Ketu is likely to highlight the Dollar’s safe haven status again. This is likely to continue until the week of July 5-9 where another interim high is possible. Given the extent of this pullback, the next run up may only be in the neighborhood of the previous high of 88. I had been fairly optimistic in previous newsletters about how high we might get here, but since we’re likely headed back to 85 or below, another rally is unlikely to produce USDX 90 just now. That will likely have to wait until September when we get a parabolic spike amidst panic and a possible stock crash.
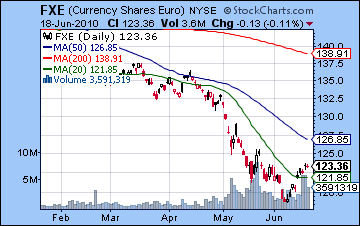 As bond yields normalized somewhat, the Euro emerged from the ashes and closed at 1.238. No doubt the Venus-Jupiter aspect delivered some early week gains but there was very little giveback later on as buyers continued to nibble while sellers largely stayed on the sidelines. In a sense, the bounce was quite foreseeable as the Euro had become too oversold. Slow stochastics had been hovering near the 20 line since the end of April — no less than 7 straight weeks! With last week’s pop, the Euro is now showing signs of being overbought as the stochastic indicator stands at 89. We could see more upside until the next main resistance level of 1.26 and the 50 DMA. That would still maintain the overall negative outlook on the Euro but allow for more of a technical bounce here. Since it has been rising ever since its June 7 low, the first line of support is likely the rising trendline now around 1.23. While the technical outlook is generally bullish in the short term, a quick look at the volume ought to make bulls a little cautious. Volume has been quite low on this bounce and what is more important, it has been lower than it was on the previous bounce around May 20. Prices are rising, but volume is not following. The Euro is looking good this week as the Sun is high in the natal chart in the 10th house. Wednesday and Thursday may be net negative, however, as Mercury aligns with Saturn. Another move down to retest its recent lows is likely after that as Saturn conjoins the natal ascendant. The Saturn contact runs through most of July so that is likely to put a ceiling on any rallies we may see. That said, I do not have a strong sense that we will break below the lows of 1.19 in the near term. It’s possible of course, but new lows may have to wait until September. Meanwhile, the Rupee found its footing and closed higher near 46 last week. The rebound is likely to continue this week with 45.5 very possible.
Dollar
5-day outlook — bearish
30-day outlook — bullish
90-day outlook — bullish
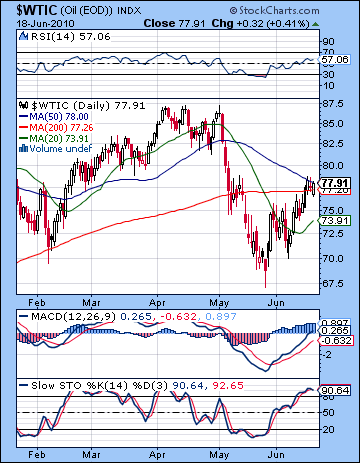 Crude continued its recent surge last week closing near $78. While I had expected gains near this level (and its 200 DMA), I thought they would be confined more to the beginning of the week and the Venus-Jupiter influence. My hopes for some kind of pullback on the Sun-Saturn aspect went down the drain on Friday as oil racked up another gain. Admittedly, the aspect was not yet exact, but I would have expected it to have commanded more of a presence against the fading influence on Jupiter. No such luck. In any event, the technicals continue to improve as this close above the 200 DMA will give bulls some hope of higher prices in the future. Friday’s close was just below the 50 DMA so that will be the next level of resistance. We can see a rough looking head and shoulders pattern forming here with April’s elongated head after January’s left shoulder. This does not mean we can assume a near term price target of 84, however. The neckline is sloping down since the February low was $70 and the May low was lower — $68. We might reasonably expect the right shoulder to also be lower, perhaps in the $82 area. Volume is still a concern in the recent rally as it has consistently been lower than during May’s correction, at least in the USO ETF. Daily MACD shows a glaring negative divergence between the February and May lows which suggests lower prices in the medium term. Even if we see higher prices this week, there will likely be a death cross of the 50 and 200 DMA — a very inauspicious pattern that also points to lower prices down the road. Support is currently found in the rising trendline off the May low and now stands around $74. Next week this steeply rising line will intersect with the 200 DMA near $76 and may be the final stop on the way down.
This week looks fairly bullish for crude as the Sun aspects to Uranus and Jupiter are likely to increase speculative activity. Monday will see the Sun approach a square aspect with Uranus which should be helpful for bulls. Mercury will also be getting close to the natal ascendant in the Futures chart so that is an additional positive factor. Tuesday looks more reliably positive, however, as the Sun will apply to an aspect with Jupiter, Mercury will be exactly on the ascendant, and transiting Venus will form a nice aspect with the natal Sun. So I would look for a significant gain on Tuesday, regardless of what happens Monday. Wednesday also could be an up day, although this seems somewhat less reliable than Tuesday. Thursday looks more bearish on the Mercury-Saturn aspect and Friday may also be susceptible to declines. So there is a good chance we will see $80 this week, perhaps $82. An overall gain is likely even if we see some late week selling. The following two weeks look more bearish so we will likely trade below the 200 DMA by early July and indeed the recent lows may be retested. After making a low in early July, we should see strength return on the Jupiter aspect to the Moon-Saturn conjunction. While this is only a partial aspect, it is very close to exact so it should offset most other negative things in the chart for two to three weeks. We should expect lower highs, however, as the bearish pattern begins to assert itself.
5-day outlook — bearish
30-day outlook — bearish-neutral
90-day outlook — bearish
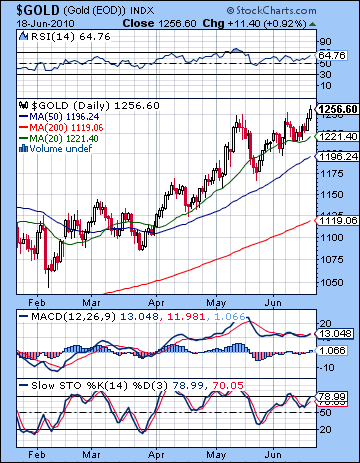 Defying the nay-sayers (including me) for yet another week, gold extended its rally last and made new all-time highs last week closing near $1256. This laid waste to my bearish call last week which had assumed more downside from the Sun’s entry into Gemini. So far, this new sign placement (which lasts until July 15) has not seen any diminution of the yellow metal’s appeal. It seems as though the Jupiter-Uranus conjunction continues to fuel the enthusiasm for gold. Certainly I would acknowledge that the GLD ETF chart is still in fairly good shape. Nonetheless it is puzzling to me how we have reached new highs without an unambiguously positive transit hit to this chart. The Sun still has another four weeks to go in Gemini and it has yet to fully engage Ketu, so we will make an assessment on June 30 when that occurs. While some more gains are likely this week, I remain quite cautious for the next few weeks. Technically, however, its "all systems go" for gold as it made a fresh high, albeit on low volume. It bounced off of support at its 20 DMA ($1221) — a sure sign of a bullish trend — and now appears to be on its way to completing a rising wedge pattern that dates back to 2008. This is ultimately a bearish pattern since the rising levels of the highs are less than the corresponding rise in the lows. We can see that the daily MACD chart shows a negative divergence with respect to the previous high. RSI (64) is also showing a negative divergence with respect to the previous high in May. This does not mean we can’t get higher highs still in gold in the very near term (and I think we will) but it does suggest a significant pullback is likely in the medium term. The top of this wedge pattern comes in around $1275 (or possibly $1300) so that would be a target for next week. Support from the bottom of the rising wedge is now around $1200. A break below that level may spark a "waterfall" effect not unlike what we saw in US stocks in May where we got a sharp selloff after a long rise contained within a wedge pattern.
This week is likely to extend the rise in gold as the Sun forms aspect with Uranus on Monday and then Jupiter on Tuesday and Wednesday. Both influences are likely to be net positive so more upside is forecast. Monday and Tuesday appear to be more reliably bullish with Wednesday perhaps as a turning point. We could see sellers move in by the end of the week but overall the picture looks bullish. Thursday is perhaps the most likely day for a pullback on the Mercury-Saturn aspect. I move up to $1280 is therefore quite possible here with some profit taking by Friday that could take it back down closer to current levels. Gold may be quite volatile here so calling the size of moves is more difficult than usual. Next week may see fewer gains although Tuesday-Wednesday stands out as more positive. I would therefore expect a bearish outcome overall. The following week into early July could mark an interim bottom. While the down move should be significant, I think there’s a good chance we remain within the wedge. This means prices should stay above $1200 in any short term correction. That view could change as we need to gauge the effects of Mercury entering Gemini to join the Sun on Wednesday. Nonetheless, that is how it appears now. July should see another significant rally attempt with highs near July 16 and then August 2. I can’t say if these highs will be higher than current levels but it is not inconceivable. August and September look more thoroughly bearish as transiting Saturn will aspect the natal Moon in the GLD chart. We could see the 200 DMA challenged at this time, which is currently around $1089.
5-day outlook — neutral-bullish
30-day outlook — bearish-neutral
90-day outlook — bearish

