Summary for week of June 27 – July 1
Summary for week of June 27 – July 1
- Stocks may strengthen early in the week, but Friday’s solar eclipse could be very bearish
- Dollar weakness early but large gains likely by Friday
- Crude may rebound early but selling may return in second half of week
- Gold may bounce but Friday’s eclipse likely to create new lows
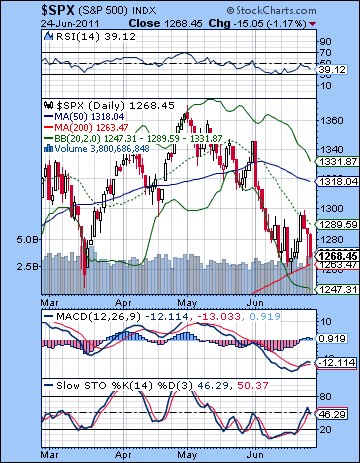 Stocks edged lower last week as hopes for a solution to the Greek crisis were offset by Bernanke’s fairly unenthusiastic remarks about the state of the economy on Wednesday. Despite a decent rally attempt early in the week, the Dow closed below 12K again at 11,934 while the S&P500 finished at 1268. While I was not especially bullish on last week and thought we could end flat, my forecast was incorrect as the declines came after Tuesday’s Mercury-Saturn aspect rather than before it. Even more puzzling was that Friday’s allegedly bullish Sun-Jupiter aspect coincided with a significant down day. If my forecast left something to be desired, my overall expectations of a retest of support at 1250-1260 was largely correct, although this was perhaps fairly obvious. Thursday’s intraday plunge went all the way down to the 200 DMA at 1262 before recovering on the sudden news that a new austerity program for Greece would be accepted.
The new austerity package for Greece seemed to lift markets on Thursday but the gloom quickly returned on Friday as there is a growing consensus that default will be inevitable. This is creating pressure on the Euro that makes it very difficult for equities to bounce since the two markets are now so closely linked. Bernanke was even more definitive in his rejection of a possible QE3 anytime soon so this will make it that much harder for the risk trade and the Euro. But it’s possible that the market has already discounted a Greek default, although perhaps not yet its consequences to the European banking sector. All this talk of austerity and default is of course very Saturnian but we seem to be no closer to turning a corner and resuming any kind of rally. I had wondered if the reversal of Saturn’s direction in mid-June might coincide with a gradual weakening of bearish Saturn and thereby allow Jupiter’s optimism to shine more brightly in the form of rising prices. While we did get the low of 1258 just a few days after the Saturn station, we have yet to see a significant rally take place. I’ll admit this is a little worrying especially in light of some decent Jupiter aspects over the past week or so. Perhaps sentiment is being weighed down by the upcoming eclipse on July 1, since eclipse periods are often volatile and marked by declines. But as long as the June 16 low of 1258 can hold, then we will still have a plausible case for some kind of summer rally, even if it is nasty, brutish and short. I’m still cautiously bullish, but I’m less confident that any rally will last very long or be particularly strong. Sideways may be a better descriptor for the next few weeks, even if we have a bullish bias.
 Despite a major retest of the 200 DMA, the technical picture was little changed. The successful test and holding of that support level arguably gave bulls something to crow about, although the situation still looks fairly iffy. That is perhaps how it should be before any kind of significant rally off of major support. There was a lot of chatter in the media about the 200 DMA and how it could be a tipping point for the market if it was violated on the downside. It’s a classic case of a self-fulfilling prophecy where the more people believe in it, the truer it will become. On the other hand, statistical tests of its efficacy in predicting future trends suggests it really isn’t as reliable as many think. What is more important is the slope of a moving average, rather than its level. While the shorter term 50 DMA is falling thus reflecting the current corrective phase, the 200 DMA is still rising and will continue to do so for some time. This is perhaps a better indicator that we are in a cyclical bull market. What is overlooked in this focus on the 200 DMA is that it also roughly coincides with the rising trend line support from the 2010 low as calculated in a linear fashion. The logged trend line broke several weeks ago at 1280-1290, but the SPX is trading above its linear scaled trend line which now comes in at 1250 or so. That offers further evidence for the bullish case that this correction may be over and that we are in a period of consolidation before moving higher.
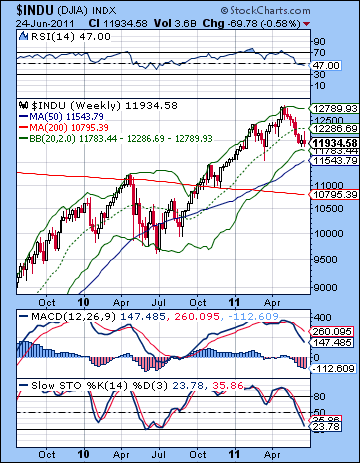
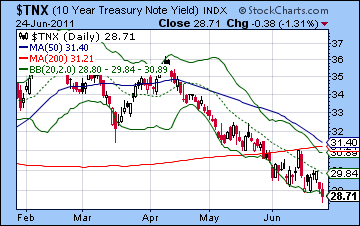
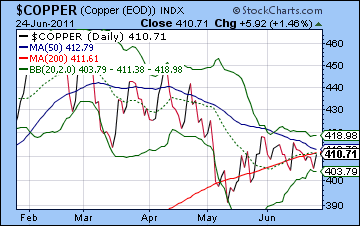
The fact that stocks made a higher low is also bullish. We can see that RSI (39) is moving lower but would likely be in a positive divergence with respect to the June 16 low if we suddenly broke down to 1250. We can also see a bullish crossover in the daily MACD chart, although the negative divergence is now fairly gaping with respect to the March low. On the other hand, the early week rally could not even hold above the 20 DMA before selling off again, a very low bar of bullishness to be sure. Bulls may also be concerned with the fact that volume increased on the two down days at the end of the week. While this could represent capitulation before a larger move higher, it may also simply reflect the increase of fear in the market. The weekly Dow chart still shows a bearish crossover in MACD and RSI continues to fall. As a more sensitive indicator, Stochastics (23) is coming closer to its oversold level and offers some support for the bullish case. The mid-2010 correction saw Stochastics reverse almost exactly at the 20 line for the first May low and then form a slightly higher low at the time of the July 2 bottom. If equities looked a little shaky last week, bonds continued to shine as a safe haven as 10-year yields moved to new lows below 2.9%. This creates a small divergence as stocks have not made new lows with treasuries. Divergences can go on for some time, but they eventually resolve themselves one way or the other. Yields do appear to have more downside to them, so that will likely stack the deck in favour the equity bears in the medium term. But copper moved largely in tandem with stocks last week and also finished mostly unchanged at 410. Copper continues to trade close to its 200 DMA (and yes, it’s still rising). It is just a few days away from a death cross of the 50 and 200 DMA, however, so this may re-awaken copper bears from their recent sideways stupor. Overall, the technicals side with the bulls unless or until the 200 DMA is broken along with the rising linear channel.
 This week will be another opportunity for Jupiter to show its bullish stuff although the end of the week could be problematic given Friday’s solar eclipse. The week begins with a Mars-Jupiter-Uranus alignment that should lift prices. There is also a Mercury-Venus aspect that is usually a bullish combination so that increases the likelihood of some upside at the beginning of the week. The fast-moving Moon joins both Mercury and Venus around noon so that could be an interim high water mark in any rally. Given the high number of planets involved, there is a possibility that the gains will be substantial. The good vibes could continue into Tuesday and the Moon-Mars conjunction near midday. Venus also conjoins Ketu here which can indicate significant price movements in either direction. Given the high number of aspects involving Jupiter, I would tend to think this could be a bullish combination although any rallies may reverse quickly. Ketu tends to be associated with sudden shifts of mood and situations so we could get some unexpected news that changes the direction. The odds for gains would appear to diminish by Wednesday, as Venus enters Gemini and the Moon joins Ketu. In fact, I would lean bearish here, especially if stocks had rallied to significant resistance levels such as 1290-1300. Thursday and Friday look bearish overall as the solar eclipse is due Friday in the early morning hours. This often marks volatility. The situation is made worse by virtue of the fact that Saturn squares the Sun/Moon conjunction. Declines could be substantial. So the end of the week looks bearish, with Friday looking more negative than Thursday. Generally, I would say the chances for gains is highest at the beginning of the week and gradually diminishes as the week goes on. No doubt reality will diverge from the forecast in many ways, but that is my working hypothesis here. We could see a quick rally to 1290 by Tuesday and then a erosion back towards current levels by Friday. That would perhaps be the most conservative forecast. That suggests that resistance will be tested by midweek, but the late week may bring another retest of support. I wonder if another sideways status quo week will favour the bulls ("consolidation before a rally") or the bears ("the rally is dead").
 Next week (July 5-8) looks fairly bullish with a nice Mercury-Jupiter aspect on Tuesday after the Independence Day holiday. But the Mars-Saturn aspect on Wednesday could limit the midweek upside and retest support. The end of the week looks bullish on the Venus-Jupiter aspect so that offers some possibility for a positive week. The following week (July 11-15) could be interesting because Uranus turns retrograde Saturday, July 9. Uranus retrograde stations can sometimes coincide with reversals in market direction. If the market has been rising ahead of this date, then it could mark a shift in sentiment. I’m not fully convinced it will work out that way, but it will be one additional factor to watch. The Mars-Ketu conjunction on July 22 is more likely to cause some turbulence, although I also think it may only be a temporary pullback in a larger up move. The rally may well last until mid- to late-August and the Mars-Saturn square. Jupiter will turn retrograde around this time, so that is another factor that could weigh on the market. As before, September’s Saturn-Ketu aspect should be quite negative and may coincide with a breakdown of technical support. I would not be surprised to see the indexes fall 15-20% in a short time span. Q4 looks pretty bearish overall with further declines likely in December and into January. All in all, there is not a compelling astrological case for holding significant long positions here as the downside risk will never be far away. A rally back to the right shoulder of 1350 is still quite possible and may even be the most likely scenario. However, I acknowledge a certain fuzziness about forecasting these summer gyrations given the panoply of influences. As a long term bear, it is perhaps more prudent to plan for the bullish outcome but be prepared to be underwhelmed if the market suddenly turns south.
5-day outlook — neutral-bullish SPX 1260-1280
30-day outlook — neutral-bullish SPX 1250-1320
90-day outlook — bearish SPX 1100-1200
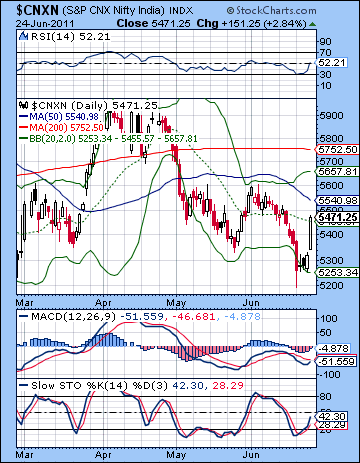 Stocks rebounded last week as prospects of the EU’s bailout of Greece buoyed hopes for stabilizing the global economy. After briefly retesting the February low on Monday, the Sensex recaptured the 18K level closing up 2% for the week at 18,240 while the Nifty finished at 5471. This bullish result was somewhat unexpected as I did not expect the force of the rebound to be so strong after Monday’s decline. That said, the market did roughly follow the road map suggested by the planets as we got significant weakness leading into Tuesday’s Mercury-Saturn aspect. I had been somewhat unsure just when the negativity might manifest, however, and therefore thought it could occur anytime before Wednesday. As it happened, the decline hit on Monday with Tuesday and Wednesday ending mostly flat. That perhaps was an adequate expression of Saturn’s bearish influence, along with the difficult Mars-Neptune aspect. The late week rally also conformed with expectations and reflected the growing influence of Jupiter. While I did not quite expect Friday’s huge gains, I did think the Sun-Jupiter-Uranus pattern on Thursday and Friday would likely see a positive finish to the week that could keep the indices above key support levels.
Last week provided some evidence that Saturn’s influence is indeed starting to wane as it picks up speed and resumes its normal forward motion. Worries about the global economy remain, however, as many investors continue to ponder the future viability of the EU in light of a possible — or is that probable? — default by Greece. All those worries about the austerity package are typical Saturn fare as the ringed planet tends to infuse sentiment with heavy doses of anxiety and fear. But the fact that global markets tracked mostly sideways last week instead of heading lower suggested that Saturn’s darkness was beginning to be offset by the brightening light of Jupiter. In other words, equity markets may have begun to find more solid ground, at least for a while. Just how long remains to be seen, although I would still be very cautious here. Yes, bearish Saturn is retreating and bullish Jupiter is strengthening, but there are still major obstacles for global recovery to overcome. The Euro chart is still significantly afflicted and suggests that any bailout of Greece will only provide very short term relief. On the whole, the Euro horoscope still exhibits a significant level of affliction for the rest of 2011 and into 2012. This is another clue that equity markets will continue to struggle for the foreseeable future as the liquidity-driven risk trade rally of the past two years is well and truly over. As we know, Indian markets have benefited massively from all this international hot money sloshing around the world looking for higher rates of returns. Perhaps the RBI’s higher interest rates can even attract more money for the local bond market, although this is unclear given the attendant inflationary risks. Indian equities are even less appealing, and we seem to be on the verge of another corrective phase.
 Technicals turned in favour of the bulls last week after Monday’s scary plunge that retested the February low below 5200. The inability of the bears to keep the pressure on allowed prices to rise back to the more moderate 5300 level and set the stage for Friday’s surge that closed above the 20 DMA above 5400. The successful test of 5200 therefore allows bulls to take the ball and run with it if they can. The next logical level of resistance would be 5600 which matches the June high and several secondary May highs. The bounce off 5200 is also supported by the RSI (52) which has rallied higher after the tell-tale touch of the oversold 30 line on Monday. MACD can also be seen as bullish here as evidenced by the beginnings of a bullish crossover and the positive divergence with respect to the May low.
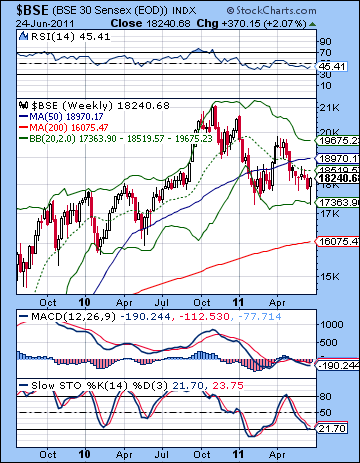
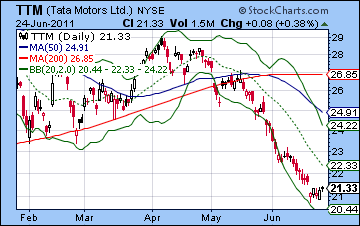
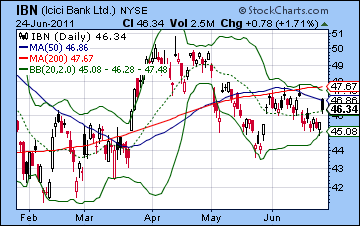
The weekly BSE chart also offers a bullish reading as last week’s low touched the lower Bollinger band. While this is not in any way reliable support, it is an additional piece of the technical puzzle. Stochastics (21) may have turned around after a brief touch of the 20 oversold line. If the short term technical outlook has improved, the longer term was made that much more bearish by virtue of the now downward sloping 200 DMA on the Nifty daily chart It’s only just begun to dip here but it’s clearly discernible. This is the first time the 200-day simple moving average has sloped downward since 2008. The 200 DMA (5752) therefore acts not only as an indication of the level of resistance, but when it begins to slope downward it is another indication that we may be entering a bear market. Any future rally will therefore have to contend not only with resistance at 5752 but also with reversing the slope of this moving average. The market may shows signs of life here but we may be only seeing a technical bounce before the final plunge. Tata Motors (TTM) remains in tatters here as it posted another weekly loss despite gains in the broader markets. It has not yet closed the gap down from the previous week, a sign of possible further weakness. Also note how volume on up days is consistently lower than on down days. The bear market is still very much in force on industrial issues such as TTM. ICICI Bank (IBN) is doing somewhat better but, like the indices, it has yet to claw its way to the 200 DMA. Volume is somewhat more encouraging, however, so it is still possible that it could break above the 200 DMA. Of equal importance is the falling trend line off the Nov 2010 high. The stock is just 3% from testing that line of resistance and a close above it would be considered bullish. Overall, the technical picture for the market as a whole looks bullish in the short term, at least until it reaches 5600. If it can surmount that level, then it would create more room to climb. If it fails again to break above 5600 with conviction, then it would spark more selling as weak bulls abandon ship.
 This week offers the prospect of more gains, at least in the early week as Jupiter may remain influential. Monday’s aspect involving Mars, Jupiter and Uranus would appear to be bullish, as is the Mercury-Venus aspect. Tuesday could also be positive as the Moon approaches its conjunction with Mars. This looks somewhat less reliably bullish than Monday, however, and I would not rule out a decline on Tuesday. Wednesday sees both Mercury and Venus enter new signs so that may also be bullish. But storm clouds may be gathering again as the week progresses as Friday’s solar eclipse may be quite negative. Eclipses are often bearish in any event, but this one stands out as being more reliably bearish and perhaps with a fairly significant magnitude owing to the close aspect from Saturn. The eclipse is exact in the early afternoon so that is a possible time to watch for the greatest volatility. With the early week tilting bullish, there is a good chance that the Nifty could rise towards resistance of 5600 by midweek. If Monday is higher as expected, then we could reach 5600 by Wednesday. Tuesday is harder to call, and there very well could be a down day mixed in there somewhere that slows the advance to 5600. Nonetheless, another test of that level would seem to be the most likely scenario. If we have reached resistance, then the late week eclipse suggests that the Nifty could reverse on profit taking by Friday. Where it will end up is unclear, although I suspect it may not be far from current levels.
 Next week (July 4-8) looks moderately bullish, albeit with a potentially nasty Mars-Saturn aspect throw in. The early week Mercury-Jupiter aspect looks bullish so that could represent a rebound rally after the previous week’s swoon. The Mars-Saturn aspect could sink prices into midweek but then another boost is likely from the late week Venus-Jupiter. Overall, this does not look like a down week and we may well be able to build on prior gains. The following week (Jul 11-15) looks more unsettled since Uranus will turn retrograde on Sunday 10 July. This can have a destabilizing effect on the market and help to shift medium term trends. While I don’t expect any major reversal lower just yet, it will be something to watch. In any event, this week tilts bearish. The rest of July looks choppy with the Mars-Ketu conjunction on July 22 likely causing some havoc, even if temporary. August may well begin positively, but I am expecting some deterioration as the month progresses. A reversal lower seems likely here, and there is the increased possibility of sudden declines as Mars will be quite strong at various times in the month. September is the time when we could see the largest percentage declines, however, as its aspect with Ketu could mark the breakdown of significant support levels. Depending on how high the Nifty climbs beforehand (5600-5800?), this could represent the breakdown of 5200 or, in a worst case scenario, of 4800. Generally Q4 looks bearish, although I think we will see some major relief rallies mixed in there to keep things interesting.
5-day outlook — neutral-bullish NIFTY 5400-5500
30-day outlook — neutral-bullish NIFTY 5400-5600
90-day outlook — bearish NIFTY 5000-5200
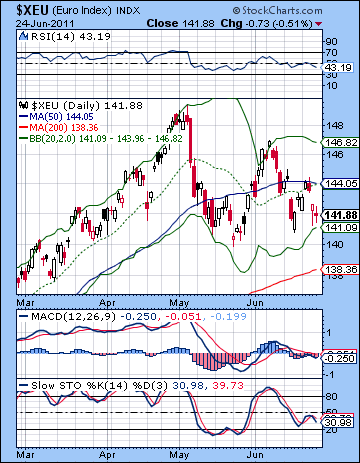 As Greece teetered once again on the precipice of default, the Euro took it on the chin again. The Euro fell below 1.42, while the USDX closed at 76.5 and the Rupee finished slightly weaker at 44.99. The bullish performance for the Dollar was largely in keeping with expectations, although my intraweek forecast left something to be desired. I had expected more Dollar gains in the early week, but they manifested only after the Mercury-Saturn aspect. This was somewhat confusing to say the least, although my general expectations were fulfilled. The Euro is clearly in trouble here as most investors are not putting much faith in any austerity program or bailout package. Default seems inevitable, so it’s only a matter of time. While the default has not been fully discounted by the market yet, some of it likely is. Of course, the ongoing Greek tragedy is only one half of the equation as the US attempts to avoid a damaging showdown over raising the debt ceiling which comes due on Aug 2. The longer the political struggle drags out, the more likely it will become a factor in currency markets. And with the tight correlation between the Euro and equities, all those Washington insiders may be holding the future of the stock market in their hands. Obama’s horoscope does not look very good for early August, so that is an additional factor to consider when piecing together the currency outlook. It may have nothing to do with the debt ceiling, but it does increase the odds for problems at that time. Technically, the Euro has managed to stay above its previous low of 1.40 so that offers some evidence for bulls. Also, price has moved close to the lower Bollinger band suggesting that further downside will require a new catalyst.
This week looks fairly bearish for the Euro, especially at the end of the week at the time of the solar eclipse. This is a strongly Saturn-influenced eclipse and we could see a significant flight to safety. Moreover, it will occur exactly opposite the natal Sun in the Euro’s horoscope. That could give it an added punch. Ahead of the eclipse, we could see some upside on the Venus-Ketu conjunction on Tuesday. I would not be surprised to see the Euro bounce back to 1.44 and the 50 DMA. July may be choppy with a bearish bias for the Euro, especially around the Mars-Ketu conjunction on Jul 22. August looks more positive, however, as the Jupiter station at 16 Aries will aspect the Euro’s natal Sun almost exactly. This is likely to provide some lift. And it may well coincide with problems around the US debt ceiling. But the Euro still looks generally weak for 2011 and 2012. September should be quite bearish for the Euro with lower lows likely in early 2012. The Euro chart is sufficiently afflicted that will likely see some kind of re-organization of the Eurozone over the next year or two.
Dollar
5-day outlook — bullish
30-day outlook — neutral-bullish
90-day outlook — bullish
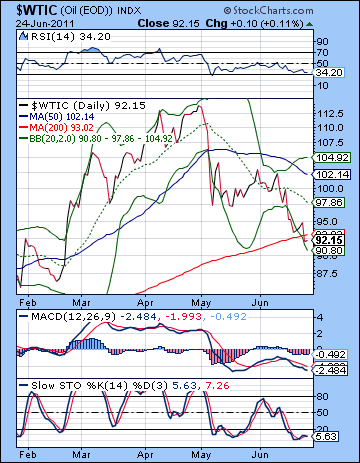 Crude plunged late last week as the IEA released 60 million barrels from its emergency supply in order to offset the loss of Libyan exports. Although it is intended as a short term measure lasting for just one month, the market reacted quickly as crude briefly traded below $90 before closing around $92. Although I expected a significant test of the $92 support level, my forecast was wide of the mark since I thought the weakness would arrive early in the week. The bearish mood around oil continues to push prices lower as various parties struggle to contain the damaging effects of high prices on an already slowing economy. Prices are now testing support of the 200 DMA at $93. The 200 DMA is still rising, however, so we should be reluctant to declare a bear market. Nonetheless, the momentum is mostly lower here as the bottom Bollinger band is now guiding price lower. RSI (34) is getting close to oversold levels, however, although it still has a little ways to go before reaching the 30 line. Of course, a volatile market like oil needn’t adhere to the 30-70 line logic as commodities can get very oversold when sentiment turns negative. Stochastics (5) are barely managing to keep afloat while MACD is still in a bearish crossover. The downside target of the head and shoulders pattern is $86 and it looks increasingly likely that that level will be tested. If crude should rally from current levels, then $92 would still act as support in the event of any further pullbacks. However, it needs to climb above the H&S neckline at $96 in order to break the current negative pattern, otherwise it will stay mostly bearish.
This week could have some early upside but it may not hold in the face of Friday’s solar eclipse. Monday and Tuesday offer good opportunities for gains as the Mars-Jupiter-Uranus aspect should boost risk appetite. More uncertain, however, is the effect of Tuesday’s Venus-Ketu conjunction. This can be a bullish pairing but it can easily flip the other way. What makes it especially pertinent to the oil market is that the conjunction will occur in a very sensitive spot in the Futures chart — the ascendant. This suggests a significant price move in the early week, and while I would lean bullish, I would not rule out a negative outcome also. In any event, the odds for declines increases as the week goes on. If we do see that early week rise, it could top out around the 20 DMA at $95-97. The decline would appear to be at least equally forceful, however, so perhaps the week will end close to current levels. Generally, crude does not look very positive here and so we could see it drift sideways through July. Some upside is possible in August so we cannot rule out $100 at some point. In fact, I would think it is likely that crude will again reach $100 at some point over the summer. This is likely to occur on Dollar weakness sometime in August. Then September is shaping up as very bearish with some recovery likely in October. $80 is very possible by September and I would not rule out $60 at some point in Q4.
5-day outlook — bearish-neutral
30-day outlook — bearish-neutral
90-day outlook — bearish
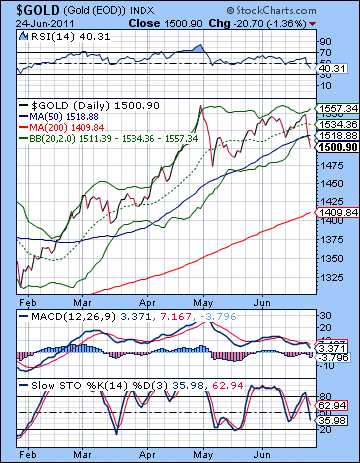 Gold fell sharply last week closing at $1500 as more investors sought safety through the US Dollar. This was a particularly bearish development given the ongoing troubles in Greece which previously had made gold more attractive. While I had expected some downside and a test of the 50 DMA, the declines came later than expected. The late week bearishness was especially disappointing coming as it did near the Sun-Jupiter aspect. The technical picture has worsened considerably here as the rising trend line off the January low was back tested early in the week and then we got lower lows. Gold is now trading below its 50 DMA and its lower Bollinger band. RSI (40) still has more room to fall before being oversold on the daily chart and MACD is still falling and in a bearish crossover. Stochastics (35) are also falling but may move lower before the odds of a reversal higher are sufficiently compelling. The longer term rising trend line is still intact and comes in at $1450. Patient bulls may be waiting for a pullback to that level before entering new long positions. The 200 DMA at $1409 is another area of possible support that may entice new money. Resistance may be at the rising trend line but that is looking increasingly irrelevant in the near term since it is around $1560. More immediate resistance might be the previous low at $1520.
Gold may experience a bounce from some bargain hunting early in the week but Friday’s solar eclipse could definitely shake things up. Tuesday’s Venus-Ketu conjunction could lift sentiment, but this seems like a bit of a wild card and somewhat unreliable. I lean bullish until Wednesday, but it’s a cautious bullishness. Ketu is notoriously full of surprises so a larger price move is also somewhat more likely. But the aspect of the week is likely going to be Friday’s solar eclipse. This eclipsing of the Sun by the Moon could dim gold’s appeal on Thursday and Friday. All the more so since Saturn will cast its square aspect at the same time. This is quite bearish indeed and we could see a substantial decline. I would therefore think there is a good chance gold could move up to resistance ($1520-1540?) and then reverse sharply lower. A low below $1500 is very possible by Friday. Gold looks mortally wounded here so I am not expecting any sudden rallies back to new highs anytime soon. That does not preclude some consolidation around current levels but there may well be more pressure amidst the sideways drifting. Some gains are possible in August on Jupiter’s slowing velocity but there are a number of nasty short term aspects that could chip away at any rally attempt. September looks more reliably bearish as Saturn becomes the dominant energy while in aspect with Ketu. Gold looks very bearish over the next 6-12 months as Saturn lines up in its final opposition to Jupiter in early 2012.
5-day outlook — bearish
30-day outlook — bearish-neutral
90-day outlook — bearish

