Summary for week of June 6 – 10
- Stocks should generally move higher, especially after midweek
- Dollar likely to fall further this week as consolidation continues
- Crude will likely rise after early week choppiness
- Gold to remain bullish as up trend stays intact
Summary for week of June 6 – 10
- Stocks should generally move higher, especially after midweek
- Dollar likely to fall further this week as consolidation continues
- Crude will likely rise after early week choppiness
- Gold to remain bullish as up trend stays intact
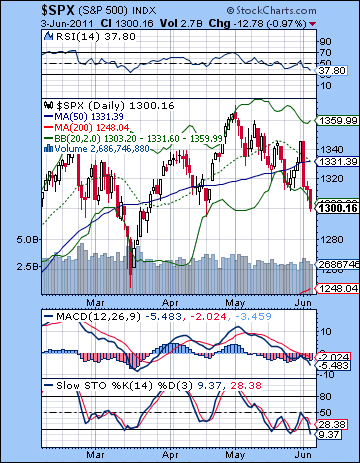 Stocks fell for their fifth week in a row as some pretty ugly economic data called into question the sustainability of the recovery. Not even Friday’s prospect of a new bailout package for Greece could break through the jobs gloom, as the Dow lost more than 2% closing at 12,151 while the S&P500 finished at an even 1300. While the decline was generally heartening given my cautious stance, the daily moves were somewhat at odds with my forecast. I thought we would see more downside leading up to Wednesday’s Sun-Saturn aspect but instead we got a solid gain on Tuesday. This was quite a worrisome development, especially since it broke above resistance in May’s falling channel. Fortunately, Wednesday’s sharp 2% selloff coincided with the exact Sun-Saturn aspect and the bears took control. Interestingly, this Sun-Saturn aspect also occurred on the same day as a solar eclipse (Sorry, I neglected to mention this last week). This was perhaps even more fitting, as we saw a sudden shift in sentiment. Thursday’s Mercury-Jupiter aspect was not bullish enough to produce gains but only arrested the pace of the decline. Friday’s Mercury-Neptune aspect was bearish as expected as the market lost another 1%. I wasn’t sure when the low of the week would occur, as both Wednesday and Friday offered plausible alternatives. As it happened, Neptune’s nasty side did show up and we got the lows on Friday.
The mood definitely seems to have darkened here as more commentators are openly pondering whether another recession is around the corner. What’s worse is that there is a growing realization that the Fed and the government may be running out of options to kick start the economy. If QE1 and QE2 successfully avoided a total meltdown and spurred the huge stock rally over the past two years, it is another matter entirely if a further round of Bernanke’s stimulus can work its magic for a third time. Prominent voices such as Pimco’s Bill Gross suggest that QE3 is increasingly unlikely because of a hostile political climate in the US to further deficits and such a move would create more dangerous inflation around the world. All this economic hand-wringing and gnashing of teeth is perhaps symptomatic of Saturn’s influence which appears to be ruling the sky at the moment. Saturn is all about debt, recession, caution, and pessimism, so it’s quite fitting that we should see Greek debt woes take the stage one week and then have US recession worries take over the next. If the news is all bad, then that is a clue that Saturn is in control. Retrograde Saturn has barely any velocity here as it backs into its direct station on June 13 and forms that potentially troublesome aspect with Pluto. Jupiter seems poised to take a more prominent and positive role in the coming weeks, however, so we will have to see to what extent it can offset some of this pessimism.
 From a technical perspective, the market seems to be at a critical inflection point. The trend line from the March 2009 low is being tested here and if it breaks, it could undermine the viability of the cyclical bull market. The line goes through 1300 so any close significantly below that level would definitely make the bulls worry. It is possible that we could get a one day close around 1290 and not cause too much technical damage and long as there was a quick recovery. But the bull market is definitely on notice here as May’s pullback appears to be more bearish than the one we saw in February/March. Although the previous correction was actually larger than the current one, this one threatens to change the market dynamic more fundamentally due to the proximity of the trend line. Also we can see that Friday’s close at 1300 was right at the bottom of May’s descending channel. This is another source of support as we go forward. Tuesday’s gain likely confounded many technically-oriented traders since it broke above resistance. This turned out to be fake out, however, and the resulting overshoot may well be mimicked on the downside in the coming days. Perhaps it increases the odds that we will briefly break below that falling channel although perhaps not decisively.
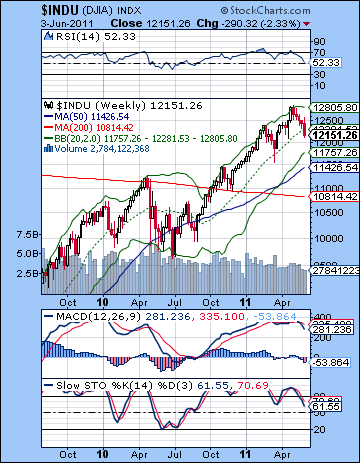
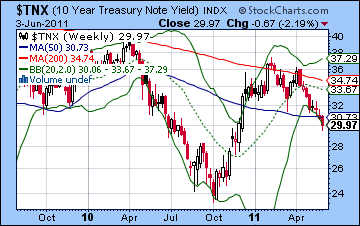
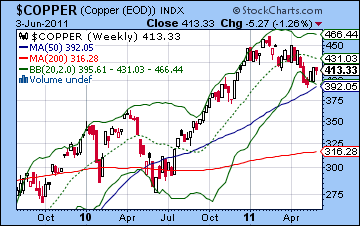
Last week’s bearishness somewhat increases the likelihood of the head and shoulders pattern with a 1250 neckline. This would still require a decline to about 1250 before forming the right shoulder at 1340. I am doubtful that we could see such a large decline next week, although it is still possible for the mid-June period. That would be more bearish for the summer obviously as it would mean a significantly weaker market than I am currently expecting. That is the bear case: sideways with a lower high sometime in June or July (RS=1340?). The more bullish case hinges on whether 1290-1300 can hold over the next two weeks and thereby keep the market on the bullish side of the rising trend line intact for a while longer. It is still possible that we could see a breakdown of this trendline but it may occur later in June. This would represent a sideways market and would likely involve a break and then a back test of the trend line anywhere between say, 1340 and 1400. Although we could see a back test of the trendline, we could still form a higher high. The weekly Dow chart does not provide much additional information this week, although we may note that the 20 WMA did not act as support last week. MACD is still in a bearish crossover and stochastics are heading lower. Not surprisingly, bond yields stayed lower last week as the 10-year closed below 3%. As long as yields continue to fall, there will be less money left to chase stocks and push equities higher. On the other hand, copper remains relatively strong here although it did pullback modestly last week. It has yet to test resistance from the falling trend line, however. This makes it a somewhat less compelling case of its bullish divergence with equities.
 This week appears to favor the bulls, mostly on the basis of the greater Jupiter influence. Jupiter forms an aspect with retrograde Neptune that is exact on Thursday. In addition, Venus will join that bullish pairing at the end of the week and increase the odds for gains in the second half of the week. The first half of the week is harder to call, however. Monday begins with a Moon-Mars aspect that could keep investors on edge, especially in the afternoon. There is also a Mercury-Saturn aspect that is building at that time ahead of its exact aspect on Tuesday. So that increases the likelihood of a down day on either Monday or Tuesday. Either day is possible from a technical standpoint since Monday could involve a test of 1290-1295 before reversing higher or we could see a short-covering rally Monday followed by a re-test of 1300 on Tuesday that creates a higher low (1305-1310?). I tend to think the latter scenario is somewhat more likely but perhaps not by much. Venus moves into position on Wednesday and Thursday so that does look bullish. Two solid up days are quite possible here, especially if we have had that retest of 1300 beforehand. Friday looks more suspect, however, as the Moon conjoins Saturn and Mars edges closer to its aspect with Rahu. If the SPX is back up at resistance at the top of that falling channel, then this would be a good candidate for a down day. Assuming the bottom doesn’t fall out of the market on Monday, there is a good chance we could climb back to 1330 by Friday. I’m not sure if there is enough bullish energy on Friday to keep it near that level, but we should at least be higher on the week.
 Next week (June 13-17) we could see some larger moves as Saturn turns direct on Monday while Mercury and Sun both conjoin Ketu. As if that wasn’t enough, Mars will be in aspect with Rahu and there will be a lunar eclipse on the 15th. . Taken together, these look to be pretty bearish aspects that have the potential to move markets sharply lower. That said, I should caution that it is possible we could see quick moves in both directions that limits the extent and duration of the downside. When planets change direction as Saturn is doing here, it can mark a sudden change in trend. So I cannot completely rule out a higher week overall, although that does not look probable. The following week (June 20-24) will likely start bearish on the Mars-Neptune square, but will probably end bullish as Jupiter approaches its aspect with Uranus. I think a positive net outcome on the week is more likely here. Jupiter would appear to be strengthening at the end of June and early July so this could be a time when the market is moving higher. It’s still possible we could see the market drift mostly sideways here as Saturn will still be moving slowly and Rahu will be just sitting there in the last degree of Scorpio. I would have thought that these placements would have generated more downside by June 1 than it has, so it’s conceivable that some of it may be delayed somewhat. While that’s possible, I think it makes more sense to anticipate some strength going into the summer and at least be prepared for more upside, especially if the technicals appear to support that view. A lot will depend on the fate of that rising trend line and if the SPX can rise above its possible right shoulder of 1340. As before, the second half of 2011 looks fairly bearish.
5-day outlook — bullish SPX 1310-1330
30-day outlook — neutral-bullish SPX 1280-1350
90-day outlook — bearish-neutral SPX 1250-1320
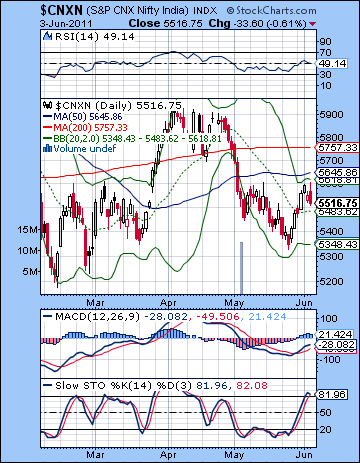 Stocks moved higher last week as low valuations tempted more FII money in the market. Despite a late week pullback, the Sensex gained almost 1% closing at 18,376 while the Nifty finished at 5516. This bullish outcome was somewhat disappointing since I had expected more downside ahead of the midweek Sun-Saturn aspect. Paradoxically, the gains were clustered right at the time when I thought we had a good chance for declines. It was a humbling result in that respect. Nonetheless, I did acknowledge some divergence between the apparent bearishness in the stars and the more positive technical outlook. I therefore moderated some of my confidence in any possible downside. As it happened, the Sun-Saturn aspect did figure prominently but in an unexpected way: Wednesday’s exact aspect coincided with a solar eclipse and this appeared to mark a sudden shift in sentiment as the global mood turned sour following a rather discouraging US employment report. Friday’s loss did correspond quite closely with my bearish expectations as Neptune turned retrograde while in aspect with Mercury.
So it seems that the market is as indecisive and range bound as ever. At the same time, it is important to note that there is perhaps a growing sense of unease about the US economy and its implications for the global recovery. The stock market rally of the last two years has come courtesy of the Fed and its substantial efforts to stimulate the economy. But all of Bernanke’s billions from QE1 and QE2 has not produced a sustainable recovery in employment in the US and this is increasing calls for a possible QE3. No doubt many bullish investors are relying on the never-ending flow of liquidity from the Fed and other central banks to prop up the stock market indefinitely. But if last week’s disappointing economic data out of the US has made QE3 a more appealing prospect, it may be less likely to happen. That is because: 1) there is widespread opposition to more deficit spending by both US political parties and 2) the negative inflationary implications of such a move are increasingly obvious and would cause an uproar with US trading partners. Indian markets have largely escaped the worst of this May correction although they remain subject to the same global forces. As I have noted in previous newsletters, this increasing pessimism is very much in keeping with the prevailing influence of Saturn. Earlier in the month, Eurozone debt worries were the main concern as sovereign debt threatens to overwhelm the market. Even if the EU has cobbled together another bailout package for Greece, we can see how that Saturnian energy simply morphs into another form of negativity, as we saw with last week’s bleak US jobs reports. Saturn’s symbolic portfolio includes both debt and recession so it is not surprising that we should see both of these issues emerge while Saturn is dominating the sky ahead of its direct station and square aspect with Pluto on 13 June. This is not to say that the markets will necessarily fall into that date, but they are more likely to struggle to make any solid gains.
 Bulls got a nice follow through on the broken falling wedge as the Nifty climbed back to the top Bollinger band. Friday tested resistance at 5600 before reversing lower. While bulls can rightly point to higher lows in the past couple of weeks, a more important challenge lies ahead in attempting to push above the 50 DMA at 5645. This has proven to be significant resistance throughout the month of May and is a major hurdle for the rally’s second leg upward. A more ambitious target would be 5800 of course which would represent the falling trend line off the November 2010 high. That would seem to be a tall order indeed. Bulls are perhaps hoping that any further pullback in the near term bottoms out around 5450, thus creating the right shoulder of an inverted head and shoulders which would signal a more sustainable rally. Such a pattern would have an upside target of 5850.
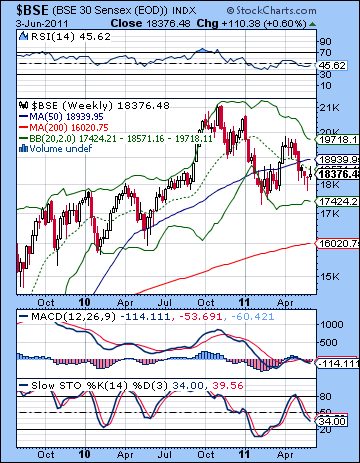
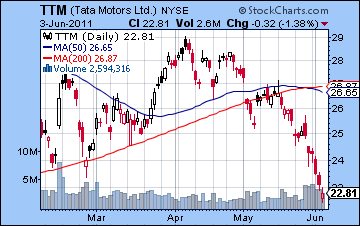
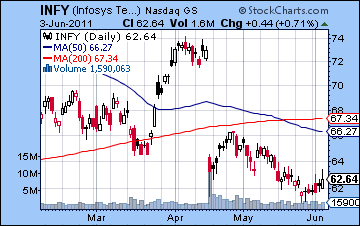
But the market is looking temporarily overbought as Stochastics (81) have climbed above the 80 line as RSI (49) tries to avoid heading lower once again after gamely making it above 50. I would not be surprised to see the Nifty move lower to test support at 5450. If it closes below this level, then it would increase the likelihood of a retest of 5350. If it stops and reverses higher, then the IHS pattern would be in play and this could see a real test of resistance at 5650 and the 50 DMA. The weekly BSE chart appears to be forming a triangle pattern with a series of higher lows and lower highs. We can see how range bound the market has been as the previous low did not even touch the bottom Bollinger band, just as the previous high did not touch the upper band. Stochastics (34) are fairly weak here and may be setting up for some kind of reversal higher. The uncertainty of the market is illustrated by the widely differing situations of the blue chips. As a reflection of the possibility of a global slowdown, Tata Motors (TTM) has fallen to new lows for the year. This is a bleak looking chart to be sure, as there are no immediate signs of support. And as beat up as Infosys (INFY) is, it may be forming some kind of bottom. Last week’s lows retested the intraday lows from April’s big sell-off and could begin to build a base from which to rally back to the 200 DMA. It still isn’t a very bullish picture in the long run, however, as the 200 DMA will be significant resistance, but it allows for the possibility of some upside.
 This week looks generally bullish as Jupiter will likely enjoy a greater influence through its aspect with Neptune. While the week tilts bullish, the early week offers the hint of more downside as Mercury is in aspect with Saturn on Tuesday. It is therefore possible we could see a down day on either Monday or Tuesday, although I would tend to favour Tuesday on that score. Of course, last week’s Sun-Saturn aspect did not behave as expected, so we should be careful about the outcome of this Saturn aspect. Given the current technical set up, we could see that test of 5450 on Monday and that would open up the possibility of a reversal on Tuesday. By Wednesday, there should be an increased chance for gains as Venus joins the Jupiter-Neptune aspect creates what should be a bullish alignment that could last until Friday. There is a good chance we will see two up days out of three after Tuesday and I would not be surprised to see gains on all three days. Even if we first get a retest of 5450, there is a good chance that the Nifty will retest resistance at 5600 by Friday. And it might not stop there as 5650 could well be in play also. But if the short term influences are looking bullish here, the medium term influence are somewhat less positive and could undermine some of this scenario. We’re now in an eclipse period which will last until mid-June and Saturn is still looming ahead of its aspect with Pluto. In other words, much of this bullishness needs to be treated cautiously. It is perhaps a recipe for a choppy market that is intent on moving sideways until the next major technical development occurs.
 Next week (June 13-17) appears to favour the bears as we will see several overlapping influences. Saturn will reverse its direction and begin its forward motion on Monday, while the Sun and Mercury will conjoin Ketu on Monday and Tuesday. Mars will also form a passing aspect with Rahu while a lunar eclipse occurs on Wednesday. It looks like a very full and portentous week indeed. There is an increased likelihood of a larger move lower on these aspects, although I would also say that we could see sudden moves in both directions. The overall direction of the moves will tend to be lower, however. If the Nifty is at resistance, then this week will likely see it move lower. The following week (June 20-24) looks more bullish although the early week seems more negative, perhaps as a follow through from the preceding week. Jupiter will likely increase in strength as we move into July as it aspects Pluto on the 8th. Whether or not it will have enough positive energy to challenge the falling trend line at 5800 remains to be seen, however. I generally think it will, although a lot will depend on what kind of pullback we see around the Saturn station and the lunar eclipse. The odds of a deeper decline will increase as we move into August and September as the Saturn-Ketu aspect could prove to be very bearish. This correction will likely form new lows for the year. The generally bearish mood could well extend to the end of the year as Nifty could dip to 4000.
5-day outlook — bullish NIFTY 5550-5650
30-day outlook — neutral-bullish NIFTY 5400-5800
90-day outlook — bearish NIFTY 5300-5500
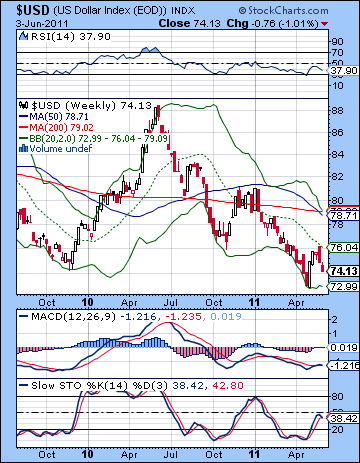 The dismal US economic data pushed more investors out of the Dollar last week as the greenback continued its consolidation. After a brief flirt with gains early in the week, the Dollar ended lower at 74.13. The Euro was buoyed by yet another Greek bailout package and closed at 1.463 while the Rupee held steady at 45.35. While I was not far off forecasting the intraweek dynamics, the Dollar fell far short of my expectations. I expected some upside early in the week and that arrived on time, although it was little more than a blip. Also the late week period was pretty negative as Mercury-Jupiter really lit a fire under the Euro. All of a sudden, the technicals are not looking that great for the Dollar. On the daily chart (not shown), it has given up the 50 DMA and has also fallen below the 20 DMA. It fell through the 50% retracement level (74.5) last week from the recent rally and now seems to be drifting lower in search of any kind of support. One possible bright spot might be that it closed on the bottom Bollinger band on Friday so that may increase the odds of a reversal higher in the near term. On the theme of "it’s so bad, it’s good", Stochastics (7) are very oversold and suggest a bounce. MACD is in a nasty bearish crossover, however, although it is only now back to the zero line. This presents a glimmer of hope for the bulls since it could conceivably reverse higher here. The weekly chart is looking stronger and appears to show a longer term rally underway as Stochastics (38) are still rising. MACD is flat but may be at the start of a bullish crossover.
While we could see some upside on the early week Mercury-Saturn aspect, this week does not look Dollar-friendly. The late week Venus-Jupiter-Neptune alignment looks quite bullish in the Euro chart so I would expect to see the Dollar slip further here. What is interesting is that we are getting a taste of a potentially scary new pattern in the market as the Dollar sold off alongside stocks and most commodities, except for gold. This is really the "game over" scenario for the intermediate term as more investors give up on the US completely. Treasuries are still holding their appeal for now as safe haven investments, but that is in anticipation of an economic slowdown. Previously, the Dollar has usually traded inversely with stocks. Now that relationship appears to be breaking down as the recovery is called into question. It remains to be seen to what extent this direct relationship will continue. I think the Dollar will rebound eventually, although we may have to wait for July. It could rally somewhat ahead of that time, but it may be more tentative. More upside is likely for the Dollar in Q4 as the Euro will crumble under the weight of its internal contradictions.
Dollar
5-day outlook — bearish
30-day outlook — neutral-bullish
90-day outlook — bullish
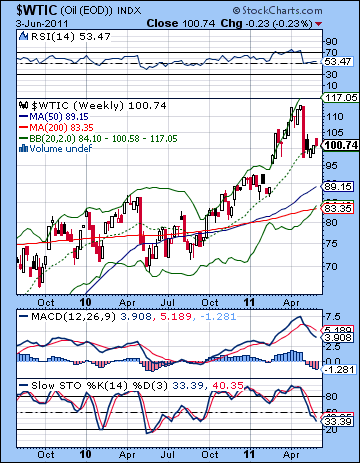 As falling demand prospects were offset with a decline in the US Dollar, crude finished the week where it started at a little over $100 on the continuous contract. I had been equivocal in my expectations here so this outcome was not too surprising. The early week downside on the Sun-Saturn aspect did not arrive until Wednesday and largely erased Tuesday’s gain. The end of the week was fairly flat, although we did see some intraday weakness that tested support below $100 once again. Crude remains range bound as support at $95 continues to hold firm and shows no signs of erosion. Tuesday’s climb to $103 was somewhat bullish but failed to match the previous high and did not reach the 50 DMA either. Until support is broken at $95, this will likely trade sideways. If it challenges the 50 DMA at $105 then it could make another run at its previous high at $114. On the daily chart, Stochastics (62) are pointing lower after peaking very close to the overbought area. This marginally increases the likelihood of some downside. More positively, there is a bullish crossover in MACD that suggests that a base is being built, especially since it is below the zero line. RSI (46) has climbed off its lows but has yet to move above the 50 line. The weekly chart reflects the mixed picture as Stochastics (33) are falling sharply and have a little ways to go before they become oversold.
This week has a reasonable chance for gains as Jupiter approaches its aspect with Neptune. Neptune tends to represent liquids such as oil so that makes gains somewhat more likely than they otherwise would be. The early week period may be more choppy, however, as Tuesday’s Mercury-Saturn aspect could correspond with a decline. I would therefore expect further testing of support below $100 before the Jupiter influence assets itself by midweek. With Venus joining Jupiter and Neptune by the end of the week, I would not be surprised to see crude rise to the 50 DMA and $105 by Friday. Friday itself is harder to call since there is a Mars-Rahu aspect that may begin to affect the market as the day wears on. Next week’s lunar eclipse and Saturn station suggest a more bearish outcome. If we get a rise to $105 beforehand, however, it seems fairly unlikely that we will see that critical support level broken at $95. It’s possible, but it does not seem probable at this point. Crude may continue to be range bound as we move into July, although the range may begin to widen, between $90 and $105. We could see support violated sometime in July as Mars aspects Saturn on the 5th and then conjoins Ketu on the 23rd. But it does not look like a major new correction but simply the result of choppy trading that includes lower lows. August looks like the start of the next significant correction with the most intensely negative time occurring in early September.
5-day outlook — bullish
30-day outlook — bearish-neutral
90-day outlook — bearish
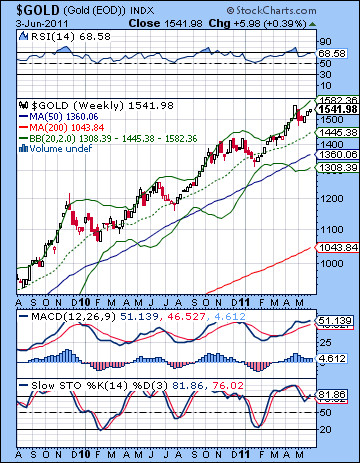 Gold extended its recent rebound rally as the Dollar was unceremoniously dumped in the wake of discouraging employment data. While it pulled back a bit from its early week highs, gold nonetheless moved higher overall closing at $1541. This was a disappointing outcome given that the Sun-Saturn aspect offered the potential for deeper downside. While I didn’t expect any dramatic trend line breaks in support, I thought that gold could finish lower. Clearly, gold’s longer term planetary influences are overriding any short term effects as it has become the asset class of choice in the current financial situation. The recent correction stopped at the trend line and is now moving higher once again and is on the verge of challenging recent highs at $1570. On the daily chart (not shown), gold looks overbought (as usual) here as RSI (61) is again driving toward the 70 line while Stochastics (93) is already deep into nosebleed territory. Long term support remains with the rising trend line now at about $1450. Medium term support would seem to be closer to $1520 which is where the rising trend line off the January low comes in. Even if $1520 is broken, gold may not be that vulnerable to a larger correction unless it forms a low which is lower than January’s low at $1475. Pullbacks will continue to be bought until we see an interruption in the pattern of higher highs and higher lows. The weekly chart is perhaps even less enticing to medium term bulls as RSI (68) is again bumping up against the 70 line while Stochastics (81) are again overbought.
This week looks bullish as the Jupiter-Neptune aspect seems likely to encourage the risk trade. Of course, now that some of those basic intermarket dynamics are shifting, it’s possible that gold could wind up at the back of the line if stocks attempt another rally. The early week Mercury-Saturn aspect could translate into some downside but I would be surprised if it got very far. Thursday’s Venus-Jupiter-Neptune alignment looks quite bullish so there is a good chance we will see more upside. I would not be surprised if it matched the previous highs. I had thought that the Sun’s transit of Taurus might more problematic for gold but so far it has been up, up and more up. The Sun will conjoin Ketu next week so that will be a potential stumbling block. It is possible that the combined effects of the reversal of Saturn and the Sun-Ketu conjunction might introduce some new (i.e. less bullish!) energy into the gold market. It’s possible, but the upcoming Jupiter-Uranus aspect on June 24 may counteract the worst of its immediate effects. So it is possible that we may have to wait until early July and the Mars-Saturn aspect before some of these more important support levels and trend lines are broken.
5-day outlook — bullish
30-day outlook — bearish-neutral
90-day outlook — bearish

