Summary for week of March 14 – 18
Summary for week of March 14 – 18
- Monday may be volatile, followed by midweek recovery on Mercury-Jupiter conjunction, then bearish again by Friday
- Dollar to stay firm with more upside possible on Thursday or Friday
- Crude likely to rise into midweek with profit taking likely by Friday
- Gold may post gains into midweek but vulnerable to declines in late week
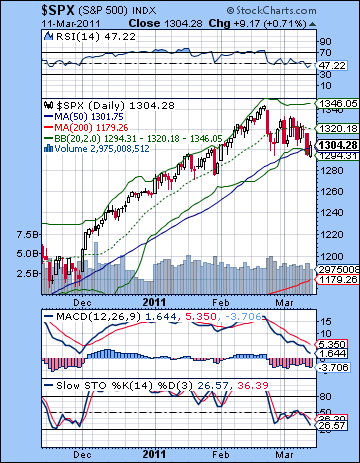 Ding-dong, the wedge is dead. Or at least mortally wounded. Stocks broke through crucial technical support this week as signs of a global economic slowdown added to worries over Libya that sent investors to the exits. And yet despite this major development, the Dow was only down 1% closing at 12,044 while the S&P500 ended the week at 1304. This bearish result was in keeping with last week’s expectations as I thought we might finish lower. However, I did not quite expect the wedge to break down here although I thought if we did, the best chance was late in the week. As it turned out, I was off by one day — I thought Friday would be more bearish than Thursday. That said, the low of the week did occur Friday at the open. The rest of the week unfolded roughly according to forecast as Monday was lower on the Sun-Moon-Saturn pattern. I had been fairly bullish about the trend going into midweek and indeed stocks did rise in that period putting in their high for the week on Wednesday. I was also correct by saying that Wednesday would be less positive and more susceptible to declines that Tuesday. The late week period was also generally bearish as expected in advance of the nasty Mars-Saturn aspect.
It is interesting to see how there has been a shift in tone over the past few weeks. For months, many commentators were talking up the dangers of inflation even while stocks continued to climb. This was perhaps the first optimistic phase of ‘good inflation’ as the downside risks were not fully factored into the equation. Significantly, much of the inflationary spiral of stocks and commodities took place at a time when Jupiter (growth, expansion) was conjunct Uranus (risk, change) in Q4 2010 and in the first weeks of 2011. Once these ‘good inflation’ planets began to separate, sentiment began to change. Emerging markets began to sell-off as the negative implications of Bernanke’s QE2 fast money began to be felt. US Stocks have only begun to pay the price now as ‘good inflation’ has morphed into ‘bad inflation.’ Perhaps not coincidentally, Jupiter is fast closing in on on its opposition aspect with Saturn, the planet of restraint, contraction, and caution. Saturn has not brought about an end to inflation talk, but it has rather reminded investors about inflation’s negative consequences. Expensive oil means less money available for consumer spending and that means lower growth and a greater risk of another recession. As we approach the date of the exact Jupiter-Saturn opposition on March 29, we can look for continued fears about a slowdown and economic contraction. Of course, stocks are likely to suffer also as prices move lower to reflect these diminished expectations. So I am cautiously optimistic that the long-awaited correction is finally underway. It has arrived a few weeks later than expected but let’s first see how much follow through there is on the downside here.
 While the breakdown of the wedge is very welcome news indeed (logged or unlogged!), this does not automatically mean that a bear market is immediately underway. It does mean that market direction is up for grabs once again after having been in the bulls’ hands for many months thanks to QE2. If bulls have become too complacent in the recent regime, then this new technical reality may well signal a major shake-up. Of course, it greatly increases the chances of a correction although how low we go remains an open question. Conservative estimates based on technical analysis suggest anywhere from 1220 to 1260 as a downside target in the near term. A more thoroughgoing correction would likely test the rising trendline off the July low at around 1170. In the near term, we will likely see the wedge now act as resistance in the event of any rally attempts. Next week this line will be around 1320. Even if we see a rally back to 1320, this would still be consistent with a corrective move as long as the SPX then proceeded to fall more sharply after that. The correction would be postponed or canceled only if the rising wedge resistance line is penetrated by a sustained rally. In terms of support, the 50 DMA may be acting as a kind of general support level around 1300 and this matches the bottom Bollinger band. The January low at 1280 may also be significant support in the event the market sells off early this week.
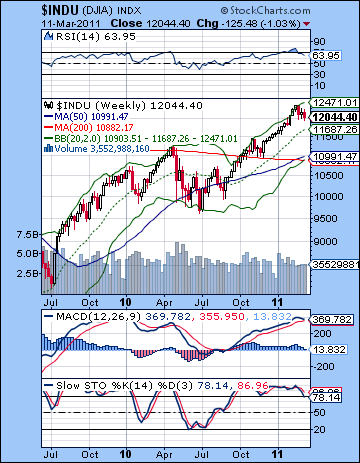
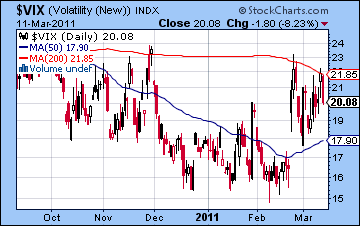
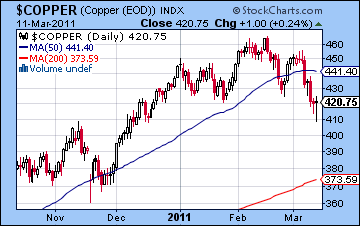
The momentum indicators are weakening here as the MACD for the SPX is still in a bearish crossover. If the market reverses this week, it will attempt to duplicate November’s shallow correction by moving higher before crossing over the zero MACD line. This may be what many bulls have in mind who are intent on buying the dips. It’s worth noting that the November correction also tested the 50 DMA much as we have seen over this past week. Stochastics (26) are edging closer to the 20 line before the probability of a reversal higher increases. We may be getting close to another rally attempt. RSI (47) appears to be making a series of lower lows here. Even a small bounce higher would not change that pattern. The weekly Dow chart is showing more signs of erosion as Stochastics (78) have fallen below the 80 line and MACD is in the beginnings of a bearish crossover. Key support here remains at 10,900 which is equivalent to about 1177 — the same place as the rising trendline from July. If we get a decent correction here, that area will be the site of a major battle between bulls and bears. Predictably enough, the $VIX rose last week but it could not cross the 200 DMA. Broken wedge or not, as long as the VIX stays under wraps here below this line, this pullback will not get any legs. On the other hand, the bearish case for a significant correction was bolstered by weakness in copper. Copper appears to be forming a bearish head and shoulders pattern and pierced the neckline on Thursday. With all the bad economic news out of China last week, copper may be about breakdown further. As a leading indicator of economic activity, this is a very significant bearish development for stocks.
 This week features a very high number of aspects, both bullish and bearish. To complicate matters, some of them overlap in time so it reduces their reliability to deliver results on cue. Monday offers a good chance for a down day as the Mars-Saturn aspect is exact in the morning near the open. Venus is closely involved in this configuration so that somewhat reduces the reliability of a negative outcome, although I would still expect a down day Monday. The open may well be more negative than the close, however, and we could revisit 1290. Tuesday looks significantly better with the approach of the Mercury-Jupiter conjunction. Here, too, we can see that it’s perhaps a little less reliably bullish that it should be due to the approaching Saturn opposition. Nonetheless, the most likely outcome is an up day (70/30?). Wednesday could see a carry-over of enthusiasm for stocks that may generate a positive opening but this seems less reliably positive than Tuesday. The Moon-Venus opposition towards the close could help boost sentiment but I’m unsure where the market ends up here. The end of the week looks more bearish as Mercury opposes Saturn on Thursday and especially Friday. Friday is perhaps the more negative day here and there is a very good chance for a net negative outcome for Thursday and Friday. So a bullish scenario here might see only a moderate decline Monday or even an intraday reversal higher followed by strength into Wednesday that takes the SPX to 1320 or perhaps a little higher. This would test the wedge resistance from the underside. After falling back, Friday’s close would then be near current levels around 1300-1310. A more bearish scenario (which I think it somewhat more likely) would see 1290 or lower on Monday followed by a rally back to 1310 by Wednesday and then a selloff into the end of the week, say back towards 1290 by Friday, perhaps lower.
 Next week (Mar 21-25) may begin on a positive note as the Sun conjoins Uranus. There is a brief absence of any close aspects afterward, so we could well see the market track a little sideways or move higher. Since I am expecting a pullback in oil near this time, some upward movement in stocks would make some sense. This could well represent another (failed) rally attempt to recover the wedge resistance level, although I suspect it won’t achieve that. The following week (Mar 28-Apr 1) looks very bearish indeed as the Jupiter-Saturn opposition is exact on Monday at the same time that Mars forms a square aspect with disruptive Rahu. There is quite a bit of downside potential in these aspects so I would expect some broken support levels. April looks volatile in the literal sense as there will be a number of bearish aspects formed with Saturn followed soon after by bullish aspects with Jupiter. This is the result of the close proximity of their opposition aspect. The lynch pin in this respect is the Mercury-Mars-Saturn configuration around April 22 that is likely to be quite bearish and may form a significant interim low. Whether it is the low for this corrective move remains to be seen. While I wouldn’t rule out a higher low at this time, it does look quite negative. As Jupiter enters Aries in May and we should see a significant rally attempt begin then. At this point, it looks like it will continue into July. August and September look more bearish again, so that period will mark the next leg down. Again, I cannot say if July will be a higher high or lower high than 1344 on the SPX. The presence of QE2 or even QE3 means that technical patterns may be less important in determining the direction of the market. Certainly, if we only pullback to 1220 in April, then we could quite easily rally to a higher high by July. But a correction down to 1170 or lower, and the prospects for higher highs in the summer diminishes. In that sense, I think we should expect May-July rally of 20% at least regardless of where it starts from.
5-day outlook — bearish SPX 1290-1300
30-day outlook — bearish SPX 1200-1250
90-day outlook — bearish-neutral SPX 1250-1300
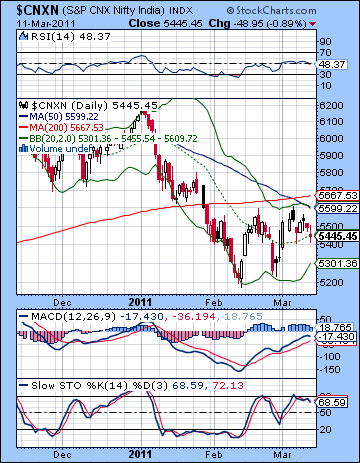 Stocks in Mumbai fell almost 2% last week as concerns over high oil prices and the growing risk of a global slowdown offset some positive industrial output data. Despite rising above 18,500 by midweek, the Sensex slumped back to 18,174 by Friday with the Nifty finishing the week at 5445. This bearish outcome was largely in keeping with expectations as the market remains under the influence of Saturn. The intraweek movements also mimicked the shifting planetary aspects fairly closely. As expected, Monday’s decline coincided with the Sun-Moon-Saturn pattern while the midweek rise arrived more or less on schedule with the Mercury-Uranus conjunction on Wednesday. I suggested that Thursday and Friday were less bullish and there was an increased probability for declines and that is what we got as the market fell on both days. Friday’s somewhat larger loss coincided nicely with the approaching Mars-Saturn aspect.
Saturn’s influence is growing here as it approaches its exact opposition aspect with Jupiter on 29 March. As oil prices stay high on the turmoil in the Middle East, there is growing talk not just of inflation but of recession and global growth prospects have suffered. What is interesting is how this shift closely reflects the movement of the planets. At the end of 2010 and the beginning of 2011, most observers focused on inflation of commodity prices and assets. This was at a time when Jupiter (expansion, optimism) conjoined Uranus (risk, change) and most stock markets around the world climbed higher. Once the conjunction occurred on 4 January 2011, emerging markets such as India’s began to falter. This was a manifestation of the weakening of the inflation pairing of Jupiter and Uranus. In recent weeks Jupiter has moved out of range of Uranus and towards the pessimism of Saturn. This has not only correlated with a decline in some stock markets, but in a more general sense it has shifted the debate away from inflation towards recession. Of course, inflation generally isn’t positive for growth but in its early stages, it can be reconciled with a more optimistic view of the future. In its later stages, however, the corrosive effects of inflation move into focus. That is what we are likely seeing now as Saturn’s orientation towards restraint and contraction have pushed investors towards seeing the glass as ‘half-empty’. Inflation from high oil prices and QE2-driven fast money is still a problem, of course, but now it is within a broader context of a slowdown in growth. The prevailing bearish influence of Saturn here is likely to persist until the exact aspect on 29 March and will likely linger for several more weeks afterward as there will be a parade of other planets coming under Saturn’s influence. For this reason, stocks are likely to stay weak in the near term and should probe towards lower levels.
 From a technical perspective, the market looks quite weak here as the Nifty failed to reach its 50 and 200 DMA for the second time in as many weeks. There has clearly been a sea change in sentiment and any rallies are being sold once they venture towards any kind of obvious resistance level. Perhaps that ‘death cross’ of the 50 and 200 DMA is living up to its name after all. Nonetheless, the bullish case still rests on the double bottom in the Nifty and it is still very much in play. Friday’s close on the 20 DMA still allowed for the possibility of more upside although a close below 5400 would be very bad for this bullish double bottom scenario. 5400 is an important support level and a break below would increase the probability of a run down below 5300 as it did previously. Bulls may also try to buttress their case by noting that the MACD remains in bullish crossover and has lots of room to run on the upside. Bears would correctly counter by noting that MACD remains below the zero line and therefore is quite weak. It is just as likely to reverse lower once it gets to the zero line as move above it in any sustained bull move. Moreover, Stochastics (68) may well have peaked here and could be headed lower to the 20 line. Similarly, the RSI (48) shows a series of lower highs going back to January and it may be headed lower once again. Unless the Nifty can close above the 50 DMA at 5599, the market looks pretty bearish.
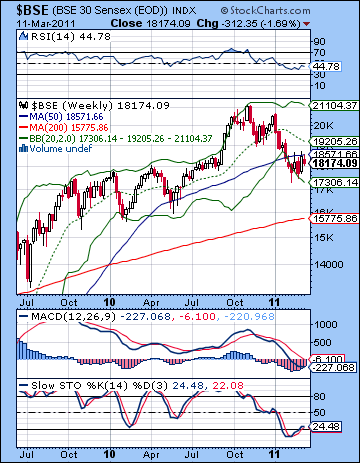
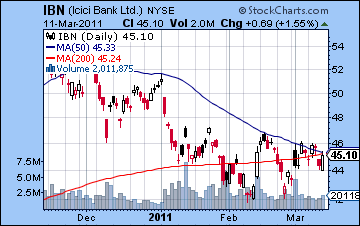
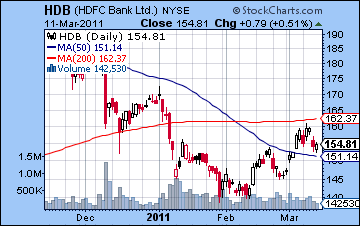
The weekly BSE chart is also quite weak as the 50 WMA at 18,571 is acting as pretty reliable resistance lately. Unless it can cross above that line, the market may be destined for lower prices in the near term. MACD is still in a bearish crossover and still below the zero line, while RSI (44) is turning slightly higher. However, since it never bottomed out at the 30 line, it still may yet do so. If the market does take another move lower, one wonders if the next stop on this chart will be the 200 WMA at 15,775. While that sounds somewhat extreme, it is definitely possible as long as it cannot penetrate 18,500 on the upside. The listlessness of the market is also reflected in the charts of individual stocks. ICICI Bank (IBN) failed again to climb above its 50 DMA, a sure sign of a very tentative investment environment. Admittedly, Tuesday and Wednesday did close slightly above this line, but it slipped back below it for the rest of the week. Bulls have to convincingly push prices above this line and keep them there for a meaningful rally to take hold. Thus far, it isn’t happening. Volume also remains fairly non-committal. HDFC Bank has advanced further off its recent bottom and is trading above its 50 DMA. This puts it in somewhat better shape than ICICI although it is still below its 200 DMA. It could take another run up to its 200 DMA in the short term, but a sustained rally would require some closing prices above its 200 DMA.
 This week looks like it will start quite negatively on the exact Mars-Saturn aspect on Monday. Benefic Venus is also part of this configuration so that may moderate some of the losses, although there is still probability of declines on Monday and perhaps even in to Tuesday. Monday does seem more bearish than Tuesday, however. As we move towards midweek, the positive effects of the Mercury-Jupiter conjunction will be felt. Since both of these planets are considered favourable influences, their combination usually brings gains. The conjunction is exact on Wednesday before the start of trading, so its effects may be spread out before and after. One possible scenario might be a negative open on Tuesday followed by improvement into the close that carries through to Wednesday. If Wednesday ends positive, then the end of the week looks less promising and there is a higher probability of declines as Mercury opposes Saturn on Friday. Overall, the mix of influences here suggests another bearish week upcoming. A somewhat more bullish scenario would see 5400 support level hold on Monday and then another rally back to 5600 by Wednesday. The late week sell-off would then see the Nifty fall back to current levels around 5450. The more probable bearish scenario would see a break of support of 5400 on Monday, perhaps down to 5300 before reversing higher going into Wednesday. Perhaps the Nifty will get back to 5500. The late week decline would then take the Nifty back below 5400 once again. I do think that there is a reasonable chance that we will break that 5400 support level this week at least once.
 Next week (Mar 21-25) may well begin favourably on the Sun-Uranus conjunction. This bullish start may well carry through most of the week as there are no clearly bearish aspects due during this week. Of course, after the Sun-Uranus conjunction, there are not any obviously bullish aspects either, but in this instance I think there may well be a bullish bias to the market, especially if we have seen a break down below 5400 in the preceding week. The following week (Mar 28-Apr 1) looks quite bearish, especially to begin the week. The Jupiter-Saturn aspect is exact on Monday and Tuesday, right at the same time as a very tense Mars-Rahu aspect. This combination of bearish aspects could coincide with a sizable decline. The end of the week looks more bullish, however, as Mercury turns retrograde. April does not look especially bullish and it may well produce new lows. While the worst of the Jupiter-Saturn aspect will be behind us by this time, there are still a number of difficult aspects to contend with. The pattern that stands out the most in this regard is the Mercury-Mars-Saturn alignment on 22 April. This is a very bearish set up that is likely to coincide with a significant down move. Whether or not it creates a lower low is an open question, however. If a significant low is likely in April as I believe it is, then we should see the market attempt a major new rally shortly thereafter. This could begin as late as May, however, although it should extend into July. I am expecting a lower high here, perhaps somewhere approaching 6000. August and September look more bearish so we should see another major correction develop for the second half of the year.
5-day outlook — bearish NIFTY 5300-5400
30-day outlook — bearish NIFTY 5000-5200
90-day outlook — bearish NIFTY 5000-5500
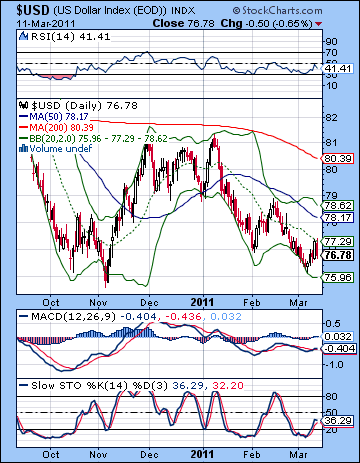 As stocks wavered last week, the Dollar got up off the mat and posted a modest rise on a flight to safety. This was a welcome and somewhat unexpected surprise as I had expected the Dollar might probe below the support trend line before rebounding later in the week. As it happened, the Dollar posted gains on Monday (as expected) but then managed to extend the advance all the way into Thursday. While this near-death experience has no doubt humbled many Dollar bulls (including me), the bounce here was very heartening and improves the technical situation substantially. The double bottom on the RSI (40) looks all the more bullish given the current cushion. Of course, bears may also properly claim that there is still a series of lower peaks on the RSI chart that have to be broken to the upside for the current rally to have much meaning. In that sense, RSI would have to get to 55 in order to break the pattern of descending lows. In any event, the double bottom at least introduces some measure of ambiguity into the conversation which had hitherto been missing as the short Dollar trade had become crowded. We can also spot a higher low in MACD similarly suggesting gathering strength in the Dollar. Stochastics (35) appear to be venturing higher towards the 80 line so there should be more upside here in the short term before it becomes overbought. For the rally to continue, the Dollar has to break above the declining trend line at 77 and stay here. This bounce off support therefore opens up the possibility of a longer rally. Whether or not the Dollar can finally break above 80 and the 200 DMA is perhaps the larger question now.
This week should continue this nascent upward trend in the Dollar. Monday’s Venus-Mars-Saturn pattern aligns with the ascendant of the USDX chart so that increases the likelihood of a significant move. I am unsure about the outcome here as a case could be made for both bullish and bearish moves. I am expecting stocks to fall here, so that generally improves the chances for a gain in the Dollar. However, it still somewhat ambiguous. The late week period could see some gains as the Mercury-Saturn opposition on Friday is likely to scare investors back into safer assets like the Dollar. More generally, Jupiter is moving towards a nice aspect in the USDX chart so that augurs fairly bullishly for further gains until early April. We could see some consolidation for a week or perhaps two after that — possibly around the 80 level — but the rally will likely resume by mid-April and extend well into May. I am not expecting an explosive move, but I would not be surprised to see the Dollar comfortably above 80 and making a run for 83 and the August 2010 high. This would equate to about 1.26 on the Eurodollar. That would be a conservative upside target. A correction is likely after that and we could see the Dollar drift lower again through the summer, bottoming out in August or early September somewhere between 76 and 80 perhaps. Then another major rally is likely with a bullish trend in place for most of Q4.
Dollar
5-day outlook — bullish
30-day outlook — bullish
90-day outlook — bullish
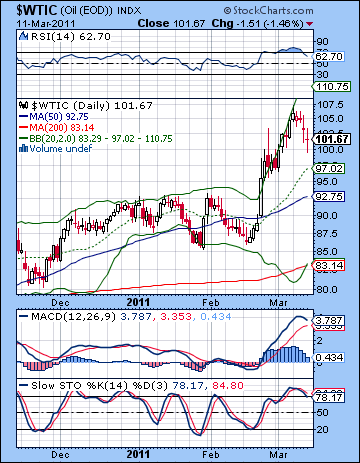 As the market began to discount the crisis in the Middle East, crude fell back down to Earth a bit, closing Friday near $101 on the continuous contract. While I largely expected the late week sell-off, I had expected a little more upside early in the week as an offset. We did see crude rise on Monday to as high as $107 intraday and then stay mostly flat near $105 through Wednesday and the Mercury-Uranus conjunction. While it briefly peaked at $107, crude oil futures did not make it much above the 61.8% Fibonacci retracement level at $104. This is therefore a potentially significant level of resistance going forward. If it breaks above this threshold, then the next Fib level of 78% would be around $120. In terms of support, $100 is an important psychological level that will reflect ongoing uncertainty in the Middle East and the prospect of the loss of Libya’s oil for the indefinite future. Below that, any price above $97 would maintain the integrity of the breakout rally. If crude should fall below $97, then it returns to a near-normal situation. The $97 level is perhaps more important now that it matches the 20 DMA. So has crude peaked? From a technical perspective, I would say it’s too soon to say with any confidence. There are certainly hints that it might have in the short term since RSI peaked around 80 and has fallen back below the 70 line. Of course, it could rise again in the event of another revolution or some other unexpected military situation in the region. MACD is still in a bullish crossover but the histograms are shrinking rapidly. These also do not provide much useful information in the current unstable climate. Price is probably a better guide at this point. A new high above $107 would be bullish and would increase the likelihood of a rally towards $120. Similarly, a close below $100 would be bearish and a close below $97 would be very bearish and might signal that we are returning to the previous range of $80-92.
This week should be quite an eventful one in the oil market. Monday’s Mars-Saturn aspect looks like it might boost prices again and this could last into Tuesday. There are confirming bullish hits in the Futures horoscope so that increases the likelihood that we will see more upside at some point between Monday and perhaps Wednesday. That said, there is some ambiguity in the aspects since they are at cross-purposes. Monday’s Mars-Saturn aspect should be good for crude since it will likely correspond with supply disruption fears. On the other hand, Tuesday’s Mercury-Jupiter conjunction should also be good for crude but on grounds of increased production demands from optimism of a growing economy. Perhaps crude will rise on both days. Whether or not crude can push above $107 is uncertain. I would tend to think this extremely bullish scenario unlikely, so perhaps crude will only recapture the $105-106 level. The end of the week looks more bearish, although perhaps not hugely so. So crude may well stay above $100 this week, and there’s a reasonable chance that it will move somewhat higher. Next week (Mar 21-25) may see more downside, although how much is unclear. There is a reasonable chance that crude will trade below $100 at this time. The last week of March and early April will likely see another rally attempt, however, so that may retest the recent highs, wherever they may be. I expect prices should moderate through April, although it may be a bumpy ride. The second half of April and May will likely coincide with substantially bearish moves for crude. By late May, prices may well test $80 once again.
5-day outlook — neutral-bullish
30-day outlook — bearish
90-day outlook — bearish
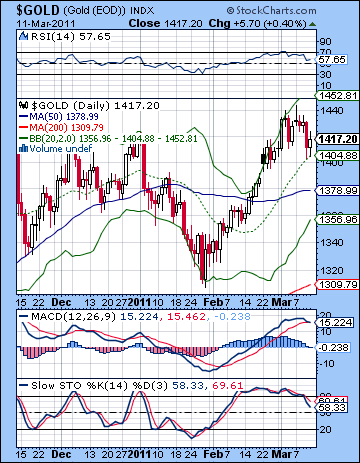 Gold drifted lower last week as the US Dollar came back to life on Eurozone debt concerns. After climbing in Monday’s session above $1440, gold finished at $1417 on the continuous contact. I thought we might see more upside here, and while Monday was higher as expected, the midweek period ended up more negative. Friday was bullish as forecast, however, although this was not enough to reverse the market direction for the week. Friday’s bounce off the 20 DMA suggested more upward momentum in the near term although the technical indicators look fairly mixed. RSI (57) has already come down from overbought levels so that slightly increases the appeal of the bearish view. More bearishly, however, is that MACD is on the verge of a bearish crossover. And we can still see a negative divergence with respect to the October high. Stochastics (58) have come off their overbought area and seem to be headed towards the 20 line. Resistance is likely around the $1430 level, with $1500 acting as a medium term resistance level in the event of another breakout higher. Gold appears to be rolling along here still in a solidly bullish up trend. The last time it tested the 200 DMA was way back in early 2009! From a medium term perspective, only a breakdown of the rising trend line could change the bullish sentiment around gold. Currently this trend line sits at $1350.
This week looks mixed for gold as Monday’s Venus-Mars-Saturn looks more bearish, although I do acknowledge a fair degree of ambivalence. Some gains are likely going into the midweek Mercury-Jupiter conjunction, however, although they seem unlikely to challenge any recent resistance levels. The end of the week looks more bearish again as Mercury opposes Saturn. Just where gold ends up this week is hard to say, although I tend to think it will stay above $1400 although it probably won’t reach $1430. That would be my best guess. Next week looks more bearish as Venus comes under the aspect of Ketu. While it seems unlikely that gold will spike towards $1500 over the next few weeks, the most prudent scenario is to expect continued strength over $1400 at least until early April. But generally I would be fairly bearish on gold in the medium term, so I would not be surprised to see gold make lower highs in the near term. That means that we may have to wait until mid-April to see much significant downward momentum in gold so that it might challenge its 50 DMA ($1380) and that rising trendline around $1350, although by then it may be closer to $1370. So April may be the most likely time when that trend line is tested and broken on the downside. May is likely to see more downside. I had previously suggested that $1000 was possible. I’m less inclined to think that now, if only because there may not be enough time between now and the end of May and we have that much further to fall. The 200 DMA at $1300 may make a more doable target, although I suspect we will probe lower than that.
5-day outlook — bearish-neutral
30-day outlook — bearish
90-day outlook — bearish

