- Stocks possibly spiking higher early with likelihood of declines later on Mercury-Saturn
- Dollar should strengthen towards end of the week
- Gold likely to continue decline after short rise
- Crude higher early but susceptible to selling later
- Stocks possibly spiking higher early with likelihood of declines later on Mercury-Saturn
- Dollar should strengthen towards end of the week
- Gold likely to continue decline after short rise
- Crude higher early but susceptible to selling later
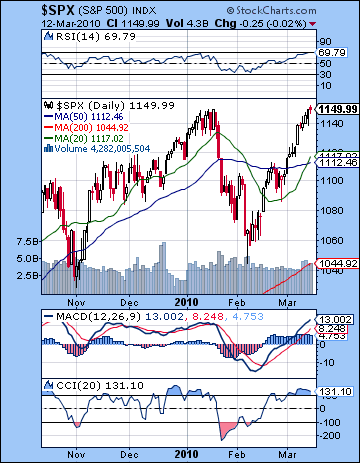 Despite trading in a narrow range, stocks edged higher last week as investors found enough positive economic news to keep them in the game. The S&P gained 1% as it matched its January high closing at 1149 while the Dow finished at 10,624. This was a disappointing result given my bearish forecast for the Venus-Saturn opposition on Monday. Certainly, Monday was the worst day of the week but the market only pulled back fractionally. While I had mentioned the possibility that declines may be modest, that outcome offered little consolation as the market rebounded and erased the losses of the recent correction. We may also note that the intraweek dynamics were more or less as forecast as the larger gains arrived later in the week with Thursday being the most positive. But volatility was much less than expected, as sign perhaps that the Jupiter influence of the past few weeks was not quite ready to yield to Saturn, even with the bearish prospects offered by the Venus-Saturn aspect. The default bullishness appears to be coming from the proximity of the faster moving planets (Sun, Mercury and Venus) to Jupiter and Uranus, both bullish planets. Last week saw the shifting of one those planets, Venus, out of the bullish orbit of Jupiter-Uranus into the Saturn camp but it was not enough to fundamentally shift market sentiment. As I noted last week, the residual bullishness from the Sun-Mercury-Jupiter-Uranus cluster could well be enough to "mitigate the worst of the Saturn negativity" and that is indeed what has transpired here. With many of the major indexes matching or exceeding the January highs, the oft-cited Saturn retrograde correction has largely been neutralized. It is worth noting, however, that neither the Dow nor the wider NYSE Composite made new highs, so one can still fashion some kind of argument that the key planetary signature of the January highs remains a viable reference point.
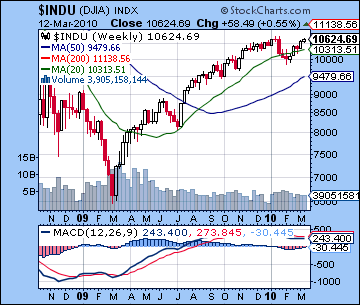
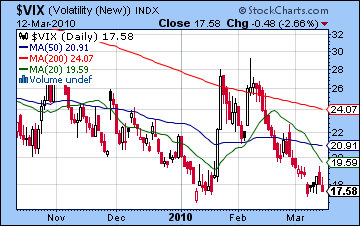
With the prospect of a bearish double top pattern, the technical signals here are seemingly caught betwixt and between. The new highs on the Nasdaq and Russell 2000 offer fresh meat to bulls that could conjure up visions of better days ahead. But the S&P only matched its January highs and therefore should be treated with more caution. Obviously, bulls can focus on the fact that the correction was completely erased as the market is poised to move higher. And volume showed a bullish increase last week, another sign that perhaps there is more enthusiasm going forward. However, bears can properly counter that the slightly higher volume was still less than the down volume in the midst of the correction in late January. Daily MACD on the S&P is still in a bullish crossover, and even slightly exceeds the levels corresponding with the January high. RSI (69) is poised to go into the overbought zone and should be seen as bullish, however, we should note that RSI has bounced off of 70 on several previous occasions during the second phase of this hope rally. This is therefore an indication that any up move may not have much more room to grow. CCI (131) is also strongly bullish and one would not want to bet against this chart unless it broke below 100. The critical weekly MACD in the Dow chart is still in a bearish crossover and is a more reliable indicator of caution in the market. While the size of the crossover is shrinking, one should not get too enthusiastic about another move higher unless we see the crossover end. It’s conceivable that the weekly MACD could stay negative even as the Dow edges slowly higher for many more weeks, but there are other technical factors that suggest this is unlikely. For example, the $VIX now stands at 17.66 and forms a bullish double bottom. Of course, it could continue to fall from here but that seems quite unlikely since 18-20 is near the historic low point for this measurement. So the overall technical picture seems mixed at best in the medium term, although we should not preclude further rises in the (very) short term. In terms of resistance, all eyes will be on the Dow and whether it can eclipse its January highs around 10,767. It may well do it, although we should be wary of a "fake-up", that is an apparent breakout to the upside that lasts only a day or less before reversing sharply lower. In terms of support, I would focus on 1110-1120 initially as this coincides with both the 20 and 50 DMA. After that, the 200 DMA around 1044 could be significant although this may now have to wait until next week or most likely into April. This level is perhaps doubly important because it roughly coincides with the previous February low and is only a little higher than the November low of 1030. I am not ruling out a move down below SPX 1000 in April but it does seem less likely given the recent run-up.
New data out this week show that institutional fund managers have the lowest levels of cash on record. Actually, the current level is tied with the level achieved in the fall of 2007 when stocks hit their all-time highs. This is a very bearish medium term influence that suggests that this market is running out of buyers. Everyone who can buy has bought already and everybody else is either too broke or too bearish and refuses to be lured in. As strong as the outperforming Nasdaq has been lately, it is running up against its long term resistance line that dates back to March 2000 when it made its all-time high. A bullish breakout would only be indicated if it closes significantly above 2400-2450. On Friday its intraday high was 2376. If it bounces off this level, it could herald another move down. The bond market has so far refused to confirm any imminent turns in equities as the long bond fell again last week, closing below 117 on the $USB index. I had been more bullish here but bonds may first have to slip a bit further and form a more solid bottom before they can head higher. 115 would be a more credible level for this to occur since it would match the January lows although the February low of 116 could also be a sufficient base from which a bond rally could build. We should therefore see the 30 year treasury fall a little further this week and rally thereafter into April.
 This week features two key planetary patterns, one probably bullish and one probably bearish. The key bullish influence will likely be the Sun-Mercury-Uranus conjunction that occurs from Sunday until Wednesday morning. Actually, the Sun conjoins Mercury on Sunday in the last degree of Aquarius, and then the faster moving Mercury hits Uranus on Monday afternoon, followed by the Sun-Uranus conjunction on Tuesday evening. The net effect of this Uranian influence should be positive in the early going, although I would attach an important caveat. The Sun-Mercury conjunction on Sunday may siphon off some of the positive energy when the market is still closed so it’s unclear how much upside we can expect on Monday and Tuesday. To be honest, I would not rule out a down day Monday or at least a weakening trend at the close. Monday’s importance is underlined by the New Moon that will occur then. New Moons are sometimes (but not always) signals of trend reversals so if the market is higher by midday, it’s possible that could be the high for the week. Tuesday also holds out a reasonable chance for a gain as the Sun conjoins Uranus and the Moon approaches Venus. The afternoon is likely to be stronger than the morning. If the market has managed to rise early in the week, then Wednesday looks decidedly more bearish as both Sun and Mercury have moved past Uranus and will approach their respective aspects with pessimistic Saturn. The Mercury-Saturn opposition will peak across both Wednesday and Thursday so a decline is likely on at least one of those days and the market should be net negative there. Thursday afternoon looks especially negative as the Moon will form an alignment with Mercury and Saturn. Like last week, there is a higher than normal potential for a large (>2%) decline on this aspect. Let’s see the extent to which Saturn has replaced Jupiter as the the difference maker in this market. Friday also leans towards bearishness given the Sun’s approach to its Saturn aspect but it is still out of range somewhat so this seems like a less reliable down day. Also the Moon forms a nice, if fleeting, aspect with Venus and Jupiter in the afternoon. Overall, there is a good chance for a lower week here, even if we see gains early on. I would expect the declines to outweigh the gains here although perhaps not by a lot. And we will likely finish above the 50 DMA of 1110.
 Next week (March 22-26) begins with the Sun just past its opposition with Saturn and forming a larger alignment with Mars. This is likely to coincide with a decline in the early week. I would expect some recovery to begin by Wednesday at the latest as Mercury forms a minor aspect with Jupiter. By Friday, Venus enters Aries and will approach its aspect with Uranus and Neptune so that should offer some support for prices then. While declines are likely this week, there is significant upside potential to suggest a mixed week albeit with a bearish bias. If we have started another move down beforehand, then this week is likely to extend the losses. The following week (Mar 29 – Apr 2) looks more bearish again especially towards the end of the week as both Mercury and Venus move into square aspect with Mars and part of a larger alignment involving Saturn. This has the makings of a significant percentage move down, perhaps on the scale of something we could see this week on the Mercury-Saturn opposition. After that, prices should trend lower until mid-April with recovery more likely to occur when Venus and Mercury form aspects with Jupiter. At that time, Jupiter will be seven degrees from its conjunction with Uranus so that may be enough to power any rebound rally after we are done with the correction. Jupiter will finally conjoin Uranus on June 8 so that rough time period may correspond with a loss of optimism for equities. This is not to say that stocks will go straight up from mid-April to early June, but the presence of this Jupiter-Uranus influence should at least be enough to offset any sell-offs. And of course, the market may drift higher still, perhaps to SPX 1250. Whether it does remains an open question, although a shallow pullback into April would certainly increase the likelihood of this higher high. I am still generally bearish for the summer period with late July being the last possible date for relatively high prices before the Mars-Saturn conjunction. The fall period is still looking to be worse.
5-day outlook — bearish SPX 1110-1140
30-day outlook — bearish SPX 1000-1050
90-day outlook — neutral-bullish SPX 1100-1200
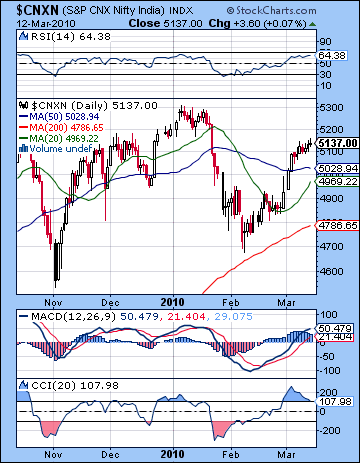 Stocks in Mumbai crept higher last week as continuing demand from foreign investors offset inflation concerns and any possible rate hike. The Sensex finished the week up 1% at 17,166 while the Nifty ended at 5137. This bullish outcome was somewhat disappointing in light of my bearish forecast last week. I had expected more negativity from the early week Venus-Saturn aspect but the bulls reasserted control of the market from Wednesday on. Certainly, I correctly identified Tuesday as the most bearish day and that day saw the market post its only losing session on the week. However, Wednesday was not bearish as expected and instead posted a gain, a possible expression of the relative proximity of Sun and Mercury in between benefics Jupiter and Uranus. Thursday was also positive, especially towards the close as forecast with Friday ending mostly flat after a promising open. Overall, the end of the week was somewhat more positive as expected although the absence of any significant down day meant that the markets performed better than forecast. While I had not ruled out 5150 on Monday, I had expected the rebound to top out around 5100 at the most. In any event, this was the first opportunity for Saturn to wrestle control of market sentiment away from Jupiter. Thus far, Jupiter clearly has some staying power here although it is not entirely unexpected since both the Sun and Mercury were still under the twin influence of Jupiter and Uranus. The loss of one of the planets to Saturn was insufficient to radically change the celestial equation but it does not yet nullify the potential for correction here. That’s because once Sun and Mercury move past both Jupiter and Uranus and come under the influence of Saturn this week, we will have a better measure of the potential shift in market sentiment.
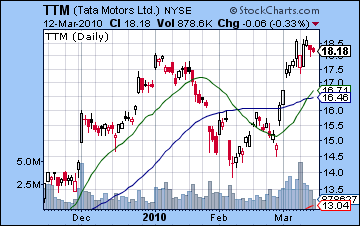
Despite the gain, we did not see a significant change in the technical indicators. On the bullish side, Nifty prices did move above the 20 and 50 DMA which was something of a minor achievement. Both moving averages have stopped falling and may in fact crossover this week if there are further gains. RSI (64) is still quite bullish but it may be in danger of topping out in the near term. Daily MACD is also still in a bullish crossover and is only a little below its level at the time of the January high. CCI (125) is falling but it remains above the crucial 100 level, a bullish signal. Another bullish indicator can be found in the US chart of Tata Motors (TTM). It reached a new high for the year last week and its chart is marked by a positive crossover of the 20 and 50 DMA. One possible area of weakness, however, is that the volume spike last week occurred on a down day. This is generally not a bullish signal since new highs are best made with volume increases. Overall, however, prices on the Nifty may be trending upward towards the rising support line from the July lows. This line is currently around 5200-5250 and it should become fairly strong resistance in the event of any further rally attempts here. Of course, the previous high of 5300 is an additional obstacle for the bulls to contemplate as the wall of worry will be very steep indeed between here and there. Weekly MACD on the Sensex was in a bearish crossover for the 20th straight week and it will take a major breakout higher for this trend to be reversed. Bears should therefore take some comfort in the medium term outlook as long as no new highs are made. Support is likely found in some measure around the 50 DMA at 5000-5050 and below that the 200 DMA at 4750 may attract new buyers. The importance of this level is reinforced by the fact that it coincides with the February low. Bulls would tend to become more anxious if prices fell below 4750 since it would constitute a lower low and cast serious doubts on the longer term rally. More immediately, bulls could easily withstand a down day or two with modest declines but may grow increasingly nervous with a close below 5000.
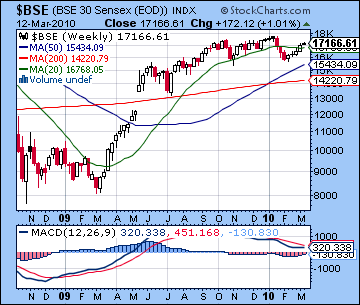 This week will have two main influences, one positive and one negative. On Sunday, the Sun conjoins Mercury in close proximity to Uranus. On Monday this happy threesome will likely move prices higher as Mercury will form its exact aspect after the end of trading. The Sun will follow along shortly thereafter and conjoin Uranus on Wednesday afternoon. Generally, this should translate into a bullish start to the week although I would not expect gains on all three days. Monday is probably the best bet for gains as the Moon approaches the Sun in advance of the New Moon. Tuesday is more difficult to call since the Moon will oppose Saturn in the afternoon and may indicate a weak close. Wednesday coincides with the Moon-Venus conjunction in Pisces which may provide a boost for prices in the morning. Some weakening by the close makes this day more difficult and it could well finish in the red. Thursday will feature our other main focus, the Mercury-Saturn opposition. This is replay of last week’s Venus-Saturn opposition. It seems more likely to deliver a decline if only because it will represent the second out of three planets to go over to Saturn’s "dark side". Friday also seems bearish although perhaps less so that Thursday. The Sun approaches its own opposition with Saturn then, but it is still two degrees away from exact so it may not quite pack the same punch as Mercury’s the day before. But overall, the early week seems more conducive to gains with the possibility of declines increasing as the week progresses. I would not rule out a run up to 5250 by Wednesday but given the probability for losses later in the week, there is a good chance we will finish lower.
 Next week (March 22-26) will likely begin bearishly as the Sun opposes Saturn and forms a minor aspect with temperamental Mars. This could be a very negative day and is likely to push prices lower still. Some rebound is likely by Thursday on the Mercury-Jupiter aspect but the overall effect of the week should be lower, possibly testing 5000. The following week (March 29 – April 2) may begin fairly bullishly but the selling will likely return towards the end of the week on minor aspects between Mercury, Venus and Saturn. Weakness is likely to prevail until about mid-April when Mercury and Venus form minor aspects with Jupiter. After that time, Jupiter will begin to approach its conjunction with Uranus and this may offer some support to the market. The exact conjunction takes place June 8 so that may introduce a floor under the market until that time, and at this point it seems likely that the market will rally into June after making its lows in April. We may see a slow erosion of prices as we move into July with sharper declines more likely into August and into the fall period. It is difficult to say if the highs of June and July might be higher than current levels. Certainly, it is quite possible.
5-day outlook — bearish-neutral NIFTY 5050-5200
30-day outlook — bearish NIFTY 4500-4700
90-day outlook — neutral-bullish 5000-5500
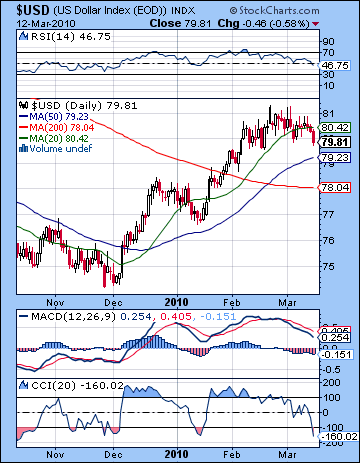 With the Euro staging a modest recovery as Greece slipped off the front pages, the dollar finally came under greater headwinds last week closing below 80 for the first time in a month. I had been more bullish here mostly on the early week Venus-Saturn pattern which I thought might have generated more risk aversion. As it happened, early week gains were very modest and the losses started to accumulate after midweek. This coincided with the Mars Direct station in close aspect to the ascendant in the USDX chart. While I had noted the possible bearish effects of this aspect last week, I expected more upside from the Jupiter-Moon conjunction. Overall, the decline was likely overdue as I had wondered if we might see a test of the 50 DMA at some point. This could well happen this week since the Dollar is only half a cent above that level (79.2). We should also note that the current price (79.8) sits atop the rising support line off the December lows so if this line is broken, it might send prices lower, perhaps even falling through a less reliable support like the 50 DMA. Daily MACD is still bearish, as is CCI (-160). RSI (46) has also fallen into bearish territory and is at the same level of the January correction. Further downside here could accelerate selling since some technically inclined investors would see this RSI support failing. Weekly MACD is still in a bullish crossover, however, a sign of medium term strength. Resistance is still above the 81 level, so we should watch for the strength of any rallies here to see how easily they can get to 82. My sense is we will see 82 before too long, perhaps in early April. This week there will be quite a bit of attention paid to whether this rising support line will hold. It’s possible we could see a "fake-down" for a day or two before it reverses higher. Therefore, I would not take a single day’s close below 79.5 as indicative of some kind of larger sell-off.
This week we will see the extent to which transiting Jupiter can boost the Dollar’s fortunes. Jupiter is conjunct the Moon and in close aspect to both Venus and Mercury in the natal chart. If this were the only close aspect at work here, a strong rally would be probable. As noted above, however, Mars is currently sitting close to its own negative aspect to the ascendant and that may create a temporary drag on prices. It may have already manifested with the decline late last week but I would not be surprised to see more downside here for another day or two on the Sun-Mercury-Uranus conjunction. Some recovery is more likely as the week progresses as risk aversion will likely rise with the Sun and Mercury opposing Saturn. Thursday and Friday look like the most bullish days of the week. Overall, there is a good chance the greenback will finish higher but that is not certain. I expect further gains to accrue as we move into April with 83 still possible before another correction ensues. At this point, I would expect to see the Dollar follow a bullish pattern of generally higher highs and higher lows so the pullback we could see in May is unlikely to break below the March low.
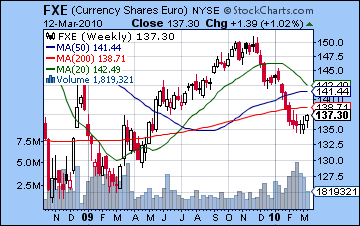 The Euro finally felt some air beneath its wings as it climbed decisively above 1.37 on improved prospects of a Greek bailout. While I had expected some kind of rally to this level at some point, I had been more immediately bearish last week. Most puzzling was the inability of the Venus-Saturn aspect to take it much lower. The decline was quite small indeed, although we did see the expected recovery later in the week as both Sun-Mercury conjoined the natal Jupiter in the Euro chart. Technically, the Euro is sitting on the falling resistance line (the mirror image of the Dollar) dating back to its December top. It may be difficult for it to push much higher and I would think 1.38 might be as high as it goes at this point before profit takers move in and send it lower again. Weekly MACD is still quite bearish and speaks to its longer term difficulty. This week could see a move higher in the early going as the Sun-Mercury conjunction activates the natal Moon. But the key aspect this week will be the late week Mercury-Saturn opposition which will set up on the ascendant much like the Venus-Saturn aspect did last week. If this aspect fizzles and does not produce much decline, it would suggest greater support for the Euro going forward. But I think it will produce more in the way of declines and we should see the Euro lower overall. Saturn crossing the ascendant is not a good influence and indicates that more tough days are ahead in the coming weeks. The Rupee held its own last week closing unchanged at 45.5. We should expect some weakening here as a move to 47 by April is very possible.
Dollar
5-day outlook — neutral-bullish
30-day outlook — bullish
90-day outlook — bullish
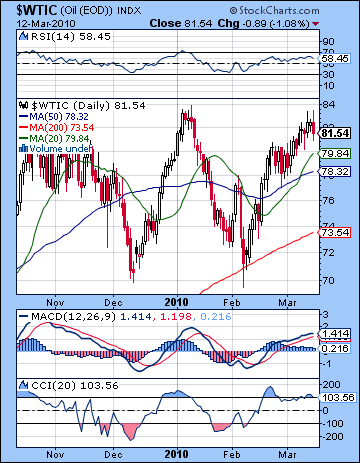 Crude oil moved slightly lower last week closing at $81.54 on the continuous contract. I had been more bearish here on the expectation that Tuesday’s Venus-Saturn aspect would deliver more selling. Crude fell to $80 at that time but then bounced right back, trading over $83 on two separate days. Wednesday was positive as forecast but Friday’s loss was surprising given the Sun’s strong position high in the Futures chart. Bulls can take some comfort in the rise that matched the previous January high, although unless this resistance is broken, it will be difficult to believe that the rally in crude is for real. Daily MACD is in a bullish crossover, although momentum appears to be fading. We can also detect a negative divergence with respect to the previous high. The 20 DMA has crossed over the 50 DMA which is another sign of strong momentum. Despite Friday’s large decline, CCI (103) is still bullish as is RSI (58) and it, too, displays a negative divergence with its January high. On a weekly basis, MACD has now risen to match the trigger line. This should be seen as a neutral indication since it may only be rising to that line as a prelude to bigger drops down in the near future. If it crosses over above it and can hold it for a week or two, then that makes a more convincing case for a medium term bullishness of crude oil. Resistance has been simplified to consist of the previous top of $83-84, but support is more of an open question. The rising trendline off the February intraday lows was broken on Friday, an indication that some kind of pullback was in the cards. The 50 DMA around $78 is the next level of possible support and there is a good chance will be see that tested soon. If we see a correction take hold here, then the 200 DMA around $73 would be tested next.
This week looks mixed as the early week period is dominated by the Sun-Mercury-Uranus conjunction high in the Futures chart. And with transiting Venus coming under the aspect of natal Jupiter around the same time, the chances of another rise are good. By Thursday, sentiment will likely have shifted to the bears as Mercury lines up against Saturn. This aspect does not activate any obvious point in the Futures chart, so it’s conceivable that declines may be modest. Nonetheless, the most likely outcome is for declines to push out any previous gains here. I would therefore expect the week to be negative overall. Generally, the price should trend lower until about mid-April although I do not expect a big correction here. I would not be surprised if prices only fell back to $70, for example. The period from April to June offers the prospect of widely diverging fortunes with the Saturn-Uranus opposition close to the natal Rahu looking very bearish but the Jupiter-Uranus conjunction near to the top of the chart is no less indicative of the opposite outcome. It’s possible that we will see prices move in a fairly narrow range as a result of this combination of factors.
5-day outlook — bearish
30-day outlook — bearish
90-day outlook — neutral-bullish
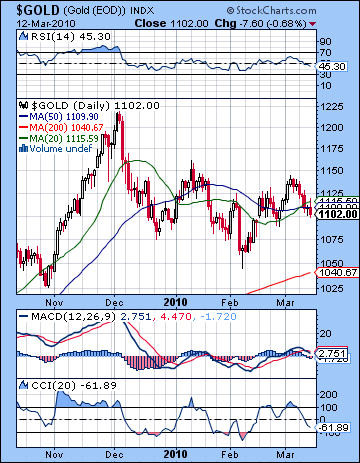 Gold declined 3% last week and closed at $1102 on the continuous contract. The Venus-Saturn aspect caused more pain to gold than any other asset class, another reminder that afflictions to Venus will often translate into trouble for the price of gold. Gold fell Monday as Venus approached Saturn and was mostly negative through the week with the small exception of Thursday when it was flat. While I had correctly forecast this early week selling, I had expected more of a bounce later on. In this regard, Friday’s loss was particularly surprising. The technical situation was already looking iffy and now looks that much more precarious. Last week’s pullback confirms gold’s inability to break above previous highs of $1150-1160 and therefore cast a bearish interpretation on price action: a series of lower highs and potentially lower lows. Friday’s close was close to the 50 DMA and this may be seen as soft support. Daily MACD is now begun a bearish crossover while CCI (-61) appears to be headed to bearish territory. RSI (45) is eroding also and may test its recent lows around 35-37. The weekly MACD is still in a negative crossover so that generally indicates an unstable price foundation for investors looking to commit new money. Not only did gold fail to match its previous highs last week, it also broke below its rising support line from its February lows. This support line may now offer significant resistance in the event of any future rally attempts. More meaningful support may occur around the 200 DMA ($1040), which also roughly coincides the previous February low. A new pullback that tests this level will be crucially important for gold. If it holds and rebounds higher, then the full-blown bearish scenario of a trend of lower lows will be averted. If gold breaks below $1040, however, then the game may be over for gold bulls since we will have a situation of not only lower highs but also lower lows. I am cautious about the prospects for this worse case bearish scenario in the short term, although it does seem that we are looking at a distinctly bearish trend for the next month or so.
This week looks mixed with large price swings possible in both directions. The early week period may be more bullish as the Sun conjoins Mercury Sunday and then Uranus by Wednesday. I would not be surprised to see gold trade above $1120 on Monday or Tuesday. After that, I think the picture gets murkier for gold with Thursday’s Mercury-Saturn aspect increasing selling pressure. Mars is also barely moving at the moment as a result of last week’s direct station and it is placed very close to a vulnerable place, the 8th house cusp, in the GLD ETF chart so this is another potential source of bearishness. Overall, gold could finish at or below current levels this week. Next week looks more mixed with selling very likely on Monday as Sun opposes Saturn but some rebound is likely later on in the week. Another potentially serious round of selling is likely in late March and into early April as Venus is square Mars. If the bottom is going to drop out of gold, this is the most likely time. I would therefore expect the largest percentage decline to occur at some point between March 29 and April 9, so we may see $1040 tested at that time. Gold should stabilize and rally after this low until May or perhaps even June. June looks like it will feature a significant correction, however, so it may begin another major down trend.
5-day outlook — bearish-neutral
30-day outlook — bearish
90-day outlook — bearish-neutral

