Summary for week of March 28 – April 1
Summary for week of March 28 – April 1
- Declines in stocks more likely this week, especially near Mars-Ketu aspect on Tuesday.
- Dollar likely to continue strengthening with possibility for large moves
- Crude may weaken overall this week although gains may be more likely midweek
- Gold somewhat vulnerable to declines this week and next
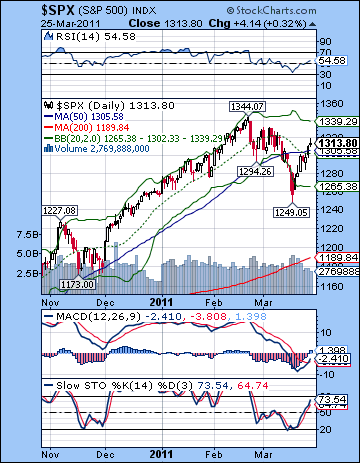 Stocks rallied back strongly last week as fears over Japanese crisis lessened and economic data continued to be positive. Rising four out of five sessions, the Dow gained more than 2% closing at 12,220 while the S&P500 finished at 1313. While I had expected we would likely get a bullish week on the Sun-Uranus conjunction, the relentlessness of this rally caught me a little by surprise. The day of the conjunction coincided nicely with a solid gain and then Tuesday saw a modest pullback in the aftermath. The bulls then took control after that, as the Venus-Ketu aspect coincided with further gains. I had thought it might be a better candidate for a decline or two, but this was not the case. I also acknowledged that the planets were fairly hard to read once we got the Sun-Uranus out of the way since the planets could be read either way. Friday was typical in this regard as the negativity of Mars entering Pisces appears to have been effectively countered by the approaching conjunction of Venus and Neptune.
While the extent of this post-Japan snapback rally has been surprising, it does not nullify the continuing bearish influence of the Jupiter-Saturn aspect that comes exact this week on March 28. As we know, Jupiter and Saturn are slow moving planets that exert their influence in the medium term. Their approach towards this opposition aspect has fit quite well with the correction we saw in late February and early March. But is it possible that this bearish energy is diminishing now that the exact aspect will occur this week? In other words, could this correction be over? Well, I hope not. Certainly, the bearish energy available from this aspect will gradually diminish over the coming weeks but it will still manifest whenever there is a triggering third planet. We didn’t have any trigger planets last week so that was one reason why we didn’t get any significant down moves. We will have a series of triggering planets forming aspects with this Jupiter-Saturn opposition in April, so that is why I still believe that the market is in a corrective phase. Rallies are possible, but they are unlikely to last. The most bullish scenario would appear to be a mostly sideways move into the next major bearish aspect which occurs in May between Jupiter and Rahu (North Lunar Node). Admittedly, there are fewer sources of worry for the market now that Japan’s crisis appears to be under control. Investors appear to have discounted a protracted civil war in Libya so the price of oil may not be a significant bearish influence either. Even a the prospect of a bailout of Portugal caused barely a ripple in equity markets. From a purely fundamental point of view — including QE2 — one has to be aware of the upside bias to this market and resist the temptation to think that it is all just a house of cards that is ripe for imminent collapse. While it is likely a house of cards, its collapse may only occur in stages. And from an astrological point of view, we can see that there is a reasonable probability for more volatility in the weeks ahead.
 If the fundamentals look mostly bullish, and the astrology looks bearish, the technicals definitely improved last week to the point where the bulls appear to have the upper hand. That is the real problem from the bearish point of view. While I thought we could well reach the 50 DMA at 1302, I never considered the possibility we would break above the falling line of resistance from the Feb 18 top. And yet that is exactly what the bulls have achieved as Friday’s gain pushed the SPX above 1310. For bears, this is a very worrying development since both the 50 DMA and the falling resistance line seemed to be fairly reliable obstacles in the event of any significant rally attempt. The next level of resistance seems less clear now, perhaps 1330 which is the penultimate top after 1344. Aside from the previous high, there isn’t a clear resistance line. The bulls can also note how the rising wedge has morphed into a rising channel as the March 16 low of 1249 created an almost perfect parallel channel off the 2010 lows. This pattern somewhat increases the likelihood that prices will continue to move higher towards the upper channel. Support from this rising channel is now around 1265 so that will have to be broken first if we are to see any larger down move.
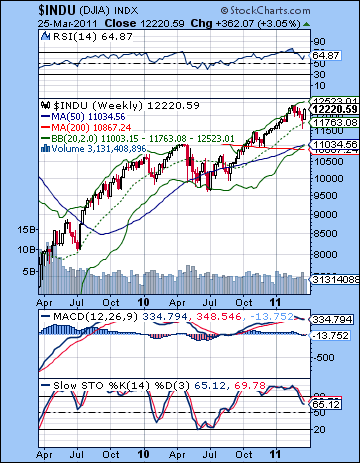
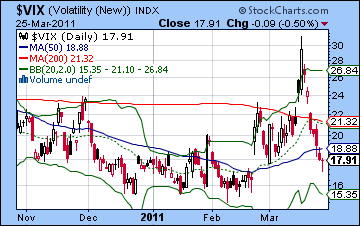
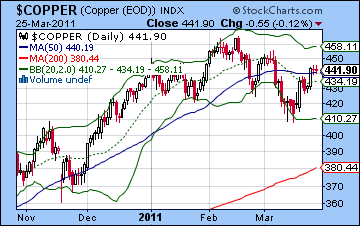
Even with last week’s rally, the bearish crossover of the 20 and 50 DMA is still intact around 1300-1305. This will likely act as support in the event of any down moves this week. MACD got a bullish crossover and is now rising towards the zero line. Stochastics (73) is also moving up towards the overbought area above the 80 line. Once it moves above 80, the market may become less appealing for bulls. The weekly Dow chart also looks more bullish here as price has bounced off the 20 WMA and is heading towards the upper Bollinger band line. MACD is still in a negative crossover, however, so that may require another positive week to reverse the medium term downward momentum. The $VIX plunged back down to earth last week and ended around 17. Interestingly, the Feb 22 gap at 17 was filled by Friday’s rally so this might give the bears a little more hope that we could get more downside in equities. Meanwhile, Dr. Copper is still quite strong here and closed Friday at 442 which was a bit above the 50 DMA. As long as copper stays at or above this level, it seems unlikely that equities will fall. And in keeping with the overall bullish tone of the market, treasury yield rose last week as the 10-year closed at 3.44%. This was right at the 50 DMA so this is another key technical signal that the market could be at an inflection point. If yields do not break above this level, then it would weaken the bullish case for stocks. Overall, the technical picture looks moderately bullish although several indicators could conceivably reverse quite rapidly. If they do, it would likely usher in another down move. As it is, however, the bullish technicals are somewhat divergent with the more bearish astrological indicators. In that sense, the situation is less clear than I would like.
 This week begins with the exact Jupiter-Saturn aspect that occurs after Monday’s close. This is a general and perhaps even background bearish influence will could depress the market, especially in the early going. Perhaps more important, however, is that there will be a close aspect between Mars and Ketu (South Lunar Node) on Tuesday. This can be a dangerous combination of planets that is also likely be have a bearish influence in the early week. Monday could conceivably escape the negativity, but Tuesday and Wednesday may be more bearish. There is a potential for a significant decline here (>2%), although I must admit that the rally of recent days has reduced my enthusiasm for that possibility. It’s still possible, although not quite probable. That said, I still think the early half of the week has a good chance for being negative so we could see the 1300 tested and hopefully somewhere below that. Mercury turns retrograde on Wednesday while the Moon conjoins Venus and Neptune. The Moon-Venus combination is usually bullish although Mercury can go either way. This is more likely to be a positive session, especially if the market has been done beforehand. This positive lunar influence on Venus could last into Thursday although I’m less certain of that. Friday looks more bearish, however, as Mars forms an aspect with Neptune. So there’s a good chance for a down week here, and perhaps even a big down week. While Monday could well begin higher, I would think that any bullishness may not last and we test 1300 fairly quickly. In the event that we see a midweek rise, this seems unlikely to move higher than last week’s high of 1320. We could finish somewhere between 1280 and 1300, although there is a noteworthy chance (10%?) of some kind of Black Swan type decline that takes us lower.
 Next week (Apr 4-8) looks like another bearish week although it may be confined to the first half. The Sun opposes Saturn on Monday and Mars conjoins Uranus so there is another possibility for a sizable decline. The aspects are a little past exact so that weakens them somewhat, but they are very powerful and could correspond with a significant event that has market consequences. Again, I’m not saying it’s likely, but it has an elevated possibility given these planets. Some rebound seems likely towards the end of the week although I would note the clustering of planets here makes daily calls more difficult. The following week (Apr 11-15) looks more positive as the Mercury-Venus-Jupiter alignment although that may only boost the first half of the week. After that, a very negative week is quite probable on the Mercury-Mars-Saturn alignment on April 18. The end of April looks mostly bearish with a significant new low likely, probably lower than the March 16 low. May should see the beginning of a more solid rally, although I am somewhat less bullish about May that I previously was. The potential problem is a Jupiter-Rahu (North Node) aspect in mid-month that could cause some problems. Perhaps the market will move sideways or be range bound here before moving higher in June and July. A rally is nonetheless likely to be significant going into the summer and it may well make a higher high than February. I’m not at all sure about this, but it is a reasonable possibility depending on what kind of corrective move we get in April. The second half of 2011 still looks more bearish with lower lows more likely by December.
5-day outlook — bearish — SPX 1280-1300
30-day outlook — bearish — SPX 1180-1220
90-day outlook — neutral SPX 1250-1400
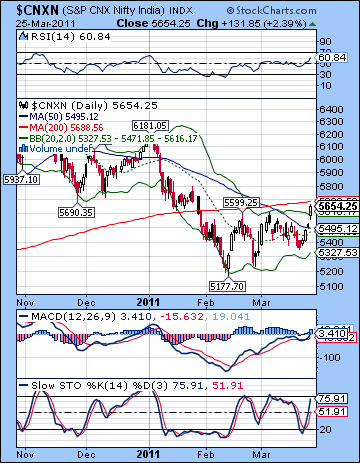 Stock indices rose sharply last week as the Japan crisis appeared to normalize and bargain hunters moved in. After Monday’s modest decline, the Sensex climbed on four straight days closing at 18,815 while the Nifty finished at 5654. While I had been generally bullish in last week’s newsletter, the extent of the upward move was surprising. Also, I thought that any up move was more likely to begin on Monday’s Sun-Uranus conjunction. However, on this occasion the upside was delayed until Tuesday. I had also been somewhat equivocal on the midweek Venus-Ketu aspect and acknowledged that it could go either way. The late week period was much more bullish than expected as any negative influence appears to have been counteracted by the approach of Venus to its conjunction with Neptune.
While there was an improvement in sentiment last week, a good part of this rally appeared to be a rooted in short covering. Investors had become too pessimistic and the short trade had become too crowded. This is an interesting manifestation of the coming Jupiter-Saturn opposition aspect. This aspect becomes exact this week (March 28-29) and generally depresses sentiment since the negativity of Saturn usually overpowers the optimism of Jupiter. While stocks have climbed off their February lows, I believe that the Jupiter-Saturn aspect has generally acted as a drag on prices and kept rallies fairly weak and short-lived through much of March. While last week’s gain was significant, it is important to remember that these aspects between slow moving planets such as Jupiter and Saturn do not preclude some upside from occurring. Once this aspect begins to separate on Wednesday (30 March), it will begin to gradually diminish in its effects. That does not mean, however, that the market will suddenly become more bullish overnight. As I see it, the negativity of the Jupiter-Saturn aspect will continue to manifest when other, faster-moving planets move into alignment with these planets and act as triggers for bearishness. So while I do not preclude more upside, I think we will continue to feel the bearish effects of Saturn for some time to come. April still seems susceptible to declines so that the more bullish scenario may only be a sideways move. Up to now, I had assumed we would put in a significant bottom in April, possibly around the 22nd. This presumed that May would be mostly higher. However, I have become somewhat less bullish about May as the Jupiter-Rahu aspect could well correlate with more downside. Whether or not it will be a lower than February or anything we see in late April is unclear. It does mean that the more reliable rally may not begin until late May or early June.
 The bulls took a big step forward last week as the Nifty pushed above the 5400 level and then proceeded to climb above the 20 and 50 DMA. As important as this move was, the main dividing line remains the 200 DMA at 5688. As long as the Nifty stays below that line, the bears will remain in control. A close above 5700 and there will likely be another wave of short covering that will push it significantly higher, perhaps towards 6000. We can see that the Nifty has been following a bear flag pattern since mid-February where it has traced out a rising channel since making the low. While the gains are significant here, the bear flag is a bearish pattern because the rise in price occurs in between larger declines. We can see there was a similar bear flag formed in December before January’s decline. A close above this trendline at 5688 would violate the bearish flag and push the Nifty higher. The indicators have improved significantly as Stochastics (75) is now heading towards the 80 line. If and when it gets there, it may make long positions less attractive. RSI (60) is similarly on the rise and has some room to go higher before becoming overbought. Up to now, it has made a series of declining peaks since last November. If it moves higher than the previous peak (64) then that will be another bullish signal. MACD is in a bullish crossover and is now pushing over the zero line.
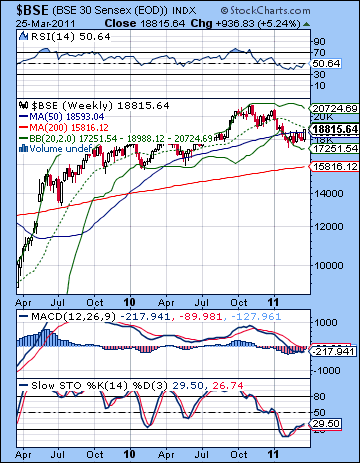
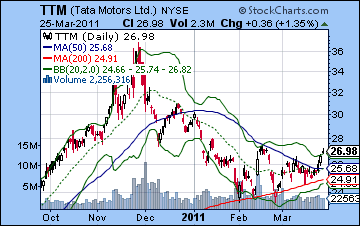
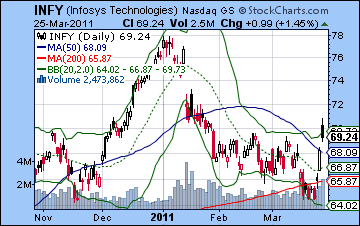
The weekly BSE-Sensex chart strengthened somewhat last week as it closed above the 50 WMA for the first time since January. As bullish as this development was, it still has to climb above the 20 WMA at 18,988 in order to get back to the upper ‘half’ of the Bollinger band. We can see that the 20 WMA has acted as support in the past, so it is possible it could be acting as resistance here. Another potential area of resistance may be the falling trend line from the November high around 20,000 (6000 on the Nifty). In the event that the 20 WMA is broken to the upside, this would be an important source of resistance. Meanwhile, the indicators continue to recover from their recent lows and could be trending higher. RSI (50) has climbed all the way to the halfway line but needs to climb above it to make this rally hold. During the long rally of 2009-2010, corrections would often take the RSI down to the 50 line and then bounce back. Some leading stocks broke above some key resistance levels last week, such as Tata Motors (TTM). It finally climbed above its 50 DMA but as bullish breakouts go, this one is pretty tepid. It has only equaled its February high and remains well below its all time high. Volume was also fairly light so that is another hint perhaps that this rally may not last. Infosys (INFY) exploded to the upside last week also closing above its 50 and 200 DMA. It closed at roughly the same level as its February high which is now acting as support. An inability to hold this level may invite another test of the 50 DMA and further downside.
 This week has a mixture of influences although there would appear to be a bearish bias. The early week will be dominated by the Jupiter-Saturn opposition so declines will be more likely then. The potential trigger aspect is also present in the Mars-Ketu square that is exact on Tuesday. Mars-Ketu is an impulsive and sudden energy that can reflect changes in direction and tends to be a bearish influence. The fact that these two aspects occur at the same time make a sizable decline somewhat more likely in the first half of the week. If the decline is large enough, it could offset any subsequent gains this week. Mercury turns retrograde on Wednesday so that may improve sentiment as we move into the second half of the week. Wednesday and Thursday may also benefit from the Moon-Venus conjunction although I would not say either day is powerfully bullish. Friday seems somewhat more bearish, however, as Mars is in aspect with Neptune. There is a real clustering of aspects here that makes the intraweek timing a little more uncertain than usual. Nonetheless, the astrological influences suggest that the Nifty is fairly unlikely to climb above 5700 here and we could see some significant downside before any recovery. The likelihood of a decline is still probable (70%) although it’s not as certain as I would like. At the same time, the chances for a large decline (>5%) are somewhat higher than chance would predict, so that is also something to be noted. I wouldn’t say a large decline is probable, but it’s quite significant, say 30%. It’s difficult to estimate the extent of any decline, although I would err on the side of caution suggesting a modest pullback towards the 50 DMA at 5495.
 Next week (Apr 4-8) is likely to begin quite bearish. Mars conjoins Uranus on Monday just as the Sun opposes Saturn. Both are potential considered triggers for the Jupiter-Saturn aspect and there is another significant opportunity for a large decline. If anything, 4 April looks more bearish than any day in the March 28-30 period. The market may decline for another day or two but recovery is quite likely by Friday. The following week (Apr 11-15) looks more stable with gains more likely than losses. There could be another rally attempt toward the 200 DMA although it seems unlikely to reach it given the likelihood of declines in the preceding two weeks. Late April is likely to continue this mostly bearish trend and we may see 5200 taken out on the downside and I would not be surprised to see something lower. I had previously expected the market to put in a significant low in the second half of April. Now, I’m not so sure. There is a Jupiter-Rahu aspect in mid-May will could be troublesome. Even if it doesn’t take the market to lower lows, it does look quite bearish in that period. So the mid-year rally may take a while to get started and May will be an extended period of consolidation. June and July still look mostly bullish although the market is unlikely to equal the 2010 high. The market should turn bearish again in August and stay in a downtrend through the Saturn-Ketu aspect in September. 4000 on the Nifty is real possibility for 2011.
5-day outlook — bearish NIFTY 5400-5550
30-day outlook — bearish NIFTY 4800-5000
90-day outlook — bearish NIFTY 5000-5500
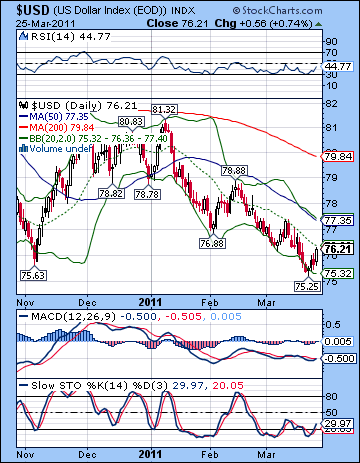 The Dollar rose from the dead last week as buyers moved in to push it back above 76 in the wake of the post-G-7 intervention in the Yen. The Euro slipped under 1.41 while the Rupee finished at 44.69. Perhaps this is the long-awaited turning point that will begin a long rally and coincide with a significant correction in equities. Let’s hope so. I had been somewhat agnostic about last week although I thought there was a reasonable chance of some upside especially after Monday’s Sun-Uranus conjunction was out of the way. Monday was lower as the USDX bottomed out at 75.25 before reversing higher. It now sits just under the 20 DMA. This isn’t much of an achievement since it has done this before only to fall again later. If it can break above its declining channel at 76.8, then it would be in a better position to launch a sustainable rally. All three moving averages are falling here and the Dollar as about as unloved as you can get. It’s a contrarian’s dream. RSI (44) is struggling higher after yet another touch of the 30 line (three time’s the charm?) but until it breaks over 50, this not will add to any bullish indications. Previous rally attempts have all failed around the 50 line. If resistance is a little below the 77 level, support is likely around 75 and last week’s low. The Dollar did break the trendline dating from the 2007 low but it has not fallen to that level. Perhaps that’s a vote for horizontal support levels. Dollar bulls certainly think so.
This week bodes well for the Dollar as the Mars-Ketu aspect coincides with the Jupiter-Saturn aspect . This is likely to spark a flight to safety move that should boost the Dollar in the first part of the week. We should at least test resistance at the falling trendline (76.8) and I would not be surprised to see it broken. The second half of the week may be somewhat less bullish, however, so we may finish up somewhere between 76.5 and 77 (1.39-1.40). Next week also looks bullish as the early week Sun-Jupiter-Saturn aspect does not look conducive to risk taking. The Dollar is likely to take flight here and may even challenge the 200 DMA at 79. The rally will likely last through all of April and may well continue into May. There is a genuine chance for a major trend reversal to take place here that could take the Dollar to some important intermediate highs, perhaps to 83. I am expecting the rally to fizzle sometime in the second half of May or perhaps in early June. The summer likely favours the Euro and equities, so it will probably retrace a portion of its rally. The Dollar’s next move up will occur by September and will likely begin another major rally through the rest of Q4. January 2012 could mark a significant high water mark.
Dollar
5-day outlook — bullish
30-day outlook — bullish
90-day outlook — bullish
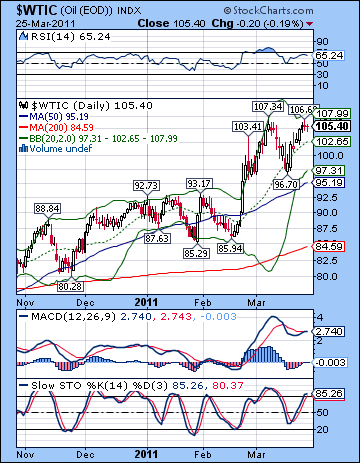 As prospects for a quick resolution to the Libyan situation dimmed, crude added to recent gains and closed just above $105 on the continuous contract. This result was in keeping with expectations as Monday’s Sun-Uranus conjunction delivered most of the week’s gains on the first two days of the week. After topping out just over $106 on Wednesday intraday, crude fell in Friday’s session. While the situation remains quite uncertain in the Middle East, the technicals took a step back last week as the previous high of $107 held firm. This created a lower high in the RSI (63) which may be a foreshadowing of its eventual weakening. Stochastics (83) have moved back into overbought territory and thus making long positions less attractive for bulls. As before, the key resistance here is likely around $105 and if it can close above that, it will make a push to $110. In the event, that $110 is made, crude would likely rally to $120 which is the next Fibonacci level. There may be some support offered by the 20 DMA at $102 but $100 may be a stronger support level that brings in new long positions. Below that, last week’s low of $97 is perhaps a firmer source of support as it coincides with the rising resistance channel dating back to 2010. Once that breaks, crude will likely return to its more familiar trading range of $80-92.
This week looks more bearish as Tuesday’s Mars-Ketu (South Lunar Node) aspect is likely to coincide with negative sentiment. It is possible crude could rise Monday, although I would tend to think that is unlikely. Generally, the first half of the week looks bearish with a possibility for significant declines perhaps down towards $100. The mood may brighten by midweek, however, as the Moon conjoins Venus on Wednesday and Thursday. Friday tilts towards the bears although this looks both less certain and a smaller down move. Overall, there is a very good chance for a lower close Friday. Next week (Apr 4-8) also looks quite bearish with significant downside possible. The Sun-Saturn opposition on Monday is likely to reduce demand for crude so prices may fall through much of the week. It is possible that crude will break support of $97 at this time. Some rebound is likely into mid-April and we could see some occasional strength during the second half of the month. I am uncertain what level crude could reach here and would not rule out another run to $100 and over. May looks more bearish generally, although there is a reasonable chance that the first part of May will be bullish.
5-day outlook — bearish
30-day outlook — bearish-neutral
90-day outlook — bearish
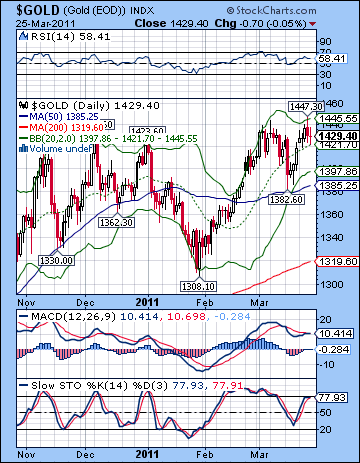 Gold rallied again last week as inflation fears played on the market. After hitting a midweek high of $1447 on the continuous contract, it settled Friday just under $1430. This bullish outcome was not surprising given the early week Sun-Uranus conjunction that delivered the bullish sentiment more or less on cue. I had also expected we would get some pullback on the Venus-Ketu aspect but this arrived a day later than anticipated on Thursday. I also thought that we might get more upward lift on Friday on the approaching Venus-Neptune conjunction although the session finished slightly lower. The inability to make new closing highs took off some of the bullish glow on the proceedings as Wednesday’s high only past the early March high by $3. It’s not exactly a ringing endorsement for a new bull run. So $1440 remains an important resistance level, especially as a closing price. The longer term chart suggests that $1500 is a possible medium term resistance level and target. The 20 DMA seems to be acting as support here around $1420 so we’ll have to see if that holds up next week. Below that, the 50 DMA at $1385 would likely bring in new buyers. This is a little above the key rising channel support that has held since 2009. Gold will remain in this bull market unless or until that channel breaks down. Stochastics (77) are towards the top end of their range so that may be another burden for the bulls to bear.
This week could be quite volatile as the early week Mars-Ketu could move the prices of most asset classes. While equities are likely to fall here, I’m less sure about gold. There is still a reasonable chance for a decline here, but it may not be on the same scale as equities. So that is two drawbacks of the bearish view perhaps. Somewhat less likely and possibly less negative. The medium term indicators look quite bearish for April, but I’m unclear when they will kick in — this week or next. If things begin to unravel this week, it should happen fairly soon, like on Monday or Tuesday. Regardless, I would expect some upside around the Moon-Venus conjunction on Wednesday. The late week looks fairly uninspired as Friday’s Mars-Neptune aspect would seem more bearish than anything else. Overall, I would say there’s a 60/40 chance of a decline here. Next week could be even more bearish especially at the start as the Sun opposes Saturn. We could get a couple of up days around the Sun-Jupiter conjunction midweek, but the trend may well be down after that. Some gains are possible on Apr 11-15 but the picture looks mostly bearish for the second half of the month. We will likely get a test of channel support at $1360-1380 at some point in April. If it happens soon enough, then it may open the door to much lower prices in May. I’m not certain it will happen that soon, however, so we will have to take it one step at a time. In terms of timing a bottom, late April or late May look like reasonable candidates. June looks bullish in any event.
5-day outlook — bearish
30-day outlook — bearish
90-day outlook — bearish-neutral

