Summary for week of March 7 – 11
Summary for week of March 7 – 11
- Monday could be shaky, then another rally attempt likely midweek in stocks, followed by weakness on Friday
- Dollar may break support in midweek with moderation possible later in the week
- Crude poised for further midweek gains
- Gold to remain strong as further upside looks likely
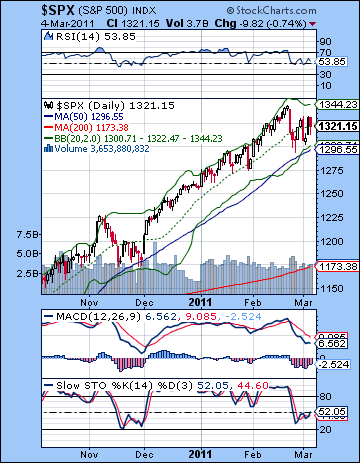 Stocks ended mostly unchanged after fairly volatile week as the Libyan crisis became old news and the February payroll report offered new evidence for inflation. The Dow edged slightly higher closing at 12,169 while the S&P500 finished at 1321. As I had been somewhat equivocal in last week’s newsletter, this neutral outcome was largely in keeping with expectations. I had thought we would move higher on the Venus aspects Monday and Tuesday and indeed Monday did see a modest gain. I thought Tuesday was less reliably bullish so there was perhaps a greater risk of a decline, especially since Wednesday was not looking that good as Mercury moved into aspect with cautious Saturn. Admittedly, I was a little off in my timing here as Tuesday reversed lower right after the open, but at least I had allowed for this possibility in my bearish scenario. Most of the bearish energy was spent on Tuesday, so Wednesday was a range day with only a slightly positive close. Thursday ended up strongly bullish, and while I thought we could have a positive bias, I did not fully expect the extent of the upside here. I thought Friday might lean to the bears given the awkward placement of the New Moon, but again, I unfortunately did not quite grasp the extent of the pessimism as there was a significant selloff after the over-hyped employment report.
The market’s reaction to the employment report reveals how vulnerable equities are at the moment. After that small 3-4% dip on the oil spike from the Libya crisis, the prospect of inflation became a potential bugbear of the market as rising oil prices tend to depress economic activity and lower corporate earnings. On the face of it, the positive employment report was good news that the economic recovery appears to be gathering steam. The problem was that the jobs number of 192,000 landed somewhere in the squishy middle. It wasn’t quite big enough to generate enthusiasm since it was widely expected to be better than January’s number. But it was still big enough that it caused more investors to question what the implications might be of such growth, especially in light of the Fed’s QE2 program. Given that investors inflation antennae were also up over Libya, this jobs data provided more inflationary fuel to the fire, as oil and gold rose in response. The stronger the inflationary pressures become, the quicker the Fed will end the treasury buy back program and the sooner it will tighter rates. While few observers expect the Fed to end QE2 ahead of its scheduled completion in June, it may be increasingly regarded as an inflationary policy that will hasten rate hikes down the road. The market thus far expected rates to begin to rise off historic lows in 2012 but if inflation continues to stir in the bowels of the US economy, it could well be sooner. That would frighten equity investors and likely cause a reduction in exposure. Certainly, the astrological perspective would tend to support that scenario where the market is confronted by a negative surprise and sells off in reaction. We are currently in one of the more probable time windows where such a bearish reaction is more likely. The others are August-September and again in November-December.
 Technically, the main indexes remained locked in the rising wedge. As long as the SPX trades in the wedge, the technical case for the bears remains somewhat hypothetical. Of course, I noted last week how it was already showing signs of weakness by briefly poking below the support line on the logged chart. It’s difficult to know how much to make of it, but it’s nonetheless worth noting. The non-logged chart shows prices adhering more faithfully to trendline support as Wednesday’s open touched this line exactly at 1304. Since stocks did bounce higher after this touch, it makes sense to follow this line as the more telling line of support. Bulls continue to move in and buy the dips resulting in a series of progressively higher lows over the past week. So as long as the trend line holds support (next week at 1310 or so), bulls may feel relatively safe. But if and when that trend line is violated, it would be a whole new ballgame. One possible scenario might be a break below the trend line and a quick fall over another one or two days to the 50 DMA at 1296. This would likely bring in a lot of buyers since it would be very close to the bottom Bollinger band and also close to the Feb 23 low. Prices might bounce back to the trend line and then resume their decline. That is one obvious possibility at any rate.
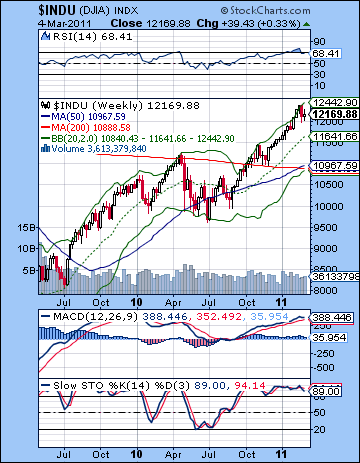
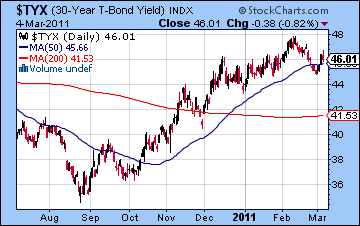
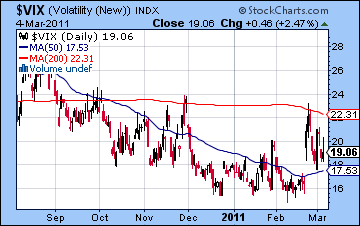
So not much has changed in the overall technical picture. The indicators remain fairly ambivalent by my reading, and the weekly Dow chart still offers the best reason to be bearish. RSI (68) hasn’t budged too far from the overbought zone and while nothing is stopping it from moving higher, it seems overdue for a pullback. Support in this chart may be initially centered around the 20 WMA at 11,641 as November’s correction ventured towards that line. The more pivotal support level is likely the 200 WMA at 10,967. This has been an important line in the sand between bulls and bears over the past several months and it will likely do so again. In the event this correction finally gets rolling in the coming days and weeks, this will be an obvious downside target that will prompt some sensible short covering. Whether or not it holds remains to be seen, although I would try to err on the side of caution here. Treasuries continue to trade in a fairly narrow range at the moment as the bond vigilantes are weighing their options. Inflation is a worry, but equities engender their own risk if the recovery is weak and wages continue to lag. The 30-year is hovering around its 50 DMA which may offer some resistance. I believe it would require a couple of closes below 4.50% to signal that the bond market was on board with the Fed’s vision of the recovery and its role in it. I don’t expect much more downside to yields here as the late March and early April period look more turbulent for bonds. In the event of a sudden equities decline, there could be a shock move into bonds that might push yields down. If this occurs, it could conceivably go all the way down to the rising trend line off the August low which would be around 4.3%. Yields could then resume their upward climb. The action on the $VIX reinforced the notion that we are in a holding pattern generally as it remains trapped between the 50 and 200 DMA. The recent move above the lows of 15-16 was significant but the inability to close above the 200 DMA showed the limits of the corrective move in stocks thus far. Nothing much will change unless it closes above 23. It looks like we may have closed some of that gap at 17 last week, although there is still a little bit to go. Maybe we close it this week as stocks attempt another rally.
 There is a reasonable probability of another rally attempt this week, perhaps around midweek and the Mercury-Uranus conjunction. Monday features a Venus-Pluto aspect and the tail end of a Sun-Saturn aspect. Both may have a depressing effect on sentiment, although neither look especially strong or reliable for that matter. However, the Moon does form a close alignment with the Sun and Saturn near the open on Monday so that may increase the likelihood of a decline in the morning. But I am less certain if it lasts until the close. As we move into midweek and the Mercury-Uranus conjunction, there is a better chance for gains. I still wouldn’t quite put it in the same league as last week’s Venus-Uranus aspect, but it still seems positive. Tuesday may be a better bet for a gain, although Wednesday also has the distinction of an apparently bullish Venus-Jupiter aspect. So if the bulls are running, they could enjoy two up days in a row. Nonetheless, I would be somewhat wary of Wednesday since it will be in the aftermath of the Mercury-Uranus aspect. Perhaps it starts bullish and ends flat — that is one possibility. The end of the week looks less positive and I would expect at least one down day here. Mars is approaching its aspect with Saturn so that may increase tension and dampen sentiment. It’s not yet exact, so I don’t want to trumpet its downside potential too much, but it’s definitely not bullish looking either. Friday is perhaps more bearish than Thursday, although I would be cautious both days. Overall, I’m not sure if end higher or lower as the market may well stay in the wedge yet again this week, although Friday may be the best opportunity for a breakdown. A more bullish unfolding would see a slightly lower open Monday and then reversal intraday. The rise could extend into Wednesday and challenge the highs of Feb 18 at 1340. Friday would see the SPX back down around 1325-1335. A more bearish unfolding — which I think is more likely — would see support tested Monday at 1310 but a partial recovery by the close. We put in a high on Wednesday around 1330 and then head back down to 1310-1320. That would be a negative week overall, although not by much. It would also likely keep the wedge intact. Again, I do think the market is more susceptible to sudden declines as we move deeper into March so there is the chance that the Mercury-Uranus conjunction and its aftermath could bring on some larger moves down, although they are not quite probable.
 Next week (Mar 14-18) has a good chance for a down day on Monday on the Venus-Mars-Saturn alignment. Mars aspects Saturn exactly on this day so that is the main bearish fuel, although I would acknowledge the co-presence of the normally bullish Venus is a source of some ambivalence. It could either diminish the negativity or it could end up amplifying it — I would tend to expect the latter. Tuesday will be a fascinating day as Mercury conjoins Jupiter. Usually, this would be a no-brainer bullish aspect but in this instance, it will occur in fairly close opposition to gloomy Saturn. So that reduces the reliability of the bullish influence on the market as I see it. I still think we should expect a gain here, although there is a chance it could end up going south in a big way. A more reliably bearish aspect will occur later in the week when Mercury does exactly oppose Saturn. So I would expect the bears to carry this week and we have a good chance of breaking out of the wedge. The following week (Mar 21-25) may begin with a significant move on the Sun-Uranus conjunction. This may start positively but stocks could well reverse by the close. I expect a mostly bearish bias here until perhaps the end of the week and the Venus-Neptune conjunction. The Jupiter-Saturn opposition becomes exact on March 29 so that will likely keep stocks under pressure into April. There is a parade of planets transiting the sign of Pisces opposite Saturn in April. My best guess is that this will weaken sentiment and push prices lower, perhaps by a lot. Of course, there is always the chance that Jupiter might win this tug of war with Saturn and stop the correction in its tracks in early April and then take prices higher. I don’t think this is a probable outcome, but it is nonetheless possible. The end of the Mercury retrograde cycle on April 22 may also mark a significant point. The planets generally look difficult before this date, so that is one possible candidate for an interim low. I do expect a significant rally this spring but I expect it will begin after this date. May and June generally seem bullish, albeit with some wrinkles especially in mid-June. As before, August and September look like another significant downward move that may well form lower lows.
5-day outlook — bearish-neutral SPX 1310-1320
30-day outlook — bearish SPX 1250-1280
90-day outlook — bearish SPX 1200-1280
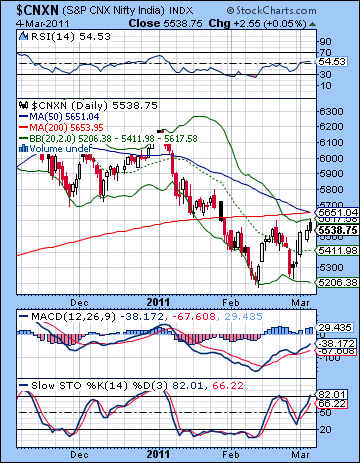 Stocks bounced sharply higher last week as investors cheered the balanced approach of Monday’s release of the Union Budget. The BSE-Sensex gained more than 4% closing at 18,480 while the Nifty finished at 5538. This bullish reception to the budget was largely in keeping with expectations as I thought we could see some sizable upside on Monday and Tuesday. Interestingly, Tuesday turned out to the be the big day, even if I thought it was somewhat less favourable than Monday. Nonetheless, the two-day period was positive as the gains then carried through to the rest of the week. While I was correct in predicting that the end of the week would be less bullish, I thought we might see more profit taking on Thursday and Friday. As it turned out, however, both days were mildly positive as Indian markets gamely resisted any significant selling pressure, Libya and the rising price of oil notwithstanding.
Thus far, stocks have rebounded from recent lows more or less in keeping with medium term expectations. The Rahu-Uranus aspect that was exact last week has roughly coincided with sudden or chaotic events as we have seen in Libya and this took equities lower through much of February. Now that this tumultuous influence is diminishing, all eyes should be focused on the upcoming Jupiter-Saturn opposition aspect of 29 March. As I have noted previously, this aspect between the two reigning planets of the solar system has the potential to move markets significantly and determine medium term trends. Recent aspects between Jupiter and Saturn have often corresponded with corrections, and in some instances with actual interim lows. At the same time, I think it’s important to retain a certain healthy skepticism about how these aspects might play out. Certainly, the Jupiter-Saturn aspect is a bearish influence and that is why I am maintaining my fundamentally bearish stance here, at least until April. However, astrology is rarely scientific in the Newtonian sense that A + B = C at all times and places. It operates more along the lines of quantum physics were probabilistic outcomes are the rule, or perhaps like economics where the vicissitudes of human behaviour preclude the existence of iron laws. So while I expect March will be a generally bearish month, I am still making allowances for some surprises along the way. The March 29th Jupiter-Saturn aspect may represent: 1) one part of larger leg down that continues into April, or: 2) it may closely correspond with a major bottom or even: 3) begin a new down leg after stocks go sideways or higher leading up to the 29th. While I tend to favour the first scenario here as I think markets will tend to move lower through both March and April, it’s worth keeping an open mind just in case.
 Last week’s rebound gave the bulls significant momentum from a technical perspective, although the Nifty still trades below its 200 DMA. The case for the bulls might be boiled down to two words: "double bottom". The second test of 5200 and the bottom Bollinger band is certainly a price pattern to be taken seriously as it forms the very bullish "W" pattern that often foretells of higher prices. The technical indicators would also provide good evidence that a significant recovery is underway. RSI is climbing and made a much higher low after last week while MACD is similarly moving higher after making a higher low at the end of February. Stochastics (81) favour the bears, however, as it has already moved into the overbought area. Nonetheless, two of three indicators are signalling bullish moves ahead. But the bears also have some very important points to make in their favour. First and foremost, the Nifty has yet to cross above the 200 DMA. This is the basic dividing line between bear and bull markets. When price is below the 200 DMA as it is now, bulls are more cautious and may tend to sell their position in the event of any down days. We can see that the 200 DMA at 5653 is near a convergence point for several key lines including the upper Bollinger band and the 50 DMA. In fact, we saw a "death cross" of the 50 and 200 DMA on Friday. While this is definitely a bearish signal, one cannot put too much emphasis on it. So until the Nifty can close above the 5650-5700 level, the bears will likely enjoy the default status in the market. If the Nifty should rise beyond 5700, the the double bottom would likely boost prices quite quickly towards the next level of resistance at 6000, which is in line with the falling trend line from recent price peaks.
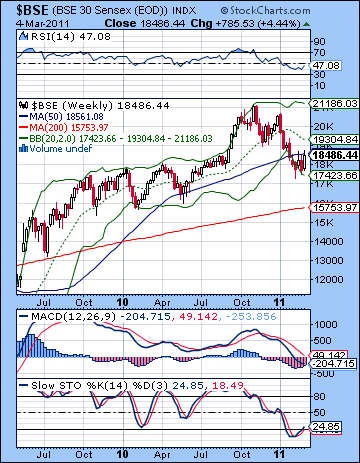
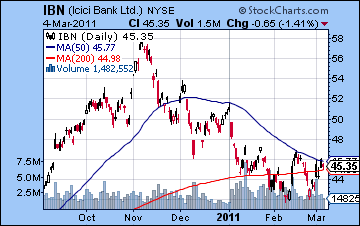
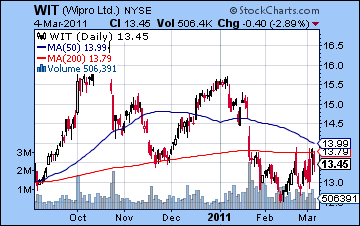
A quick look at the weekly Sensex chart and it’s easy to see the bulls conundrum. While the rebound was vigorous, the Sensex still closed at the 50 WMA. Since this line has been support in the past (May 2010), it is quite possible that it may act as resistance here. The technical indicators are a mixed bag as RSI and MACD are generally weak and have much further to fall in the event of a longer correction, but Stochastics seem to be turning higher and may be primed for more upside. In the event the rally continues, the next level of resistance would seem to be near the 20 WMA at 19,304. This would roughly translate as 5791 on the Nifty. Since this is some distance from the harder 5700 resistance level, it raises the question just which one of these levels would tend to bring out more sellers. I would think 5700 would be the harder fence to climb, but 5791/19,304 would no doubt be the next level for bulls to confront. In the event of a deeper selloff, support on this weekly chart may well involve the 200 WMA at 15,753. ICICI Bank (IBN) is perhaps a bellwether for the stronger side of the market and shows how we are at a critical inflection point. While this stock has failed to rise above its 50 DMA twice in the past two weeks, it nonetheless looks poised to do so. Note how price is perched atop the falling channel. If it rises above, then it will likely move significantly higher, perhaps to the 51 level. If it fails to break above the 50 DMA, however, it would likely sink like a stone back towards the recent lows and then some. Outsourcers like Wipro (WIT) have had a tougher go of it recently due to the rising Rupee, but it may also be ready for a move higher. While it may break above its 50 and 200 DMA, it still has about 6-7% to rise before it runs into the falling trend line from recent highs.
 This week looks quite mixed although there a good chance for solid gains midweek around the Mercury-Uranus conjunction. Monday may well begin the week on a negative note, however, as the Sun and Moon are in aspect with grim Saturn. This seems to be a moderately reliable bearish influence and there is a chance for a significant decline. That said, I believe there will be a bullish bias heading into midweek that will likely offset any losses we may see on Monday. Tuesday and Wednesday have a high likelihood of being net positive, with an equal chance of gains on both days. Thursday and Friday seem somewhat less bullish, with Friday perhaps looking the weaker of the two due to an approaching Mars-Saturn aspect. It won’t be exact on Friday so that reduces the reliability of the bearishness here, but it nonetheless deserves caution. The week is fairly dense with aspects here so that may make some of these daily calls more difficult to pin down. A bullish scenario would see a modest decline early in the week to 5450-5500 and then a rise toward 5650 and that key resistance level. The end of the week would see a slight retreat to 5550-5600 but it may still be good enough for a winning week. The bearish scenario here would see a deeper decline on Monday and perhaps extending into Tuesday that reaches 5300-5400 and then rallying to 5500 by Wednesday or Thursday. Friday would see the Nifty slip to somewhere in the 5400-5500 level. I am uncertain which is more likely, perhaps I would give a slight edge to the bearish version, if only because my medium term bias is still negative. But I would not be at all surprised to see 5700 in any event.
 Next week (Mar 14-18) looks more reliably bearish as Monday starts off with a nasty Mars-Saturn aspect. This could be a sizable decline. We might see a strong up day on Tuesday ahead of the Mercury-Jupiter conjunction but the rest of the week looks largely negative. Friday’s Mercury-Saturn opposition stands out as perhaps another big down day. This means that the Nifty is unlikely to break above 5700 as it may end up retesting support at 5200 during this week. The following week (Mar 21-25) may be more mixed but it seems unlikely to generate much upside due to the absence of any clearly positive aspects. Then the Jupiter-Saturn opposition in the last week of March is likely to sink prices further. The days of the 28th, 29th, and 30th are likely to see at least one major decline as Mars aspects Rahu. We may see some recovery in early April on the Sun-Jupiter conjunction, but April does not look that promising due to the Mercury-Mars conjunction in opposition to Saturn around the 22nd. It seems quite likely that we will break below 5200 at some point here and a test of 4800 is quite possible sometime in April. There is a good chance we will see an interim low formed in April and then a rally will begin that will last into May and June and probably July. It seems unlikely that it will retest recent highs above 6000. August and September will begin the next corrective phase on the Saturn-Ketu aspect. Generally the second half of the year looks bearish and lower lows are possible.
5-day outlook — neutral NIFTY 5450-5550
30-day outlook — bearish NIFTY 5000-5200
90-day outlook — bearish NIFTY 5000-5300
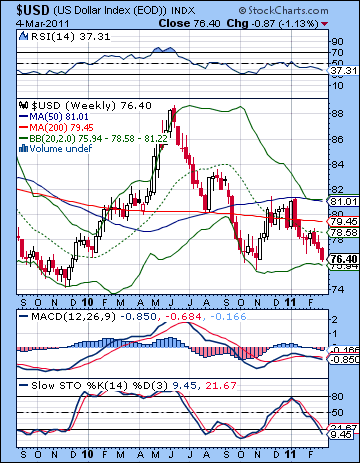 The Dollar continued its tour of Skid Row last week as it closed lower again last week at 76.4 right near a critical support level. The Euro climbed to 1.398 while the Rupee ended the week at 44.86. As unnerving as this bearish result was, it was not very surprising as I thought the strong Venus influence would likely boost risk appetite and reduce the greenback’s appeal. The exact Rahu-Uranus aspect occurred on Friday so the Dollar fell all the way into that aspect. Will it turnaround now that this aspect sits right across the Euro’s ascendant? It is certainly an intriguing coincidence that the Dollar should fall down to a key support line that dates back several years in the same week that there is an exact aspect between slow moving Rahu and Uranus that sits precisely on the most sensitive point of the Euro horoscope. As inflation talk takes on a more serious tone these days and ECB chair Trichet has publicly mused about raising rates, the Dollar is under the gun. The Fed is conspicuously trying to devalue the Dollar in its attempts to kick start the economy while commodities soar as more investors seek out a viable store of value. Will Bernanke & Co. simply let the Dollar fall indefinitely and risk its reserve currency status or will they try to defend by removing liquidity from the system? From a technical perspective, it’s clear that we have arrived at a time when we can proffer an answer to this question. If it falls further, it will likely quickly slip to the next level of resistance at 74 set back in November 2009. If that breaks down, a quick trip to 72 may be in order — the old summer 2008 low before the market went up in flames. Interestingly, we see commodities such as oil and gold making new highs now just as they did back in mid-2008 when oil peaked at $147. We are clearly approaching a reversal point but whether it turns here, or at 74 or at 72 is an open question. RSI (31) is rapidly approaching the oversold level. While this decline has been difficult to stomach for bulls, the prospect of a double bottom in the RSI should offer at least a glimmer of hope that a rebound is in the cards.
So will the Dollar bounce here are plunge like a rock? The astrology suggests that the midweek Mercury-Uranus conjunction could very well bring more downside to the Dollar. While Monday may be somewhat bullish, Mercury will be putting the cherry on the top of the Rahu-Uranus aspect that has been activating the Euro chart recently. For this reason, we may have a few days of downside that seems likely to probe below 76. Later in the week, the Dollar may firm up somewhat, although I’m not holding my breath. Next week looks better for the Dollar as the Mercury-Jupiter conjunction set up in fairly close aspect to the USDX ascendant. It will be a long road back to 80, but there is some reason to expect this rebound in the second half of March, April and into May. Watch for a possible interim high in late May. While speculating on levels is tricky, I do think there is a good chance the Dollar will once again be back above 80 (1.30) and it could well be higher than that.
Dollar
5-day outlook — bearish
30-day outlook — bullish
90-day outlook — bullish
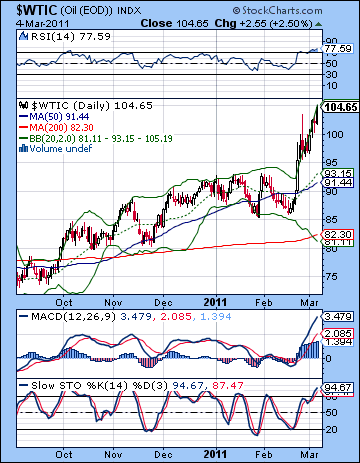 As Libya sank deeper into the dreaded civil war scenario, crude oil surged another 7% closing above $104 on the continuous contract. While I saw further upside on last week’s Venus aspects, the extent of this rise was surprising. Obviously, I have greatly underestimated the size of this rally. Part of the explanation lies in the favourable position of Jupiter in the crude Futures horoscope as it approaches its conjunction with the Sun this week. Once that conjunction is out of the way, I believe there will be a reduction of upward momentum for crude ahead of an eventual reversal. That said, it’s still unclear to me how fast it will take to regain its previous levels. It is possible that crude will stay elevated for several more weeks. Technically, crude looks very bullish as it has broken above its rising channel. This could either be the beginning of a new leg higher or it may be an unstable blow-off top that goes parabolic and then like a rocket, reverses sharply and falls back to Earth. For several weeks, crude was trapped by its 50% Fibonacci retracement level around $91. This was the halfway point between the all-time high of $147 and the late 2008 low of $35. We take note of the fact that crude is now just a little above its 61.8% Fib level of $104. The next Fib level is 76.4% and that translates into $120. All the technical indicators are very bullish as RSI tops out at 78. It is unlikely this kind of momentum can last very much longer although the more important question is at what level might we see a consolidation. Besides the psychologically important level of $100, it may be helpful to watch $96-97. That represents the top of the rising channel over the past few months. If bulls can keep prices above that level, then it will mark a hugely important development in the oil market. This will point to a situation where medium term prices move between $95 and $120 or higher, depending on one’s disaster scenario for Middle East unrest. If it falls below $96, however, then it may quickly resume its normal trading range. We should recall that a similar price explosion occurred in 2008 which eventually collapsed in the chaos of the financial meltdown. This is not to say that a similar outcome is likely here, but we should be aware how quickly commodity rallies can go bust.
This week may see another move higher on the midweek Mercury-Uranus conjunction. While Monday could go either way, Tuesday and Wednesday do seem to favour the bulls as the Jupiter-Sun conjunction takes hold. While some late week profit taking is likely, there is nonetheless a good chance for a positive outcome this week. Next week will be very interesting as Monday’s Mars-Saturn aspect should not be positive for most asset classes. While I am expecting a major equities selloff at that time, I’m less confident about crude following suit. One reason is that crude and stocks have been moving inversely ever since the beginning of this Middle East unrest. If stocks are likely to fall, then there is a good chance it’s due to rising crude prices. It’s not a perfectly inverse correlation, but the probability seems reasonable. So it is quite possible we could see $120 by the middle of March and prices could stay quite high until early April. However, I do note that the medium term influences look less favourable. The best chance for a significant decline occurs in the week of March 21-25. This looks like quite a serious drop – perhaps 5-10% — and it could conceivably mark the end of this parabolic move higher. That said, we could see another significant spike in early April on the Mars-Uranus conjunction followed by another sharp decline. It is unclear if this will mark a new high. Based on my understanding of the Libyan horoscope, however, the early April time frame may well represent a significant development, perhaps even Gaddafi’s removal. The likelihood for lower crude prices increases as we move deeper into April and May.
5-day outlook — bullish
30-day outlook — neutral-bullish
90-day outlook — bearish
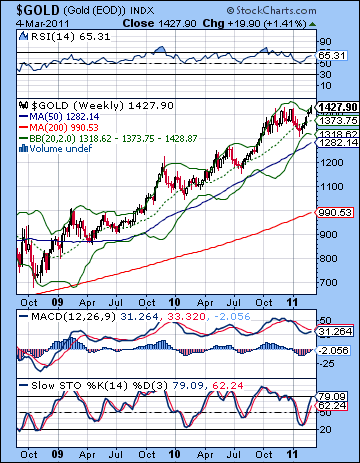 Gold loves blood sports, especially when it involves Middle Eastern dictators who are sitting on a fair chunk of the world’s most important resource. As a result of the descent into civil war in Libya, gold soared to new all-time highs closing at $1427. While I thought we would see some upside early in the week, the size of the rally caught me off guard. Gold made its high on Wednesday just as the Venus-Uranus aspect was at its closest and then retreated somewhat for the rest of the week. Besides uncertainty over Libya, gold also benefited from rising inflation fears in the US and Europe and Friday’s jobs report suggested the recovery was picking up steam. With the Fed unlikely to boost rates anytime soon and buying back government debt almost as fast as the government spends it, it’s a perfect storm for gold bulls and bugs as investors seek safe haven in a volatile financial environment. It’s hard to argue with new highs from a technical perspective. RSI peaked at the 70 level midweek and then pulled back to 65. MACD and Stochastics are also showing major momentum now. Support is initially at the old highs around $1420 which also corresponds to the rising trend line from the recent channel. Given the steepness of this line, it seems unlikely that it can hold up in the short term. Below that, the 50 DMA near $1375 may offer support in the event of a sharper pullback. Resistance is perhaps around $1500 now based on a trend line that connects the December 2009 and November 2010 tops.
This week could see more upside for gold as the Mercury-Uranus conjunction may reflect ongoing geopolitical uncertainty. I don’t expect gains to be huge here, however, as there are a number of medium term factors that appear to be gradually favouring the bears. Monday and the the late week period looks somewhat more bullish. It is possible that we could see gold continue to move higher for the next two weeks, although I think there is likely to be wild gyrations in both directions here. If this week is more positive, then next week (March 14-18) looks more bearish. The second half of the month looks mostly bullish again, so gold could well remain over $1400 in the near future. And I would not rule out a push to $1500 either. The best chance for a thoroughgoing decline will begin in in the final days of March and the beginning of April. Another rally is likely in mid-April, but late April and May look quite bearish. I would expect gold to correct right through to the end of May and the Venus-Mars conjunction on May 22. After that, we may see another significant rally into June and possibly July. Gold will likely correct again in September and October.
5-day outlook — bullish
30-day outlook — neutral-bullish
90-day outlook — bearish

