- Stability returning to stocks after downside probing early in the week
- Euro recovery likely on government intervention; Dollar to consolidate recent gains
- Gold to stay strong until mid-May with more upside possible
- Crude oil stabilizing after Wednesday
- Stability returning to stocks after downside probing early in the week
- Euro recovery likely on government intervention; Dollar to consolidate recent gains
- Gold to stay strong until mid-May with more upside possible
- Crude oil stabilizing after Wednesday
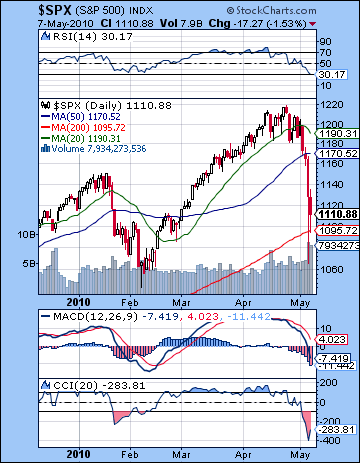 The penny may have finally dropped on this rally. In the wake of Thursday’s dizzying "flash crash" where buyers seemed to completely evaporate for 15 minutes at 2.45 p.m., stocks ended a tumultuous week down over 5%. After briefly trading below 10,000 Thursday, the Dow closed Friday at 10,380 while the S&P finished at 1110. The catalyst for the downdraft was renewed fears that Greece could default on its debt which would seriously undermine the viability of the Euro and the Eurozone. And thus the long-awaited Saturn-Uranus sea change seems to have arrived as fear and panic have re-emerged to challenge investor complacency borne of 13 months of Bernanke’s liquidity-driven rally. Needless to say, I’m quite relieved to this turn of events since I had expected the Sun-Mars square would provide the planetary spark to release much of that pent-up tension contained in the aspect of the slower moving Saturn-Uranus opposition aspect. While I was fairly confident that the market would decline overall, I was uncertain about how it would unfold due to the high number of aspects occurring within a short time period. The Sun-Mars aspect was exact on early Tuesday but I thought the most bearish pattern might be Wednesday as the Moon joined the alignment. As it happened Thursday was the key down day, although we saw drops on every day after Monday. Monday was actually higher and I had allowed some possibility for this outcome once the Moon has passed out of its trouble area with Rahu. It was more or less ‘bombs away’ after that with Wednesday ‘s rally attempt failing to hit the 50 DMA and that set up the carnage on Thursday. Interestingly, I noted the possibility of gains for Friday on the Venus-Mars aspect and the market was actually higher at the open. However, it did not last as prices fell sharply again to retest the lows of the previous day. In light of last week’s shocking developments, it does seem like we have entered into a new investment reality where the inherent trust many had placed in the low interest rate driven rally has been called into question. Investors may be finally waking up to the realization that the bad debt from the sub-prime banking crisis in 2008 has merely changed clothes and is now found on national balance sheets and awaits a new reckoning. Equilibrium will likely only be achieved once these unsustainable debt levels has been flushed from the economic system. This will likely require a further decline in asset values this year, and perhaps well into next year also.
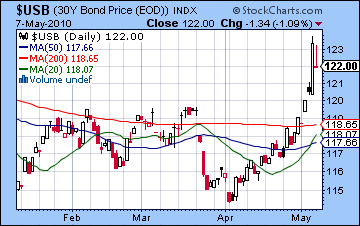
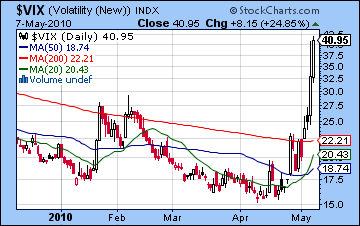
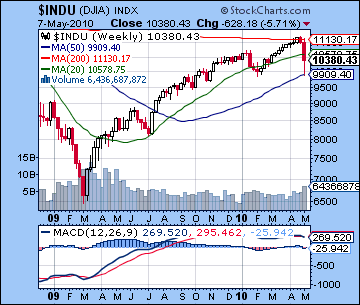 While I thought it likely that we would break through the 50 DMA at 1165, I was uncertain that the down move would be big enough to test the 200 DMA at 1090. As I put it in last week’s newsletter: "The 200 DMA at 1090 is perhaps a better support level since it has a more likely chance of figuring into the price action. It may be asking a little too much to see that tested this week but it is not out of the realm of possibility". As it turned out, the 50 DMA fell away on Wednesday as a rally attempt could not recapture that level. And the 200 DMA was test not once, but twice as the initial crash took the S&P down to 1065 and then Friday’s low was situated at 1094. There is some question about the validity of Thursday’s low of 1065 since it resulted from some trades that have since been canceled due to possible faulty computer program trading. Whether it was actually a glitch or result of massive number of sell orders once the 1130 level was broken, enough investors believe 1065 is a valid low. This puts it roughly in line with the February low of 1044 and sets up the possibility of a very bearish head and shoulders pattern. For this pattern to become valid, we would probably have to see the February low tested again. This may not require a drop all the way down to 1044, but 1065 would clearly suffice. And we could even make a case for a slightly lopsided H & S pattern if we saw some consolidation around the 200 DMA (1090) over the next two weeks. This would form the basis for another rally into July that could reach 1150, thus equaling the January high. The Mars-Saturn conjunction occurs in late July so that would coincide with another sharp sell-off. It’s an appealing scenario to be sure although it is only one scenario out of several. The technicals are uniformly terrible and indicate lower prices in the near term. The $VIX hit a new high for the year at 41 while the sentiment indicators such as the $BPSPX (61) has fallen off the table with last week’s move. Treasuries benefited hugely from the flight to quality last week but the 30-year note index (USB) is now near some key resistance at 123. While it could move above that level over the next week or two, it’s also possible that most of the gains from risk aversion have been made and that it may reverse fairly soon. A reversal lower for bonds would generally coincide with another rally for stocks.
 This week is likely to see more downside probing especially in the early week period before Wednesday’s Mercury direct station. Monday starts with the Moon in Pisces between Uranus and Mercury. This isn’t a bad combination but with the Mercury drifting slowly to a tense quincunx (150 degree) angle with Saturn on early Wednesday, I would not expect too much upside here. Tuesday will see the Moon enter Aries and that is perhaps more bearish given its proximity to Mercury. As a pair, the two days look to be net negative with Tuesday more negative than Monday. Wednesday is a possible reversal day as Mercury ends its retrograde cycle and moves forward once again. The other positive here is that the Sun and Venus are forming a minor aspect so that should produce at least one significant up day, with a good chance for two up days between Wednesday and Friday. Friday sees the Moon enter comfortable Taurus where it joins Venus. This is also a potentially bullish combination, although it is a very wide 20 degree conjunction. If we get another big down move early in the week that tests SPX 1065, then it will be difficult for the markets to closer higher overall. Nonetheless, I think there is a good chance we will only move back down to 1090 by Wednesday and move higher after that, perhaps into the 1130-1150 range. That would be the more bullish scenario. The more bearish scenario would see perhaps 1040-1070 intraday by early Wednesday followed by a rally to 1090-1110 by Friday. Overall, I would lean towards the more bullish scenario here.
 Next week (May 17-21) looks like an extension of the rebound that will likely begin this week. There is a multi-planet alignment involving Sun, Venus, Jupiter, Saturn, Uranus and Neptune that could well take prices higher, perhaps substantially so. The early week period is more bearish, however, so some kind of down day is likely, perhaps 2-3%. This looks like a weak rally that will mark time between the early May and early June lows. It may retrace as high as 38 or 50% to perhaps to 1130-1150 but prices may not be able to sustain that momentum after that. The following week (May 24-28) looks mixed again with more negative bias creeping in by week’s end as Venus approaches its conjunction with Ketu. After the Memorial Day holiday on the 31st, look for some more fireworks on the downside as Mars moves into the ongoing Big Alignment with Jupiter, Saturn, Uranus and Neptune. It’s possible we could see a significant decline here on the order of what we’ve just seen. This would coincide with the Saturn direct station on May 30 and Neptune’s retrograde station on May 31. These near-simultaneous reversals of planetary direction often accompany significant changes in market trend. You may remember that both Mercury and Saturn reversed their directions near the mid-January top. At this point, this first week of June may be a candidate for interim lows, perhaps even forming the right shoulder in the head and shoulders pattern. But if the preceding rally into May 21 has fizzled fairly quickly with only a 25 or 38% retracement, then early June could well mark new lows. It is something we will have to watch carefully. I still expect some kind of rally through much of June and into July. This rally could conceivably last all the way until July 25 and the next, and final, Saturn-Uranus opposition. This occurs just days before the Mars-Saturn conjunction and should coincide with a very volatile period in the markets. I have previously stated that I was unsure about whether we could reach higher highs in June and July. Given last week’s moves, the notion of a higher high at, say, 1250, seems much less likely now. I would not completely rule it out since we still have to see what kind of low we put in here or in early June. If it’s lower than 1050, then the rally will likely not be very strong. Nonetheless, a more likely scenario would be a July top that is lower than 1220 and perhaps closer to the January high, say around 1100-1150.
5-day outlook — neutral-bullish SPX 1100-1130
30-day outlook — bearish SPX 1050-1100
90-day outlook — neutral SPX 1090 – 1130
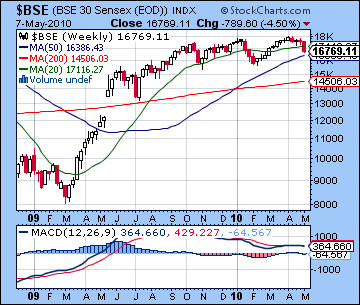
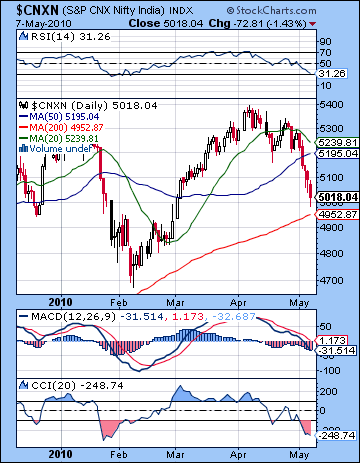 The tide may have finally gone out on this rally. Stocks in Mumbai tumbled 5% last week as global financial markets came to terms with the increasingly precarious position of Greece, the Euro and the whole Eurozone. Equities fell in every session as the Sensex closed at 16,679 with the Nifty finishing at 5018. This outcome was very much in keeping with expectations as I had been quite bearish on the nasty Sun-Mars square. I had forecast increasing volume and volatility and we saw that in spades. Given the fact that the Sun-Mars aspect was geometrically connected with both Saturn and Rahu, I even wondered if the entire week would be negatively affected since "declines are possible on all five days". As it turned out, the bears did take control on every day, even on the days where I thought we might see some gains. The pullback broke through the rising wedge pattern at Nifty 5200 as we saw more after effects of the Saturn-Uranus aspect. While the exact aspect on the 27th did not coincide with the annual top, it is nonetheless an interim top and prices have fallen steadily ever since. In this sense, last week’s Sun-Mars aspect was the trigger for the slower moving and more powerful Saturn-Uranus-Neptune alignment that still dominates the sky. Last week I noted that this alignment had the power to shake up the status quo in the financial world as various struggles ensue between debtor and creditor, regulator and speculator, and ultimately fear and greed. I believe Thursday’s "flash crash" in the US was a harbinger of things to come in 2010 and perhaps into 2011. These planets are in a very rare pattern this year and there is a real possibility of a radical transformation of the global financial system in the years ahead. The last time we saw any configuration like this was in 1931-2 at the depths of the depression. The desperate economic circumstances of that era produced European fascist states such as Nazi Germany and unprecedented government intervention in the economy such as FDR’s New Deal. It is too soon to know what path history will take this time around, but we should expect a lot of uncertainty and a reformulation of the global economy in the next 5 to 10 years. India is in an excellent position compared with other high-debt countries such as the UK or the US, but we cannot expect it to completely escape difficulty over the next 12 to 18 months.
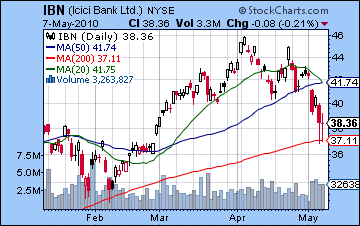
The technical picture has obviously darkened considerably here. The wedge was broken on the downside on Tuesday and the market never looked back. Prices have fallen below both the 20 and 50 DMA and are just one percent from the 200 DMA, currently at 4952. Support from the 200 DMA is quite important since it was successfully tested by the February low. Should it fail in the days and weeks ahead, there would be much less support available and prices would fall further. The 20 and 50 DMA are on the verge of a negative crossover and this would further solidify the bearish outlook. Daily MACD has fallen below zero and remains in a bearish crossover. CCI (-248) is hugely negative and rebound rally would more likely occur once it had again crossed the -100 line as it did in February. RSI (31) is quite bearish and may fall into the oversold zone in short order. More ominously, the Sensex weekly MACD is again in a clear bearish crossover. Combined with its ongoing negative divergence, this is an extremely negative technical indication and points to lower prices over the coming weeks. With all eyes on sovereign debt, the financial sector is coming under intense pressure here. ICICI (IBN) is now very close to its 200 DMA and also features the beginning of a bearish crossover of the 20 and 50 DMA. Like the Nifty, its inability to reach higher highs in late April has been followed up by a sell-off as more investors have decided to book profits and search for greener pastures. Overall, then, the market is vulnerable to further declines. If it should close below 4952 and the 200 DMA, then there is a greater risk of it falling back to the February low of 4700. I don’t think this is probable this week but it is certainly very possible in the coming days. Below that, 4000 might be another level worth looking at, although I think we may be a month or two away from that. Resistance is near the wedge at 5250 so any rally off new lows will have to contend with climbing back over that. And of course, the 200 DMA at 4952 will act as resistance if and when prices fall below it. There is a real possibility that we may see a bearish head and shoulders pattern form over the coming weeks with lows comparable to February lows arriving some time in May or perhaps early June. The next phase of this pattern would be a rally to form the "right shoulder" which would be roughly equivalent to January high of 5200-5300. This may occur sometime in late June or July. This is a bearish pattern and would produce a larger sell-off starting in late July. This will be something to watch for as the market unfolds.
 This week is likely to see more stability return to the market, although perhaps only after Mercury has ended its retrograde period on Wednesday. Ahead of Mercury’s reversal, we can expect more volatility with a downside bias. Mercury’s retrograde period has been particularly rough this time around because it is 6 signs from Saturn, an unfortunate number. More specifically, Mercury (8 Aries) will reverse its direction while is close 150 degree aspect to Saturn (4 Virgo). Monday and Tuesday are likely to be net negative with Tuesday perhaps more bearish than Monday. Monday will see a very dim Moon in Pisces approaching Mercury which will weaken sentiment, although look for some bounce once European markets open. I would not rule out a positive close although that is not certain. Tuesday will feature the Moon still in Pisces but it will form aspects with the Sun and Moon so again there could be some more buying in the afternoon after Europe opens. Wednesday is harder to call as the Moon conjoins Mercury immediately following its station. This could be down day or it could mark a real reversal in trend. At worst, it will coincide with the bottom for the week or at best it may mark the beginning of the upturn. I would lean towards a positive close here although that is not clear. Gains are more likely to occur Thursday and Friday, however, as the Moon conjoins the Sun (the New Moon) in Aries while in close aspect to Venus. The Sun and Venus also make favourable aspects in the NSE horoscope so those are additional factors to boost confidence. There is a good chance that we will break below 5000 on the Nifty, and probably 50-50 that we reach 4800 and the approximate level of the February low. While there is a lot of scary stuff in the media that might suggest widespread panic selling in the offing, I don’t really expect it to happen just yet. With some rebound gains likely by Friday, we could finish fairly close to current levels.
 Next week (May 17-21) looks mixed but with some gains possible as the rebound rally is extended into a second week. There will be another major alignment of fast moving Sun and Venus will the slower moving planets such as Jupiter, Saturn, Uranus and Neptune. This is likely to coincide with significant gains although there will likely be at least one major down day as well. This week is likely to produce some large size moves in both directions but with gains probably winning out over losses. The following week (May 24-28) looks less positive but with bearishness coming back in towards the end of the week as Venus approaches Ketu. The first week of June looks considerably more bearish as Mars opposes Neptune and joins the alignment with Saturn and Uranus. If there has been gains ahead of this time, then this week looks likely to send prices back down towards the May lows, perhaps lower. On balance, however, June may be positive. The time around June 18-21 could be quite negative, however. The chances for higher highs over 5400 in June and July are decreasing as this correction deepens. At this point, a recovery rally to 5200 by July may be the most likely scenario. But let’s first see how low we go by early June. Late July looks quite negative on the Mars-Saturn conjunction and that will probably be enough to start a significant down trend, assuming one has not already been put in place by then. Nifty 4000 is very possible by August.
5-day outlook — neutral NIFTY 4900-5100
30-day outlook — bearish NIFTY 4700-5000
90-day outlook — bearish NIFTY 4500-4700
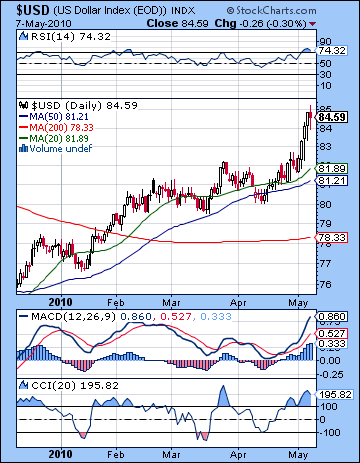 As the world’s financial system began to resemble a house of cards last week, the US Dollar reaped the rewards from its traditional safe haven status. It left its previous resistance level of 82 behind in the dust as it soared to 85 before closing at 84.59. This was in keeping with our forecast although the gains exceeded expectations as I wondered if we would see 85 by the end of May. The dollar gained on each day between Monday and Thursday and coincided with the transit of Venus to the ascendant of the USDX chart. Clearly, last week’s developments have returned us to climate of uncertainty and fear that characterized 2008 as investors seek ways to protect themselves from further deflationary losses as we enter phase 2 of The Great Unwinding. As the world’s reserve currency, it will tend to benefit from shocks such as we saw last week, but it become vulnerable to greater scrutiny over time once the unsustainability of its own high sovereign debt levels is made clear. The technicals all improved last week and showed prices continuing to move within the rising channel off the December low. Interestingly, Friday’s decline bounced off of resistance at 85, thus suggesting that the Dollar may not be able to break above that level so easily. The 50 DMA is probable support at 81 and that roughly coincides with the bottom of the rising channel off the December low. We are likely to see some consolidation here so it could fall back to 81-82 over the next couple of weeks.
This week looks more subdued as the Sun-Mars anxiety lessens and Mercury changes its direction. I would not rule out another gain in the early part of the week towards 85 but the Sun-Venus aspect on Friday is likely going to restore confidence in the system to some extent. As a result, I would not be surprised to see the Dollar fall back below 84 this week. Next week looks more mixed but again with a negative bias. The multi-planet alignment that occurs on May 18-20 is likely to produce some big moves and generally it seems positive for investor confidence. This should be negative for the Dollar. I should point out, however, that I’m less certain of this outcome than I was over last week’s pattern. If we do in fact see a consolidation in the near term, it is unlikely to take it below 82. The next major move is in late May or more likely in early June and it will be to the upside. This is a very powerful move that could rival the move we saw last week. Depending on how far down we go in May, it is very possible that the Dollar could push to 87-88 in early to mid-June. That would be yet another test of resistance in the rising channel. As risk aversion is likely to grow through the summer as equities get battered, I am expecting the Dollar to stay bullish through to September at least. Early September looks like a massive rally on a scale that even dwarfs what we saw last week.
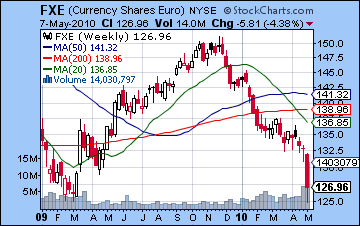 As the old song goes, "nobody loves you when you’re down and out". Despite the EU bailout plan for Greece, investors weren’t buying it as the Euro plunged over 5 cents last week before closing at 1.27. As expected, the nasty Sun-Mars aspect opened the floodgates to 1.30 and then some as more commentators wondered aloud if the Euro would survive at all as a result of the intractability of this debt crisis. It does appear that some fundamental rearrangement will be necessary sooner rather than later, perhaps with Greece withdrawing from the EU altogether. As I have noted for many months, the Saturn-Uranus opposition has lined up exactly atop the Euro’s ascendant and this has greatly weakened it. The technicals are predictably horrible here with high volume on the most recent decline. And we should also note that Friday’s rebound day came on lower volume that the preceding down day, another indication of bearish sentiment. There is a plan afoot by the EU to defend the Euro which will be announced before Monday. That should stem the outflow for the moment. The stars actually don’t look strongly positive in the beginning of the week so even if we see an up day Monday, I would not expect it to continue into Tuesday. However, the overall tone of the week looks positive as the Sun and Venus will form nice aspects to the Mercury-Jupiter square in the Euro horoscope. Look for the gains to continue into the following week with a recovery possible above 1.30. Things should deteriorate after that, perhaps starting on May 24 and the Mars to Rahu aspect in the natal chart. I would expect the Euro to retest its 2008 lows of 1.25 by early June. Meanwhile, the Rupee lost ground last week closing at 45.6 as investors flocked to the US Dollar. It should firm up somewhat this week with 45 possible by mid-May. But look for it to move back towards 47 by early June.
Dollar
5-day outlook — bearish
30-day outlook — bullish
90-day outlook — bullish
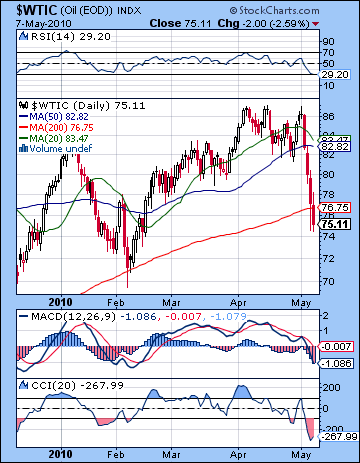 With financial markets in free fall last week, crude oil was sideswiped by the stampede out of risky assets as it plunged over 12% closing around $75. This bearish result was in keeping with expectations as the Sun-Mars aspect generated high levels of fear throughout the economy. I was also correct in my call that Monday could see gains as crude traded again at its yearly highs of $87 before closing unchanged on the day. After that, prices fell on every day as crude fell through its 50 DMA on Wednesday and then its 200 DMA on Friday. The speed of the decline caught me a little off guard, however, as I did not expect the 200 DMA to be tested until perhaps the end of May. This weakens the technical situation in the near and medium terms as a significant support level has been broken. On the other hand, the rising channel from the lows of July 2009 and February 2010 sits at about $75 here so there ought to be some support at these levels. If it breaks below $74, then it could fall back to the February low of $70 in short order. I don’t think this is likely this week but it could still happen. A retest of $70 is perhaps more likely if we extend the time window to early June. Depending on what kind of rebound rally we might see, the June decline may be nasty enough to retest the July 2009 low of $60. Just to state the obvious, daily MACD is now in a deep bearish crossover and has fallen below zero. CCI (-267) has plunged on last week’s decline and is deep enough that even a rebound rally may not be enough to pull it out of the bearish zone below -100. RSI (31) is also bearish and about to enter the overbought area. In the event of some rebound rally, resistance would likely occur near the 50 DMA at $82.
This week may see crude probe below current levels for another day or two but the overall bias appears positive with gains more likely at the end of the week as Venus conjoins the ascendant of the Futures chart on Friday. Monday and Tuesday appear to be net negative as Mercury will station and reverse direction opposite the Moon-Saturn conjunction in the natal chart. Wednesday could also be negative although that is less certain. I would definitely not rule out $70 (or lower) at some point between Monday and Wednesday this week, although if we happen to get a gain on Monday, the $70 scenario would be less likely. Since the declines could be short lived but severe, I’m less inclined to think the week will be positive overall even if the late week rally takes place. Next week is also looking mostly positive so an interim high is possible around May 20. We can expect the next round of bloodletting to start in the last week of May or early June which should wipe out most or all of the rebound rally. There will be further rally attempts in June and July but they are unlikely to get very far. So I think it’s possible that we’ve already seen the high for the year ($87).
5-day outlook — neutral-bullish
30-day outlook — bearish-neutral
90-day outlook — bearish
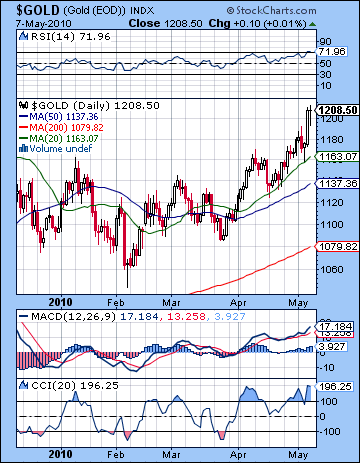 Gold resumed its safe haven status amidst the Euro turmoil and the retreat from risky assets. It rose almost 3% to close at $1208 on the continuous contract, within spitting distance of its all-time high set in December 2009. While I was correct in expecting selling pressure from the early week Sun-Mars aspect, I missed this late week gain on Thursday’s flash crash. Gold fell through Wednesday and touched its 20 DMA around $1160 before Thursday’s reversal. By that time, the Sun had passed over the worst of its Mars effect and it was in a better position to rise. As I noted last week, gold would likely fare better in this pullback owing to the residual strength of Venus in Taurus. To be sure, I underestimated this Venus strength and not even the late week aspect with Saturn was enough to take it lower, although we should note that gold was largely flat on Friday. The technical picture is mostly positive as daily MACD is in a bullish crossover which is now repeated on the weekly chart. However, we can see a number of negative divergences in the weekly indicators which may suggest that gold rally does not have the staying power and may need to correct substantially before again moving higher. I would also note that there is a bearish rising wedge as the line connecting the tops in 2008 and 2009 can be extended to around $1250-1275. The steeper support line connecting the lows back to October 2008 now runs through about $1130-1150. If that support line is broken, then it could spark a significant sell-off perhaps down to the 200 DMA at $1079. This roughly coincides with the February low so that confirms its importance as a major support level.
This week generally looks positive although it also shows some potentially offsetting influences. With Venus transiting through the end of Taurus here, gold should likely stay strong. The Sun is also in good aspect with Venus at the end of the week so that increases the likelihood for gains. However, this rosy transit picture is not unequivocally supported by the GLD natal chart. Here Mars opposes the Moon during midweek so that ought to translate into at least one or two significant down days between Tuesday and Friday with Thursday being perhaps the best candidate for a loss. Nonetheless, the transiting Jupiter is closely aspecting the natal Sun in this chart so it seems unlikely that declines would outweigh gains. In light of next week’s Big Alignment between the 17th and 20th, it is very possible that gold could stay bullish until then with new all-time highs in the cards. I would definitely not rule out a run-up to the top of the wedge pattern to $1250 or $1270 by that time. Prices are likely to collapse in late May and early June so we may see some huge bearishness then as the gold’s luster is spoiled by the conjunction of Venus to Ketu. The decline could be so sharp, we could see the 200 DMA tested ($1079) in early to mid-June.
5-day outlook — bullish
30-day outlook — bearish
90-day outlook — bearish

