Summary for week of May 2 – 6
- Stocks may decline early in the week but likely to recover into midweek
- Dollar may rebound early but midweek looks bearish
- Crude may fall early in week but bounce into midweek
- Gold vulnerable to declines early but recovery likely by Friday
Summary for week of May 2 – 6
- Stocks may decline early in the week but likely to recover into midweek
- Dollar may rebound early but midweek looks bearish
- Crude may fall early in week but bounce into midweek
- Gold vulnerable to declines early but recovery likely by Friday
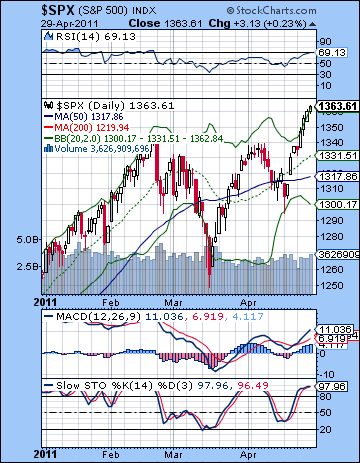 Investors took another long drink at the Fed’s punch bowl last week as Ben Bernanke reiterated his promise of cheap money for the foreseeable future. Amidst the collapsing Dollar and the specter of more inflation, the Dow rose 2% closing at 12,810 while the S&P500 ended the week at 1363. This bullish outcome was not surprising given the favourable midweek alignment of Sun-Venus-Pluto. Monday’s Mercury-Saturn aspect was somewhat negative as expected, although the decline was pitifully small indeed. And I thought there was a good chance that the SPX would break above resistance of its previous high of 1345 and that did in fact occur on the heels of Bernanke’s midweek testimony. I had been unsure about the end of the week, but the bullish mood remained in force as the market rose on both Thursday and Friday. My expectation of a rising market leading into the Jupiter-Rahu aspect on May 7 appears to be coming to pass as there is a seemingly unstoppable momentum in play here as the Dollar sinks and all other assets take up the slack.
Bernanke didn’t offer any surprises last week as he pledged to keep rates low indefinitely and to end QE2 at the end of June as planned. The market reaction was also fairly predictable as the Dollar continued to sink lower while all other asset classes rose, including treasuries. This was perhaps not quite the reaction Bernanke was seeking since a lower Dollar will continue to stoke the fires of inflation. But as long as the Fed thinks the current inflationary pressures are temporary, there is no need to change its policy. Bernanke may be reluctant to admit it publicly, but it’s a dangerous situation that is threatening to spiral out of control. The question is: how long can the current trends continue? Clearly, this is not sustainable in the medium term. Commodities like gold and silver are setting records with every passing day, while gasoline creeps up towards that psychological threshold of $5 a gallon — just in time for the summer driving season. Bubbles and manias are the stuff of Jupiter-Rahu aspects as Jupiter provides the optimism and Rahu provides the greed. Together, they can push up prices to parabolic levels as we are seeing with silver. Previously, I had been unsure just when the downside of this distorting influence of Jupiter-Rahu would manifest thinking it could occur in April or May. It now seems that the madness could continue for another week or two just ahead of the aspect and then things could change quickly thereafter. That is the most likely scenario right now as a correction may begin by mid-May. Just how severe it may be is difficult to say. Given the extent of the run-up, it could be quite large, although I have overestimated such corrections before (e.g. February) only to be surprised by the dogged persistence of the bulls to buy the dips. We will just have to wait and see.
 The bulls still have control of this market, especially since the SPX broke above resistance of the previous high at 1345. There is a now a greater possibility of a run towards the top of the rising channel at 1380-1385 in May. And of course, the inverse head and shoulders pattern is still very much in play which has a target of 1430. Support is initially provided by the 20 DMA at 1330 or so and below that 1300 will no doubt loom large in the event of a correction. 1300-1310 corresponds with a previous low and is also the approximate level of the rising channel. The indicators are looking less appealing from a bullish perspective, however, as RSI (69) is on the verge of being overbought. It’s also worth noting that the weekly RSI is also at 68 so there is not much incentive for bulls taking new long positions. Daily Stochastics (97) are running up against mathematical resistance while MACD is in a bullish crossover. While the momentum is with the bulls, there may not be much more upside left, or least the market may have to ease off first before going higher once again.
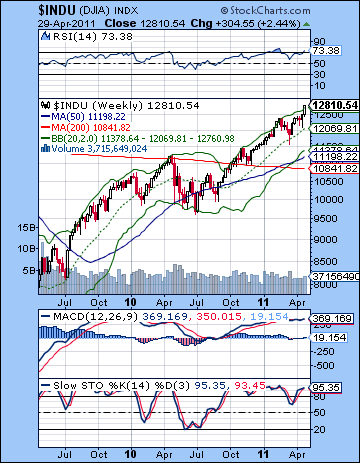
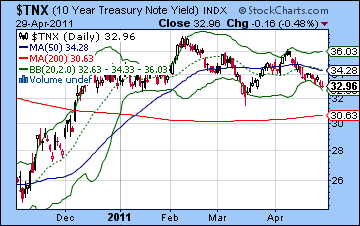
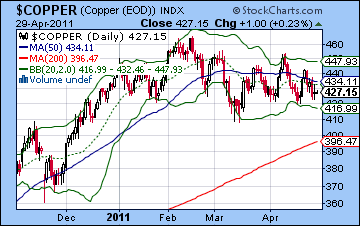
The weekly Dow chart looks even more overbought here as RSI (73) is now above the 70 line. While it could go higher as it did in February (to 77), it does not present a compelling case for taking new positions. On the other hand, the Dow did break above the falling trend line off the 2007 high when it closed above 12,580. This could conceivably become support in the event that the rally gains momentum in the coming weeks. I don’t think this is likely but it will be a level to watch. Another support level worth watching will be the 20 WMA at 12,069. This has acted as support for the two previous pullbacks in this rally. A close below this line would be a signal that the correction will be fairly large. The 200 WMA at 10,841 remains a potentially important source of support in the event we get a sizable correction. Resistance is likely around the psychologically important level of 13,000, which also lines up fairly closely to the rising channel that connects the previous highs. Meanwhile, the intermarket divergences continued for another week as the 10-yr treasury yield fell again despite rising stocks. Normally, yields move in tandem with stocks and usually telegraph equities’ future direction. Despite the bullish momentum in stocks, falling yields is one reason to expect that a correction may not be far off. Yields may have to slip below the previous low of 3.20 before such a correction takes hold. Copper is another indication that trouble may lie ahead for stocks as it showing a negative divergence. The 50 DMA is now resistance and if it breaks below the previous low of 408 it could quickly fall to 365.
 This week may well see a continuation of the rally although the early week has a somewhat larger probability of a pullback. On Monday and Tuesday, Mars will move past Jupiter and be in aspect with Rahu. This can cause sudden situations which are marked by fear or an excess of energy. In addition, Mars enters Aries on Tuesday so that is another somewhat more bearish influence. The rest of the week could be more positive as Venus approaches a conjunction with Mercury. This will not be an exact aspect so we need to treat it more cautiously. Nonetheless, I would expect a bullish bias to remain in place for much of the week. Friday is somewhat more suspect, however, as the Moon joins Ketu so we could have a down day at that time. A more bullish scenario would be a modest decline on Monday to 1350 followed by a reversal higher on Tuesday that carries into Friday. As painful as it is to think about, this could test resistance at 1380. Even if Friday is lower, there is a good chance that the market will finish higher for the week. A bearish scenario would see a steeper sell-off into Tuesday perhaps below 1340 and testing that support from the 20 DMA. Admittedly, that seems like a tall order given the amount of froth in the market here but it is possible. Then a recovery is likely going into Thursday that returns the SPX to current levels. Friday would then be lower and would create a losing week. I would lean towards the more bullish outcome, if only because this rally has become an unstoppable beast. If we do get to resistance, at least that might hasten some kind of pullback. In any event, it does look like the market is getting close to a significant inflection point.
 Next week (May 9-13) has a good chance to mark a significant reversal in the trend — at least for a short while. Jupiter is in exact aspect with Rahu on Saturday May 7 so that could set the stage for something significant. The early week is likely to be bullish on the Mercury-Venus conjunction so higher highs are possible here. But both planets will then conjoin Jupiter while in aspect with Rahu so it is conceivable that we will see sharp gains followed by sharp losses. As the faster-moving planets Mercury and Venus move past Jupiter, much of the air will escape from the balloon and we could see a large decline. Of course, it’s possible that the market will experience only a modest pullback here of 5-10% and will begin to move up once again. I would not rule out such a possibility although I think that has a rather smaller probability of occurring– like 20-30%. The more likely scenario is that the market tops out in the first two weeks of May and then reverses lower for at least three weeks. This could send stocks lower by greater than 10%, and perhaps up to 20%. We shall see. A bottom may occur in early June, perhaps around the Saturn direct station on June 13. That’s very much a guess, but it is still a potentially significant turn date. At that time, Jupiter will be in close aspect with Neptune, then Uranus and then Pluto. This is likely to fuel some upside in the market will will carry into July. Another correction is likely to occur starting in August that will carry over into September. This is likely to erase any gains made in June and July and may therefore retest lows made in early June. The fall looks very mixed with more weakness due in December and into January. Overall, there seems to be significant downside risk for the rest of 2011. While I would not rule out some significant rallies between now and December, I don’t think the market looks stable enough to justify maintaining large medium term long positions. The Dollar is likely to stage a significant recovery in 2011 which will likely put added pressure on equities, especially in Q4.
5-day outlook — neutral-bullish
30-day outlook — bearish
90-day outlook — bearish-neutral
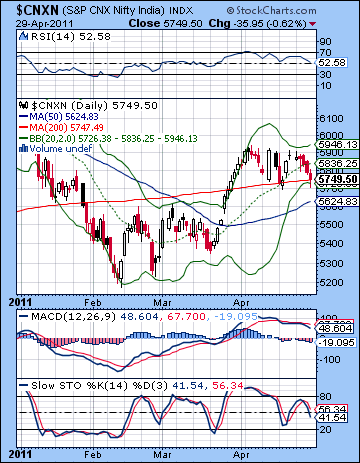 Stocks tumbled last week as rising food prices increased the likelihood of further RBI interest rate hikes down the road. The Sensex lost more than 2% closing at 19,135 while the Nifty finished at 5749. This bearish outcome was somewhat unexpected as I thought we would have more midweek upside around the Sun-Venus-Pluto alignment. To be sure, the early week seemed to offer more in the way of negativity on the Mercury-Saturn opposition. Monday was indeed slightly lower but Tuesday’s rally attempt was quite feeble as the indices actually closed lower. In the wake of Bernanke’s pledge to keep US interest rates low indefinitely, sentiment turned more bearish on Wednesday and that continued into Friday. While I had allowed for more late week downside, the absence of any preceding rise meant that resistance was barely tested and stocks headed lower into a key support level.
Inflation remains the watchword here as the easy money from the US Fed continues to wreak havoc in emerging markets such as India’s. This is very much symptomatic of the approaching Jupiter-Rahu aspect in early May. Growth and expansion (Jupiter) is increasingly seen as distorted or unsustainable (Rahu) as investors are again factoring in the damage such spiraling prices will have on the corporate bottom line. While some stock exchanges have suffered as a result of the Fed’s inflationary policy, others in the developed world continue to rise. Other asset classes such as gold, silver and oil are also serving as an inflation hedge as the US dollar is falling lower with each passing week. It’s clearly a dangerous and unsustainable trend that will likely turn out very badly in the end. From an astrological perspective, it is important to recognize that the Jupiter-Rahu aspect can have a variety of effects. Some assets may rise in value as speculators (Rahu) take control and drive up prices. Other assets such as Indian equities may fall as the downstream implications of inflation and the Fed’s market distortions are already showing up on investors’ radar. More generally, the Jupiter-Rahu combination can correspond with bubbles, manias, and sudden price reversals. The most likely scenario here is that most assets will continue to rise ahead of the exact aspect on 7 May. Once it begins to separate, however, there is a much greater chance for market instability. Declines will be more likely as the speculative frenzy will lose energy and the grossly inflated prices may quickly come back down to earth. Stocks in India have already fallen substantially in 2011, so they are perhaps less likely to suffer major damage as a result of the aftermath of this aspect. Nonetheless, the next few weeks are more likely to see a return of the kind of volatility that characterized January and February.
 Bulls suffered a setback last week as the Nifty could not break above resistance at the falling trend line at 5900. This also corresponded with the upper Bollinger band and was a signal of anxiety amongst the bulls that they wanted to sell their positions lest they be caught in any larger downdraft. But it was not all doom and gloom for the bulls as Friday saw a successful test of the 200 DMA. Intraday prices traded below this level but investors bid up prices so that the close was actually above this level at 5747. As long as the Nifty stays above this level, the bulls can claim some control over the market since the 200 DMA marks the most fundamental dividing line between bullish and bearish trends. At the same time, however, MACD is still in a bearish crossover and continues to move lower. RSI (52) is also slumping and now displays a distinctly bearish pattern of lower highs since it peaked at the 70 line. Stochastics (41) appears to be heading lower although a reversal higher is almost equally likely.
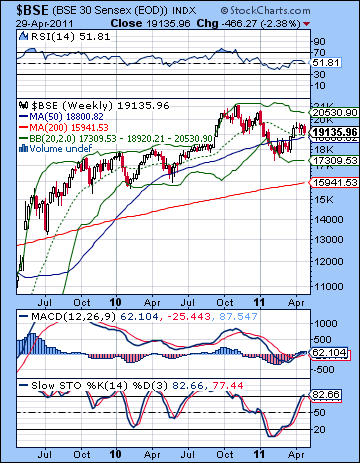
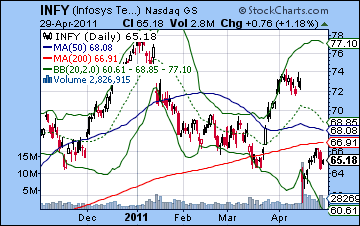
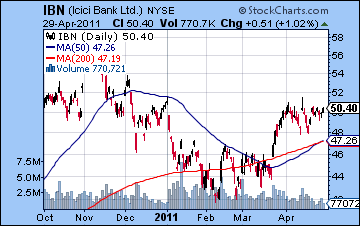
The BSE weekly chart shows just how the current situation is poised to break in one direction or the other. After the March rally, the bulls pushed prices above the 20 and 50 WMA. So far, those lines are acting as good support levels. In fact, they are about to converge and thus may act as an equally important dividing line for the market going forward around 18,800-18,900. A weekly close below this level would seriously weaken the bullish case and might hasten a test of still lower prices around the 200 WMA at 15,941. RSI (51) is still in a series of falling peaks so that is a more bearish indicator. Stochastics (81) have moved into the overbought area so that also would tend to suggest that any further upside would be somewhat less likely. By far the most important level for the bulls to target is 19,700 which is the falling trend line off highs. If this is not broken to the upside, then the market will be more likely to suffer a more serious correction. Infosys (INFY) continues to show the vulnerability of certain sectors of the market as last week’s rally failed to reclaim the 200 DMA. This was perhaps no surprise since it was only one week off its disastrous sell-off. Nonetheless, the 200 DMA will loom large here in the future as many investors will long positions may sell into any rally below that level. ICICI Bank (IBN) is still trading in a narrow range after moving above support from its 200 DMA. Its most immediate task will be to close above its early April high. Until it does, the stock may be susceptible to declines although they are likely to be arrested by the 200 DMA for the moment. From a longer term perspective, it may be retracing to its neckline from the original head and shoulders pattern. If it can close above 54, then it would invalidate the pattern and be in a better position to break out higher. If it cannot close above its neckline, then it is more likely to retest the February lows.
 This week looks like a mixed bag of influences as declines may be more likely to occur on Monday and Tuesday. The focus here is the Mars-Rahu aspect that is exact on Tuesday although it may well manifest on Monday. An additional problem is that Mars enters Aries on Tuesday so that may increase the potential bearishness. Once Mars has moved out of range of Rahu on Wednesday, there is a better chance for gains. Venus approaches Mercury by Friday so that may well correspond with gains later in the week. The difficulty here is that the Nifty is now sitting at a key support level so this makes an early week decline somewhat less likely. So we have a situation where technical analysis is somewhat at odds with the astrological analysis. When these two sources of information are in conflict, it’s best to be remain cautious and be open for any outcome. If the market does fall early in the week, it would seriously weaken the bulls. Any rebound later in the week would therefore likely only return the Nifty to that 200 DMA level which may now act as resistance. I tend to favour this bearish (astrological) scenario so that we see 5700 broken on Monday and Tuesday with a possible test of the 50 DMA at 5624. A rally back to 5750-5800 is therefore more likely by Friday. A more bullish scenario would see a very modest downturn in the early week followed by a rally towards 5850 by Friday. This bullish scenario is still quite possible.
 Next week (May 9-13) looks more bearish, especially at the beginning of the week. That said, I do admit that the Mercury-Venus conjunction on Monday could well be bullish. In that respect, there is a degree of uncertainty here. The midweek could see some recovery as Mercury and Venus run into Jupiter. The following week (May 16-20) looks bearish again especially in the early week. This decline could be substantial, and I would not be surprised to see 5400 tested. The rest of May could be sideways although there could be a bearish influence near the Venus-Mars conjunction on 24 May to mark a short term lower low. June looks mixed with gains likely up until the 10th. Another move lower will likely follow for the next week, however. A more sustainable rally is more likely in late June and into July which could bring the Nifty back to its recent trading range of 5400-5800. The rally will likely last into early August but weakness will accompany the Saturn-Ketu aspect in late August and into September. This could well test the lows of the year (wherever they may be). Some recovery is likely in October but the last two months of the year look bearish again. I would not be surprised if we see an even lower low in December and January, although that is not at all certain. I would suggest, however, that a bullish scenario seems unlikely. In that sense, the Nifty looks like it will have a better chance of testing 4000 in December than 6000.
5-day outlook — neutral-bullish
30-day outlook — bearish
90-day outlook — bearish-neutral
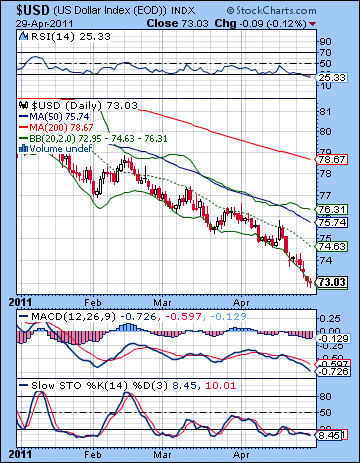 Just how bearish can a currency get? With the Fed’s promise of low rates for the indefinite future, the dollar continued its slide towards oblivion last week as it touched a lowly 73 on the USDX. The Euro rose in kind closing above 1.48 while the Rupee advanced to 44.25. This was a disappointing outcome to say the least as I thought we could see some upside in the dollar. Bullish looking aspects are not delivering the goods anymore for the dollar as it remains locked in a more negative field of influence. I must admit I am stumped as to why the astrological factors are not proving to be useful here. Clearly, I am missing some medium term factor that is nullifying the effects of the shorter term influences. The technicals look truly awful for the dollar right now, but it is increasingly its appeal as a contrarian play. RSI (25) is entering into a forbidden zone, while MACD and Stochastics are in very bearish situations. While this state of affairs cannot continue indefinitely, it is unclear when it can turn around. More importantly, it is unclear what technical signal one should look for such a reversal. The rising trend line off the 2008 lows was broken three weeks ago. The 2009 low was broken last week. Now the 2008 low of 71.5 may well be the next stop for the dollar. If the dollar continues to fall into this level, there will likely be another rally attempt as buyers step in to reverse the course of the greenback. It seems a little too obvious, but it is certainly possible. We can see that the dollar has actually broken beneath the falling trend line here, a possible sign of capitulation and and indication of a reversal higher in the near term.
This week offers yet another possibility for gains for the dollar, especially early in the week on the Mars-Rahu aspect. This aspect may also be significant because it will activate a sensitive point in the Euro horoscope. For this reason, the chances are somewhat greater for dollar gains on Monday and Tuesday. Of course, I have been wrong before about a possible up day so we’ll have to wait and see. The midweek may see the dollar slip back a bit as Venus approaches Mercury. This may help out the risk trade and boost foreign currencies. Friday could actually see another gain for the dollar, although the usual caveats apply. I seem to be missing something from my currency analysis lately, so the prospect for a bounce in the greenback should be seen as somewhat less than "probable". My best guess is that we could see it reverse back up to 74, at least briefly. Next week also looks bullish for the dollar, at least on paper. We will see the immediate effects of the Jupiter-Rahu aspect here as well as the subsequent impact of the Mercury-Venus-Jupiter conjunction that is likely to represent a turning point of sorts for the market. It is quite possible we will see a major currency move here with the dollar as the likely beneficiary. It seems unlikely that such an alignment of planets could correspond with a huge sell-off in the dollar. Given how beat up the dollar has become, a reversal higher is the more likely scenario. Further strengthening is quite possible in late May and into June. Saturn returns to direct motion on June 13 so that may mark a period of extreme strength for the dollar. July is likely to see a retracement lower as Jupiter aspects Uranus and Pluto. This will enhance the risk trade and once again put the dollar out of favour. Another extended rally for the dollar seems most likely in August and September and then again in December and January. We could see the Euro back down to 1.21 by that time as the USDX reaches resistance at 88.
Dollar
5-day outlook — neutral-bullish
30-day outlook — bullish
90-day outlook — bullish
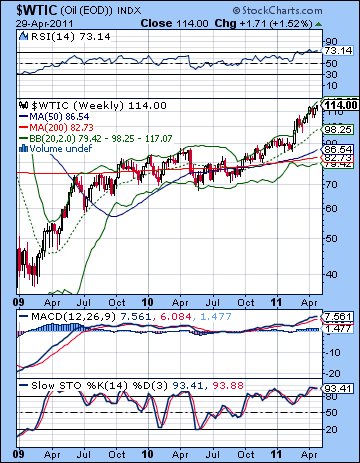 As the Fed continued its undeclared dollar devaluation policy, crude oil enjoyed modest gains closing near $114 on the continuous contract. This bullish result was not unexpected as I thought the midweek Sun-Venus-Pluto alignment would likely take prices higher. We also saw some mild weakness in the early week Mercury-Saturn aspect and this broadly conformed with expectations. While crude closed at new highs, it’s really sitting on resistance on the upper Bollinger band. A reversal lower this week would significantly embolden the bears, although one should be cautious to use that term when discussing the crude oil market. There has been very little bearishness here for some time. Daily RSI (67) has climbed up close to overbought territory although the chart now shows a series of declining peaks — a possible bearish indication. MACD is flattening out here and is on the verge of a bearish crossover while Stochastics are back above the 80 line. It’s still a very bullish chart. The 20 DMA seems to be acting the prevailing source of support lately so we should watch this line ($110) in the event of any future pullbacks. A close below the 20 DMA would be more convincingly bearish and might suggest that the rally was finally over or at least subject to a genuine correction. Until crude trades below the 20 DMA, though, the momentum looks positive. Long term support can be found in the rising trend line off the 2008 lows and now comes in around $96. This could be a difficult line to break in the event of a correction and it may take more than one attempt.
This week may well begin negatively for crude as Mars is in aspect with Rahu on Monday and Tuesday. The reliability of this bearish influence is somewhat increased since Mars will be in the bearish 12th house in the Futures chart. Some midweek gains are likely due to the Venus-Mercury influence so some of those declines will be neutralized perhaps by Thursday. The end of the week looks bearish again, however, on a Mars-to-Mars conjunction in the natal chart. Overall, crude may finish fairly close to current levels, somewhere between $112-116 perhaps. I would retain a bullish bias here nonetheless, since the Jupiter-Rahu influence will likely be in play for another week and it usually encourages speculative activity. Next week looks more bearish, however, as Jupiter passes through the Rahu influence. Mercury and Venus will conjoin Jupiter in early Aries so this may weaken crude oil. Recall that some of the recent rally has occurred while several planets transited the watery sign of Pisces. Now that planets will leave this sign, it may correspond with declines in crude. Declines are perhaps more likely around the 12th and 13th. The second half of May is likely to see further declines. Just how far crude will fall here is an open question. We will likely see that channel support at $96 tested at some point along the way. Since the correction will likely last into June, the earlier this support gets tested the more likely it will be broken at some point in the correction. The correction will likely last until at least mid-June.
5-day outlook — neutral-bullish
30-day outlook — bearish
90-day outlook — bearish
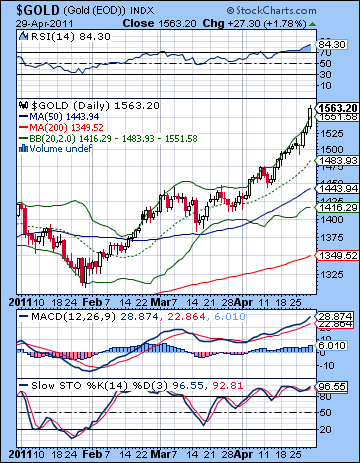 As Bernanke threw the dollar under the bus (again) last week, gold climbed higher closing above $1560. While I thought we would see some midweek upside, I misread the late week indications as gold soared in Friday’s session. Gold is now pushing up against resistance in its rising channel dating back to 2009. While higher prices are still possible, the air is pretty thin up here as rallies above $1570 may frighten some bulls into taking profits. Support in this rising channel now stands near $1400 so we will watch that level closely when the correction finally arrives in May. Both the daily and weekly charts look very overbought now. The weekly RSI is 78 and is roughly on par with previous RSI highs. The weekly Stochastics (98) are reaching nosebleed territory and does not encourage the taking of any new long positions. Daily RSI is now at a lofty 84 and this is also comparable to previous price spikes in late 2009 and late 2010. In other words, there are no good technical reasons for taking a long position as the market may well in in the midst of a blow-off top. So while higher prices may still occur in the coming days, there is a greater risk of a sudden price collapse soon after.
This week may well see further gains as we head into the heart of the Jupiter-Rahu aspect. Speculative excesses are more likely around this aspect, as are sudden reversals. Monday and Tuesday feature a Mars-Rahu aspect that could take prices lower, perhaps significantly. Once this influence passes, gold may rise again into midweek. The late week period is harder to read with influences in both directions. While we could see some downside this week, the possibility of a rebound suggests that prices will probably stay high. Next week increases the probability of a major reversal lower as Jupiter will move into exact aspect with Rahu. Mercury and Venus will also conjoin Jupiter on Wednesday so that is another possible turning point. It may well be that gold rises into Tuesday-Wednesday before declining afterwards. That would perhaps be the most likely scenario. Alternatively, we could peak this week and so the alignment of the 11th might represent a lower high which then triggers a larger sell-off. The second half of May looks very bearish indeed as the GLD chart looks quite afflicted. There is a good chance that gold will test support at $1400 by mid-June and I would not be surprised to see it fall below that level. Gold is likely to rally again in late June and through July. It may well continue into August before gold will tumble once again into September.
5-day outlook — neutral-bullish
30-day outlook — bearish
90-day outlook — bearish

