- Stocks trending down on Sun-Mars aspect
- Dollar to rise on safe haven status; probably closing above 82
- Gold to weaken by midweek
- Crude oil more vulnerable to declines after Monday
- Stocks trending down on Sun-Mars aspect
- Dollar to rise on safe haven status; probably closing above 82
- Gold to weaken by midweek
- Crude oil more vulnerable to declines after Monday
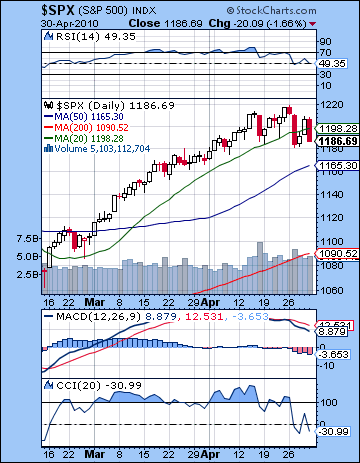 Stocks slumped last week on worries possible criminal charges against Goldman Sachs might damage the credibility of the entire financial sector. The Dow dropped 2% to 11,008 while the S&P fell 3% to close at 1186. While I had been somewhat bearish last week, I had been uncertain about just when the declines would occur. I thought that Wednesday’s Sun-Mercury conjunction might be the most reliable bullish indicator and around that the market would rise and then fall. Wednesday was indeed positive, but the gains extended into Thursday as stocks tried in vain to rally back from the early week sell-off. Monday was negative as forecast on the residual energy from the Mercury-Mars aspect. Tuesday, the day of the Saturn-Uranus opposition, ended up being the worst day of the week as prices fell 2%. Although this pullback was a welcome respite from the endless melt-up, I honestly did not expect to see that many fireworks occur right on the day the aspect came exact. Both Saturn and Uranus are slowing moving planets, so their effects can be diffuse enough to manifest several days before or after the aspect. Nonetheless, the presence of this aspect increased the possibility of a stronger sell-off early in the week, which I had noted. I had also been open-minded about the end of the week since Friday’s Mercury-Venus aspect actually looked bullish but with the Sun-Mars was looming not too far off in the distance. As it happened, Thursday was very strong and Friday’s sell-off gave a taste of things to come this week as the Sun moved into aspect with debilitated Mars. So we may have seen an interim top put in on Monday, just one day ahead of the exact Saturn-Uranus opposition. Subsequent activity last week reinforced the notion that the market is much more likely to enter into a significant correction phase here. It is fascinating to see how the three-planet alignment of Saturn (4 Virgo), Uranus (4 Pisces) and Neptune (4 Aquarius) are each playing their parts in the various financial dramas in the world today. In Europe, cautious and disciplined Saturn is personified by the German government and its wish to compel Greece to follow ever stricter austerity measures before a bailout is reached. Greece embodies perhaps a bit of Uranus (freedom, rebellion) and Neptune (deception) as the true nature of its free-spending ways was hidden from other Eurozone members by some creative accounting by none other than the other star of the show this week, Goldman Sachs. The SEC (Saturn) wants to rein in Goldman and all the speculative excess of Wall Street (Uranus) in order to prevent the kind of fraud (Neptune) we saw in the sub-prime housing crisis.
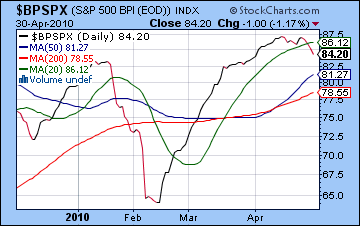
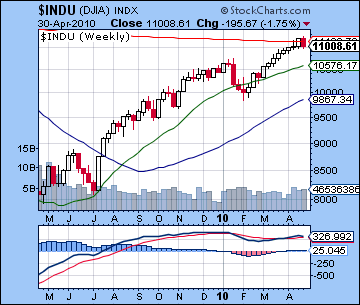 Last week I wondered if the market had enough left in the tank to rise above the resistance level of 1220. It didn’t. From a resistance perspective, the rising wedge held firm as an early rally attempt Monday failed as the S&P bounced off 1220 and ended lower. This test has increased the importance of that resistance trend line going forward so that any future rallies may find it tough slogging beyond that level. The week was bearish, however, so the bottom of the wedge did not fare so well. Tuesday’s decline broke below the 20 DMA which was very close to the support line from the February low. The midweek rally then broke above the 20 DMA but Friday’s plunge again took the S&P below its 20 DMA. It was a very bearish end to the week since there were intraday opportunities to close above this line but in the end, the plethora of bad news and uncertainty carried the day. The market has currently retraced about 61% of its decline from its 2007 highs which is a nice round number in the world of Fibonacci. It may be that enough traders are taking that as a sign that a correction is in order here and are taking money off the table. Certainly, there is no shortage of other technical indicators to encourage that view. Daily MACD in the S&P is falling sharply and in a pronounced negative crossover. CCI (-30) is now in negative territory although it has yet to enter ‘bearland’. RSI (49) is similarly negative but not yet officially awful and it shows a series of progressively declining peaks. Weekly MACD on the Dow still reveals the equivocal picture of a bullish crossover within a negative divergence. And even after this rather bearish week, sentiment indicators such as the $BPSPX are still up in the stratosphere near 85. From a contrarian perspective, this high reading is a sign of extreme complacency and an overbought market. Key support levels remain near the moving averages, with a possible rally above the 20 DMA still quite possible early next week as the bulls make another attempt to push prices up. The 50 DMA around 1165 should be seen as a potentially important support level since it could limit the damage and make any correction quite short in duration. I don’t expect this level to able to withstand the selling pressure I am anticipating this week but it will be interesting to see how many tries it takes to break below it. The January correction sliced through it like it wasn’t even there, although prices started off closer to it at the high. The 200 DMA at 1090 is perhaps a better support level since it has a more likely chance of figuring into the price action. It may be asking a little too much to see that tested this week but it is not out of the realm of possibility.
 This week is another good opportunity for the bears to take control. In the aftermath of the Saturn-Uranus aspect, we may see the market continue its negative trend as there are several faster moving aspects that do not look very positive, at least on paper. The key aspect here is the Sun-Mars square which comes exact on Tuesday morning just before the start of trading, but will be within range for much of the week. Calling individual days this week is made more difficult by the fact that there will be so many minor aspect in play. Besides Sun-Mars, the Sun forms a minor but exact aspect to Rahu and Saturn on Monday. That would appear to have bearish implications in itself. Mars is also forms aspects with Saturn and Rahu at this time, so we should be prepared for a fair bit of negativity here. At the same time, the Moon will have passed Rahu by the open of trading in the US so it is possible we could see a reversal higher, at least for the morning. It seems improbable that we could see much of a rise early in the week, but it should not be ruled out. The Moon enters Capricorn for Tuesday, but since it will form several aspects through the trading day, it is more difficult to get a handle on prevailing direction. I would nonetheless assume a negative direction, with perhaps a worsening of sentiment as we move through the day. Venus forms a minor aspect with Saturn and Mars on Wednesday and Thursday and that may also be seen as corresponding with weaker prices with Wednesday standing out as more bearish perhaps due to the t-square with the Moon, Sun and Mars. While Venus with Saturn can sometimes produce gains, this is not certain here. Thursday’s Moon forms an aspect with Jupiter in the midday, so if we are down before then, a reversal in the afternoon is possible. Friday has a somewhat better chance at gains as the Venus-Mars sextile coincides with the Moon approaching Jupiter, albeit at a fair distance of nearly 20 degrees. Overall, we should be lower by Friday, perhaps by a lot, with a possible intraweek low coming sometime either on Wednesday or Thursday. Obviously, take that prediction with a big grain of salt, because the clustering of aspects this week does make things harder to read than usual.
Next week (May 10-14) could begin negatively as Mercury ends its retrograde cycle on Wednesday, the 12th. Some improvement as the week goes on is quite likely as the Sun forms a slow moving aspect with Venus. This aspect culminates exactly on Friday so that may translate into a gradual shift from bearishness back to bullishness. Since the January correction lasted three weeks, it seems unlikely that this correction could actually be over in two weeks. Any rally we may see here in mid-May could conceivably be a shorter rally within a larger correction. Essentially then, we can sketch out two scenarios. First, a short correction that ends May 10-12, followed by a gradual bounce that lasts into June. Second, the first leg of the correction lasts until May 10-12, followed by a rally attempt that only retraces 50-61% of the decline, and then the market heads back down making a low in early June. In both cases, there should be a more substantial rally in June and perhaps July. The following week (May 17-21) features a number of simultaneous aspects that could move the markets significantly. Jupiter will be involved here, so we need to allow for the possibility of gains at this juncture. The end of May looks more bearish as Mars prepares to leave Cancer and enter Leo and Venus conjoins Ketu. I am still agnostic on the possibility of higher prices by July and would continue to describe the odds as 50-50. Let’s first see what kind of correction we see in the near term. August and September remain the crucible for this liquidity-driven rebound rally as the Mars-Saturn conjunction will likely force many investors to rethink their basic assumptions.
5-day outlook — bearish SPX 1150-1180
30-day outlook — bearish-neutral SPX 1150-1200
90-day outlook — bearish-neutral SPX 1100-1250
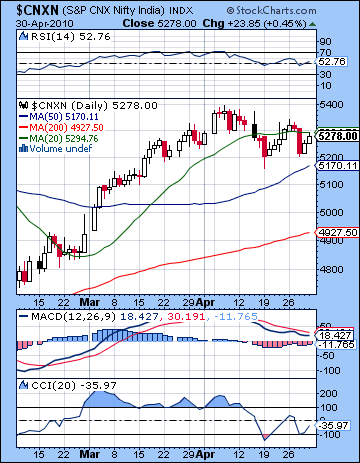 Stocks in Mumbai slipped last week on anxiety over potential global fallout from the European sovereign debt situation. The Sensex lost less than 1% to close at 17,558 while the Nifty finished at 5278. While this mildly bearish outcome was largely in keeping with last week’s forecast, I was off the mark identifying the key days. I had expected Wednesday would be higher on the Sun-Mercury conjunction but it actually turned out to be the big down day for the week as the indices lost more than 1%. In retrospect, I anticipated more selling pressure early in the week on Monday and Tuesday but this negativity may have been somewhat delayed by Tuesday’s Saturn-Uranus opposition. Wednesday’s Full Moon therefore coincided with the decline and increases the likelihood of further bearishness for the course of this lunar cycle. Thursday saw a reversal higher as the Moon transited Libra in good aspect to Jupiter. While I was correct in expecting some declines following the Saturn-Uranus aspect, they arrived Wednesday rather than Thursday. Friday extended the rebound as stocks posted a modest gain. This was not unexpected given the bullish Mercury-Venus aspect as prices moved back up into the rising wedge to close the week. Last week’s activity offers some support to my belief that the Saturn-Uranus aspect could act as a significant reversal point in the market. Although the high for the year occurred close to the Uranus-Neptune aspect in early April, we could be in the next phase of the correction here as prices have generally been lower after this exact Saturn-Uranus aspect. Since this week is likely to start negatively, there is good reason to expect another round of falling prices. We can see how the energies from this rare alignment of Saturn (4 Virgo), Uranus (4 Pisces) and Neptune (4 Aquarius) are manifesting in the financial world today. If Saturn is the planet of control and caution, Uranus is its polar opposite since it symbolizes freedom and independence. For its part, Neptune represents delusion and deception and it also has played in the role in the development of this situation. In Europe, Germany and other fiscally conservative nations are forcing greater austerity (Saturn) on free-spending Greece (Uranus) which only managed to gain entry into the Eurozone by falsifying its balance sheets (Neptune), thanks to some creative accounting by Goldman Sachs. And a similar story is playing out in America with the aforementioned Goldman as the US government securities regulator (Saturn) has charged it with fraud with criminal charges now pending. Goldman represents the very essence of Wall Street speculation (Uranus) but its deceptive actions (Neptune) during the US subprime housing crisis may prove to be its undoing. It’s a toxic brew for the financial world that suggests that significant reforms will be on the way. As the struggle plays out over the coming months, it is also likely to reduce the appetite for risk and be a net negative on markets.
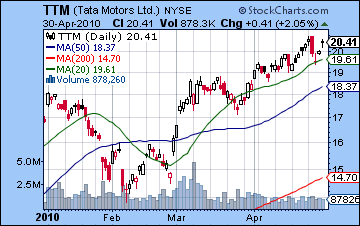
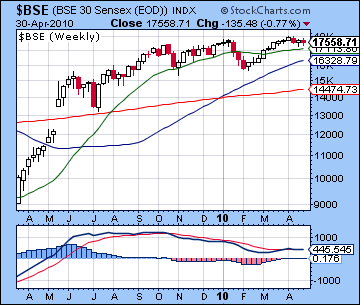 While Wednesday’s decline tested support of the rising wedge at 5200 on the Nifty, the late week rebound confirmed the wedge was still in play. Resistance is still around 5400-5450 and corresponds to the high for the year. This the latest in a series of wedge patterns that developed out of the 2009 rebound rally. Each one has been resolved with a break down of support below the wedge, followed by an new leg higher. The current pattern dates from the February lows and is in danger of collapsing again. Daily MACD is in a bearish crossover, although it is still above the zero line. CCI (-35) is clearly negative but has not broken below the bearish -100 line. RSI (52) is similarly fragile and shows a series of falling peaks. Weekly MACD on the BSE is essentially zero and stuck in a deeply vulnerable negative divergence as higher prices have corresponded with much lower MACD levels over the past few months. Bulls could interpret these indicators as "mixed" but that may be overly optimistic. At least, leading stocks like Tata Motors (TTM) are outperforming the market and do not reveal any obvious defects in their charts. From a momentum perspective, some shares still exhibit healthy signs and these should not be completely dismissed out of hand. Assuming we get more downside this week on the Sun-Mars square aspect, the 5200 level will be an important level of support to watch. This will also roughly correspond to the 50 DMA at 5170. This line has acted as genuine support for previous minor corrections of less than 5%. If prices break below that level here, then we may be testing the 200 DMA at 4927 in the near future. We had a successful test of the 200 DMA on the February low and it is quite possible that we will see that line tested again in May. One thing to look for in the coming weeks is the clustering of the three key moving averages. As these lines converge around the 5000-5100 level, the market may become more precarious as any further corrections could break below all three averages at once. This may increase the scope of corrections in the months to come as momentum players exit the market.
 This week looks quite bearish as the tense aspect between the exalted Sun (20 Aries) and debilitated Mars (20 Cancer) is likely to increase volatility and uncertainty. To make matters worse, this aspect will form near-simultaneous minor aspects with malefics Saturn and Rahu. This is a fairly slow moving aspect so the entire week could be affected. The density of aspects makes the intraweek patterns harder to call, however, although I note a few possible scenarios. Monday has a greater chance of going lower as the Moon is sandwiched between Rahu and Pluto, thus increasing fear and paranoia. Tuesday has a greater chance of gains, especially in the morning as the Moon aspects Jupiter. Whether this is enough to push stocks into the green remains to be seen. By Wednesday, the Moon enters Capricorn opposite Mars so that is another negative influence. On paper, Thursday is perhaps worse than Wednesday as the Moon-Mars aspect is closest, especially in the morning. This increases the likelihood of some bounce by the close. Friday’s Moon enters Aquarius to conjoin Neptune at the open. This could also generate some buying but it is unclear how long it can last. The Sun-Mars square will fall almost exactly atop the natal Mars-Rahu square in the NSE natal chart, so that is another strongly negative factor this week. The Mars contact comes exact on Friday so that is somewhat at odds with the potential for late week gains suggested in the favourable Moon placement. Declines are possible on all five days these week, although I suspect there will be at least one positive day mixed in (Tuesday?), possibly two. Overall, I would not rule out early week gains but it seems likely that the wedge support at 5200 will be broken at some point this week.
Next week (May 10-14) is likely to start off bearish as Mercury will approach its direct station on Wednesday. A rebound is likely to emerge by the end of the week, however, as the Sun will form a helpful aspect with Venus by Friday. Friday itself may be the best day of the week since the aspect will be closest. If we have corrected strongly in the previous week, then this Thursday-Friday period will likely see a sizable move higher. The following week (May 17-21) begins with a massive multi-planet alignment of Sun, Venus, Saturn, Jupiter, Uranus and Neptune. With Jupiter now entering the mix, this could act as a boost to sentiment here as it may neutralize Saturn’s bearish influence. That said, it is still quite possible we could see a large price move on the 17/18. I am non-committal on the direction this might take, but I would lean slightly towards a decline. But even if the rebound is extended here, the end of the week looks bearish again so the market as a whole may not re-enter the wedge formation on this rally attempt. The end of May looks weaker again as Venus leaves the friendly confines of Taurus and conjoins Ketu in Gemini on the 30th. June may begin bearishly, but the market should move higher through to early or even mid-July. Of course, the major question is whether or not we will see new highs made in June or July. I do not have a firm opinion yet since much depends on what kind of rally we see mid-May after the presumable decline in early May. If the correction extends all the way into late May or early June, then that would reduce the likelihood of higher highs by July. In a more choppy scenario, we could see lows made around May 10-12 and then a modest rally with higher lows made around May 31. This would increase the likelihood of higher highs by July. At this point, I would gently lean towards the more bearish scenario of a longer, deeper correction that lasts until late May perhaps bottoming out at 4700-4900. This would translate into July highs of perhaps 5000-5200. But this is anything but certain at this time.
5-day outlook — bearish NIFTY 5000-5200
30-day outlook — bearish-neutral NIFTY 4700-5000
90-day outlook — neutral NIFTY 5100-5500
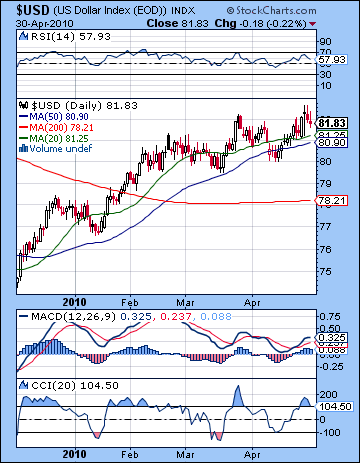 After rising sharply above 82 on Tuesday, the Dollar settled back below 82 by Friday’s close for a modest gain on the week. I had been somewhat neutral here so the result was not too surprising. I thought we could see a large move midweek since the Sun-Mercury conjunction occurred close to the natal Rahu in the USDX chart. As sovereign debt worries continued to plague the Euro, Tuesday was the day of the Dollar’s big rise, just one day before the key conjunction. While I thought a down move was more likely, I had been uncertain which direction the market would go and allowed for gains given Rahu’s unpredictable quality. Interestingly, the Dollar actually fell four days out of five with the single day’s gain tipping the overall result into the positive. From a technical perspective, last week was important for two reasons. First, the Dollar did manage to close above 82 and thus matched its previous high for the year. This was close to a key resistance level dating back to summer 2009. Second, it closed above the critical support line and thus signaled that the medium term rally remained intact. It also closed above the 20 and 50 DMA, both of which have converged around the 81 level. The fact that prices tested the 50 DMA and have once again climbed above it gives more credibility to the bullish case for the Dollar. There is still significant resistance at 82 but it may only take one more rally attempt for that level to fall by the wayside. Daily MACD shows a bullish crossover now, although at lower levels that previous highs. Weekly MACD is still in a bullish crossover so that adds to the medium term bullish case. CCI (104) is bullish, although showing a putative divergence at a level than the previous high. RSI (57) is somewhat more bearish since it reveals a series of declining peaks and thus may signal a turnaround in the near future. But as long as the Dollar stays above 81, the bulls are likely to carry the day.
This week the Sun-Mars square is likely to make the Dollar more attractive as a safe haven. Gains are possible as early as Monday, although we should keep an open mind on timing as the aspect is exact on Tuesday. Wednesday also stands out as a more likely candidate for an up day as the Moon opposes Mars, thus increasing risk aversion. Gains are perhaps more likely on Thursday or Friday, although they are not what I would call "likely". Although the Sun-Mars is separating and thus losing strength, Venus moves into a positive position in the USDX natal chart and aspects the ascendant. This is a bullish influence will at very least would reduce the effect of any declines. So there is a good chance for the Dollar to finally close above 82 for the week with 83 quite possible. Next week looks more mixed but the rest of May seems generally bullish as transiting Jupiter (2 Pisces) will aspect the natal Sun (4 Pisces) and natal Saturn (6 Pisces). While Saturn’s bearish aspect will be in the mix, I don’t expect this influence to completely neutralize Jupiter. Therefore, we could conceivably see the Dollar Index reach 85 by late May or early June. A more significant correction could begin around June 3rd.
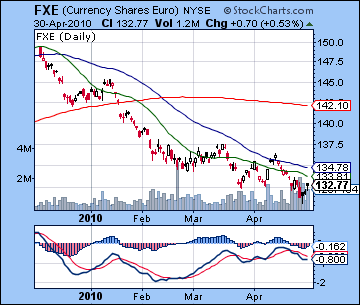 The Euro continued to be buffeted by the debt woes of its weaker members as downgrades of Greece and Portugal further rattled confidence. It ended the week below 1.33, down a cent. Tuesday’s exact Saturn-Uranus aspect on the natal ascendant did perfectly coincide with a big decline but the rest the week was more positive as the Sun-Mercury conjunction increased risk appetite. The basic technical situation of the Euro is unchanged, although it seems to be defying gravity a bit here. It is trading below its 20, 50 and 200 moving averages and down volume continues to exceed up volume in the FXE ETF. We did see a new low for the year below 1.32 last week so perhaps that will open the floodgates down to 1.30. Resistance is likely around the 1.34-1.35 area which is where the 20 and 50 DMA are located, along with the falling trend line. This week the Sun-Mars aspect will likely accentuate the gloom of the Saturn-Ascendant hit in the natal chart and we will see the Euro probe lower. Wednesday perhaps is noteworthy in this respect as the Moon opposes Mars. We could see continued weakness until the first week of June, followed by some kind of recovery into early July. On July 6, Uranus turns retrograde and will begin to approach Saturn for the last time. This is likely to correspond with a weakening in the Euro. Meanwhile, the Rupee largely held its own last week closing at 44.48. This was reflective of continued confidence in the recovery in Asia. Some declines are perhaps more likely this week with a close above 45 very possible.
Dollar
5-day outlook — bullish
30-day outlook — bullish
90-day outlook — neutral-bullish
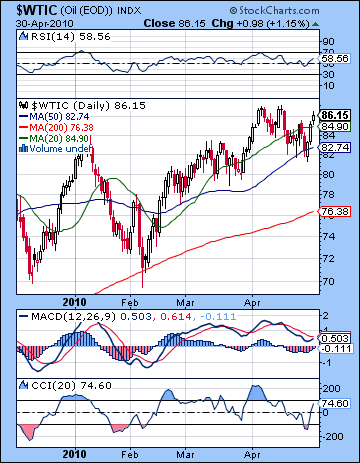 Crude gained more than 1% last week closing above $86 on the continuous contract. I had been more cautious here on the possible bearish fallout from the Saturn-Uranus aspect. I also mistakenly thought we might see gains emerge at the beginning of the week ahead of Wednesday’s Sun-Mercury aspect. In fact, the opposite occurred as crude made its low for the week Wednesday morning at $82 and rallied back from there. In hindsight, I underestimated the bullish effects of Friday’s Mercury-Venus aspect as I believed we would have a more delayed reaction to Saturn-Uranus. However, the market turned out to be bearish on the day of the aspect and reversed on the Sun-Mercury. Even with the late week strength, crude is still in a bearish crossover in the daily MACD chart and is now showing signs of a negative divergence to boot. CCI (76) is positive but not quite fully bullish while RSI (58) shows a series of declining peaks, a sign of growing weakness. Wednesday’s reversal was a successful test of the 50 DMA at 82 and so that line will assume greater importance in the event of any future declines. Resistance is likely found near previous highs of $87 so we cannot rule out another early week rally to those levels.
This week the Sun-Mars square is likely to push prices lower overall. There is a chance for a gain on Monday or Tuesday as Venus forms an aspect with natal Jupiter in the Futures chart. Monday would perhaps be a better bet there. The high number of tense aspects involving Saturn this week means that declines are possible at any time. Wednesday could be quite negative as the Moon opposes Mars. Thursday has a somewhat better chance of closing higher given Moon’s aspect to the ascendant. Retrograde Mercury opposes Moon-Saturn at the end of the week, so that is another factor that will tend to amplify price moves, most likely negative ones. Next week will likely begin bearishly as Mercury (8 Aries) will reverse its direction in opposition to natal Saturn (9 Libra) but sentiment is likely to improve substantially by the end of the week. Whether the correction ends May 10-12 or extends all the way to May 31, there is a good chance we will see a test of the 200 DMA at $76. If the correction ends up lasting 5 weeks until late May and early June, then it seems likely the February lows of $70 will also be tested. Some kind of choppy recovery is likely after that which may last into July but may be unlikely to eclipse previous highs. Look for a sudden and large move down in late July and August as Mars enters Virgo and conjoins Saturn.
5-day outlook — bearish
30-day outlook –bearish-neutral
90-day outlook — bearish-neutral
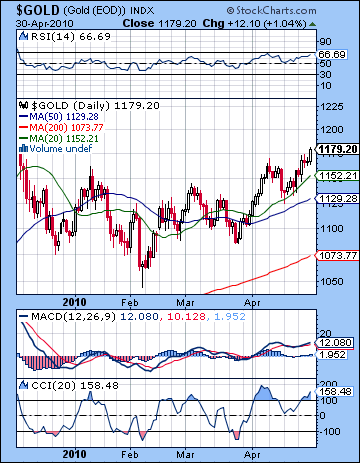 With Euro fears dominating the currency markets last week, gold extended its rise and closed at $1179, up 2% for the week. While I noted the possibility of a close above $1160, I didn’t give proper consideration to all the bullish factors here. Monday was slightly lower as forecast and Tuesday was higher as forecast, although the extent of the gain was surprising. Interestingly, the boost from Mercury’s conjunction to the Sun on Wednesday was minimal as the big gain arrived only on Friday. This was also in keeping with expectations as the Mercury-Venus aspect provided a fertile environment for gold bugs. The technical condition of gold improved with last week’s gain as daily MACD is now in a slight bullish crossover although it may be in a small negative divergence. CCI (158) is very bullish and RSI (66) is on a general uptrend although it, too, is showing signs of a divergence with respect to the previous high. Volume in the GLD ETF looks somewhat tentative as there has not been convincing up day volume in the gains above previous resistance levels of $1160. The weekly MACD chart shows a tiny bullish crossover, which given the downward slope of the line is not the least bit persuasive of any imminent move higher. The next resistance level is likely the previous high of $1220 with good short term support provided by the 20 DMA at $1152. Below that, the 50 DMA at $1130 could act as significant support in the event of a deeper correction, especially since it coincides with the rising trend line off the February low. A break below that line here could send prices abruptly lower. The February low itself at $1050 is a more medium term line in the sand which may spell the difference between gold launching a new leg higher or trending below $1000.
This week is unlikely to see much more upside given the difficult position of the Sun. Mars forms a minor but nonetheless tense square aspect with the Sun midweek which should produce at least one major down day. The other half of the gold equation is Venus. Venus is still strong in Taurus, although it, too, comes into contact with Saturn’s minor aspect towards the end of the week so the downside risks definitely appear to outweigh any upside. Even allowing for another up day Monday, there is a chance gold will test support at the 50 DMA at $1130 although I would not exactly call that probable. Gold should trend lower through to May 12th or so and the Mercury direct station. Another period of strength is likely to follow and last into perhaps to the 17-21st. Look for gold to decline sharply after that with a possible low occurring on the Venus-Ketu conjunction on the 31st. Gold could resume a choppy rise in June and perhaps July after this difficult period. Gold will likely begin a steeper decline in late July or August as Venus enters Virgo, its sign of debilitation, alongside malefics Mars and Saturn.
5-day outlook — bearish
30-day outlook — bearish-neutral
90-day outlook — neutral

