- Stocks vulnerable to declines early in the week; rebound rally likely into mid-June
- Dollar forming a short term top; consolidation in the offing through June
- Gold to move lower this week before next rally attempt
- Crude oil retesting recent bottom then climbing again in mid-June
 After a lot of sound and fury, stocks last week finished mostly unchanged as early paranoia about Europe was smoothed over by China’s reassuring words. While the February lows were successfully tested on Tuesday, the Dow closed only marginally lower at 10,136 while the S&P finished at 1089. While I thought we would end up lower than we did, at least the volatility came to pass in spades. We did see a test of the February lows of 1044 (Dow 9800) as I thought we might, although this happened ahead of schedule on Tuesday instead of later in the week. In retrospect, I thought that Jupiter’s aspect to Saturn was more likely to manifest as early strength but that was pushed back to coincide with Thursday’s Full Moon and the big up day. All this volatility is very much in keeping with the massive planetary energy contained in the alignment of Saturn, Uranus, Neptune and Jupiter. Since these planets all move quite slowly, the effects will play out over several months. Once Saturn resumes its forward motion on May 30, it will again move towards its quincunx aspect with Neptune (June 27) and yet another iteration of its series of opposition aspects with Uranus (July 26). These aspects are like giant cosmic gears relentlessly turning and breaking down everything that stands in their path. This is a once-in-60-year set up of the celestial billiard table and rest assured, it will leave some nasty scars. The last time we saw anything like this alignment was in the 1930s (ahem!) when entire world was plunged into a protracted phase of economic dislocation, along with attendant political and social changes. I don’t want to fall into the easy trap of market sensationalism, but we do have to consider the possibility that our current epoch will produce significant societal re-organization. Needless to say, this climate of economic disruption is not going to be favourable for stocks. At this point, the real question is not whether the market will rise or fall into 2011 but rather which crash scenario will the US follow: Japan with its protracted decline of asset values through the 1990s and 2000s or the relatively quick deflation in the Great Depression that saw US markets form a bottom form in 1932? While both are possible, I would lean towards a faster deflationary scenario with an earlier bottom in stocks forming perhaps in 2011. As uber-bear analyst Robert Pretcher put it last week, we’re in a "wave of recognition" that the fundamentals don’t match the technicals and it’s time to prepare for a "long way down".
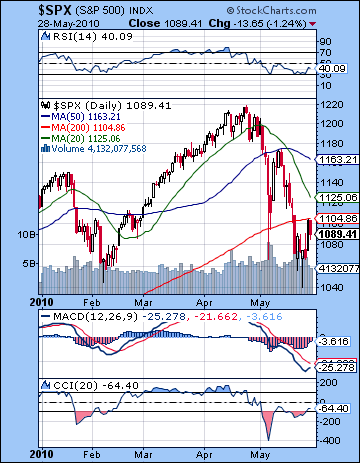 The technical picture has become more mixed as a result of last week’s action. On the bullish side, there are hopeful signs that a bottom — however temporary — has been formed after the successful retest of the February low on Tuesday. The fact that buyers came in and saved the market from total armageddon was evidence that all was not lost. Moreover, the market actually closed higher that day and formed a potential reversal hammer candle. While some might contend that this was not a classic hammer candle since the body was too long, it is nonetheless close. Its long bottom shadow is an indication that buyers took command at levels above the low. Daily MACD shows a small positive divergence as does CCI (-64). It has emerged above the -100 line and matched its previous peak. RSI (40) has similarly bounced higher and shows a positive divergence. However, it needs to continue its upward trend in order to break out of its bearish pattern of a series of falling peaks. Whatever the nutritional content of that bull food, the bears also have their fair share of sustenance. Last week, I noted the critical importance of the break below the 200 DMA. This is one of the simple acid tests between a broadly rising or falling market. Once prices fall below this line, investors become more skittish and are less likely to maintain their long positions in the event of bad news or bad tape action. So despite Thursday’s mega-rally, stocks remain below their 200 DMA and thus have one foot in bear territory. While stocks did rally above significant resistance at 1090, it stopped at 1103 and the 200 DMA and then headed south again in Friday’s session. Future rally attempts will have to be able to move above the 200 DMA or things could turn ugly very fast.
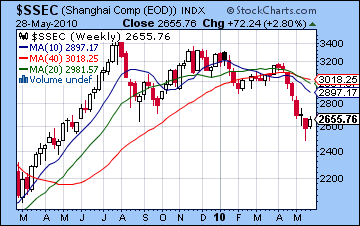
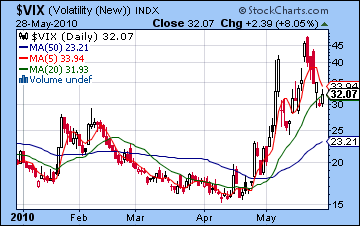
At the same time, I don’t want to go overboard on the importance of the 200 DMA nor make a fetish over its precise level. Prices may rise above it by a few percent but this does not mean that the bulls can rest easy. The converse is also true as prices a few percent below may not necessarily doom the bullish case. A quick look at the Shanghai chart in April shows how this can work. Stocks actually traded on either side of the 200 DMA (= 40WMA) for two months before the bears finally won the fight and took prices much lower. Note that when it traded above the 200 DMA, there was the fateful clustering of moving averages, as well as a lower high. We could see a repeat here, although I suspect it won’t take that long for bears to win the day. We can also see that the $VIX stayed near its rising 20 DMA, a sure sign that volatility remains an issue. A newsletter reader alerted me to an interesting artifact of the VIX chart involving the interaction of the 5 and 20 DMA. Due to the exaggerated moves of the $VIX when markets move, the 5 DMA can become a useful "trigger line" when it crosses the 20 DMA, in a way not unlike the MACD. We can see how the rising 5 DMA crossed over the 20 DMA at the end of April, just at the beginning of the correction. Similar crossovers occurred in January and February during that previous correction. We can see that there is still a bearish crossover currently, but the 5 DMA is pointing down sharply. If it should cross the 20 DMA then that might indicate some kind of rally in stocks. Back testing suggests this only works for larger market moves but it will be interesting to keep tabs on it going forward. We can also point to the ongoing negative divergence and bearish crossover in the weekly MACD in the Dow chart. This does not preclude a rebound rally, but given the medium term momentum, it is unlikely to go too high before it reverts to its mean and continues falling. So while the short term indicators might see a rally, the overall technicals still look pretty bad. If we get another retest of 1040-1050 next week, bulls will try to take prices back above the 200 DMA at 1104. The next resistance level is probably around 1130-1135 which coincides with the falling trend line from the April high. This could also become a place where the rally fades and selling resumes as investors try to get out of the market with the next installment of bad news. Above that, the 50 DMA at 1163 could also mark a significant resistance level. It would not substantially improve the medium term outlook, as it would still be well off the previous high. I would expect any rally that gets that far to be met with an avalanche of selling.
 This week looks like more volatility with a probable retest of 1050 before turning higher. After Saturn and Neptune make their respective reversals this weekend, we will still be very close to this vortex of planetary energy. Mars will form a close aspect to both Saturn and Neptune so significant bearishness seems likely at some point. With Monday’s holiday closing, Tuesday could well be quite negative with a possible retest of last week’s low. The planets are such that I would not even rule out a breach of that low, although that does not seem likely. Wednesday may see a rebound, although Thursday looks less positive as Mars opposes Neptune. Friday may be positive as the Moon approaches Jupiter although the density of these aspects makes predictions for individual days somewhat difficult. Generally, I would expect low prices to prevail earlier in the week with rebounds perhaps more likely as we move towards Friday and next week. Overall, the most likely scenario (60%?) is some kind of down move early to 1050 followed by a rebound. This would complete a bullish inverse head and shoulders pattern comprised of the lows of the 21st (left shoulder) and the 25th (head). This would generate a rebound rally that could take us back towards 1100 or higher by the end of the week. A more bearish scenario would be a violation of 1040 on Tuesday or extended bearishness into Wednesday and Thursday that keeps the S&P below 1050. This is less likely (20%) but still worth contemplating contingencies for. A more bullish scenario (20%) might be that we reverse quickly on Tuesday with minimal downside and head sharply higher thereafter moving well past 1104 by Friday.
 Next week (Jun 7 – 11) begins with a potent three-way aspect involving Jupiter, Uranus and Mars. Jupiter and Uranus are in bullish conjunction so Mars will likely be the spark that lights the fuse and sends stocks sharply higher. Monday has a good chance for a major gain, and Friday also looks fairly positive. Tuesday may be more bearish, however, as Mercury makes an aspect to Saturn. Volatility is still going to be quite high here so we should expect more large intraday swings. We could see generally rising prices until the following week (June 14 – 18) as Venus moves into aspect with the Jupiter-Uranus conjunction on Monday the 14th. This is a very bullish trio of planets converging here so this may well mark a significant interim high. Assuming we don’t fall below 1040-1050 in the coming days, then there is a reasonable chance we could climb back to 1135 or possibly even 1160. Things look much more iffy after the 14th as the Sun enters Gemini and sets up in a square aspect with Saturn. There will be many investors who are searching for viable exit points there and some will regard this rally as their last chance to get out. I would expect quite a bit of selling near the various resistance levels of 1100, 1135 and 1160. Declines are likely to be quite sharp here, although I am not expecting a crash in the second half of June. That said, we’re entering eclipse season in June so that is unlikely to be a calming influence on sentiment. A partial lunar eclipse occurs June 26 and a total solar eclipse occurs on July 11. The market will likely make lower lows into late June and early July culminating in the Sun-Mercury-Ketu conjunction around the July 4 holiday. As a guesstimate, I would say 950-980 might be the next low we see in early July. Then there should be a decent rally into July the third week of July (the 23rd?) which may rebound back to perhaps 1050-1100. After that, we go on full-time crash watch. While I have been mentioning the Mars-Saturn conjunction on July 31 as a key date, I am not expecting any major down move to fall exactly on that date. It might, but from a percentage basis, the steeper fall looks like it will occur in late August or early September. The highest probability of a crash would be around Labor Day, perhaps shortly thereafter. The September lows could range from anywhere from 800 to 920, although that’s only a guess. No doubt some of this outline will be proven wrong, but it lays out how I think this next round of deflationary unwinding could unfold. I will revise and refine it as we get closer to the eye of the storm.
5-day outlook — neutral-bullish SPX 1070-1100
30-day outlook — bearish SPX 1000-1050
90-day outlook — bearish SPX 900-950
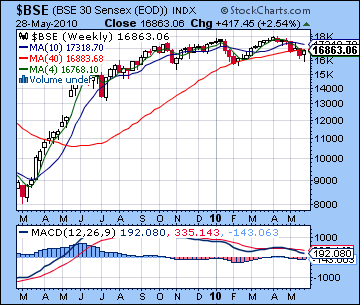 Stocks rallied in Mumbai last week as optimism returned following China’s reassurance that it would continue to invest in European bonds. After trading below 16,000 earlier in the week, the Sensex closed up more than 2% at 16,863 while the Nifty finished at 5066. This outcome was more bullish than forecast as I had expected more downside here, especially later in the week. We did nonetheless see more downside on Tuesday with a retest of the February low as the Nifty closed at 4800. Given the high volatility promised in the planetary patterns, I had also allowed for the possibility of a close over 5000 and that is where we ended up. My call for weaker prices later in the week did not come to pass possibly due to a delayed effect of Jupiter’s bullish aspect with Saturn. The other key factors here were the approaching stations of Saturn (30 May) and Neptune (31 May) which are primarily bearish influences. Although they can be powerful, there energy may not be precisely focused and hence their effects can be felt slightly before or ahead of their time of reversal. The positive ending to the week therefore increases the likelihood of declines upcoming this week. In any event, we are still in the throes of this highly tense alignment that will likely usher in a new round of asset deflation through the rest of 2010 and into 2011. The first phase corresponded with the first Saturn-Uranus opposition aspect and marked the meltdown of 2008. The next phase began in April with another iteration of the Saturn-Uranus opposition, with Neptune thrown in this time for good measure. These aspects are made more potent by virtue of their slower than normal speeds and the proximity to their stations. We will see Uranus make a station on 1 July and begin its retrograde cycle just as it is approaching its final opposition aspect with Saturn on 27 July. In August, Pluto will once again become enmeshed in this configuration of malefics and will likely push down prices further. I cannot overemphasize how unusual and dangerous this alignment is for stocks and the entire global economy. It is a once-in-a-lifetime sort of pattern that has the power to totally upset the status quo and transform societies. As I’ve said previously, India will fare significantly better than most other markets, but it will not escape the damage.
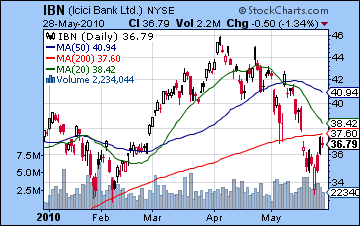
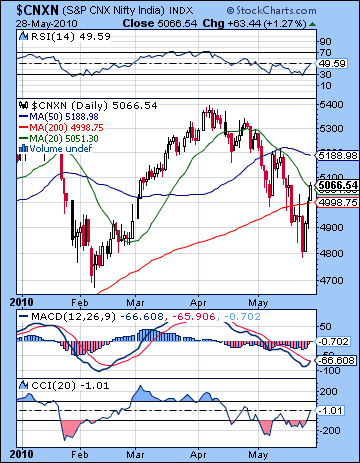 The technicals improved last week as stocks climbed above their 200 DMA by Friday’s close. This was an important development that made the bullish case more plausible going forward. After the successful retest of the February lows, bulls gathered more confidence and were in a better position to deal with resistance levels. While Thursday’s close stopped right on the line (4998), Friday’s exuberant gain sent it higher closing slightly higher than the 20 DMA. Actually, the bulls can point to other technical evidence for further gains down the road. Daily MACD is poised for a bullish crossover here while CCI (-1) is also on the verge of more positive footing. It should be noted, however, that it remains below its peak (around 50) for this correction. Given the depth of the correction, only a reading higher than 50 or indeed 100, would look convincingly bullish. RSI (49) is also showing the beginning of a positive divergence given the similarity of its levels with previous peaks on lower prices. The next level of resistance is likely around the 50 DMA (5188). This is close to the falling trend line off the April high which comes in around 5200-5230. Any push significantly above that line would enhance the bullish argument considerably. This could conceivably happen sometime in June but it may be too ambitious for this week. But the bearish case is still worth considering. Volume fell from 22,000 on the down days early in the week to 19,000 on the up days later on. Rising prices on lower volume is a sign of a rally that may not get far. And the weekly MACD for the Sensex is looking as anemic as ever suggesting that rallies are not sustainable in the medium term. We can still see this ongoing negative divergence along with a significant bearish crossover. This is not a chart that should inspire any confidence in the bulls. And as if to underline the vulnerability of the financial sector in the current situation, ICICI (IBN) failed to close above its 200 DMA on Friday. The stock joined in the gains of the broader market the past week but this is not a good looking chart. The clustering of the moving average lines is alarming and increases the likelihood of a major decline over the next two months. While I think the 200 DMA is a critically important indicator, we can’t expect to read all market moves from it. It is a general guide and should not be over-interpreted. A quick look at the Shanghai chart reveals how the 200 DMA can be used. (See SSEC chart in US Stocks section above). Prices moved close to the 200 DMA for two whole months before finally succumbing to selling pressure. Actually, prices moved 3-4% higher than the line in April only to fall sharply later on. This occurred because of stocks failed to make a higher high from the previous high and thus confirmed the bearish trend. The 200 DMA was therefore one of several indicators that foretold an imminent sell-off. Indian stocks may well repeat this pattern if the next significant rally fails to exceed the previous high. If we see a close clustering of the moving averages and prices not far from the 200 DMA, then all bets are off. A major pullback will be likely.
This week looks like another week of volatility with a distinct downside bias. We could see declines at any point in the week given the transit of Mars to the other planets in the alignment. Early in the week, Mars will form an aspect with Saturn which is likely to correspond with a rise in tension and anxiety. On paper, Monday and Tuesday could offer a more bearish outcome. A close under 5000 is likely, and another test of last week’s low of 4800 is also possible. We could see an up day Wednesday but that is very much a guess as the Moon is lining up against Mars. The end of the week looks somewhat more bullish. Although nominally bearish, Mars opposes Neptune on Thursday with the Moon in close attendance. This could mark a reversal day that leads to higher prices Friday. Overall, prices should move lower and could close below 5000 and the 200 DMA even in the event of a late week rally. It would seem that the best strategy here might be to short rallies near obvious resistance levels while taking smaller long positions at key levels of support.
 Next week (June 7 – 11) looks more bullish as Mars will aspect the Jupiter-Uranus conjunction early in the week. This is likely to spark a large bounce higher on either Monday or Tuesday. The rest of the week will likely also enjoy a positive bias although Wednesday stands out as somewhat negative. The rebound rally will likely stay intact until at least Monday, the 14th. This will coincide with the Venus aspect to the Jupiter-Uranus conjunction. After that, sentiment is likely to become uncertain as the Sun enters Gemini on the 15th and will fall under Saturn’s aspect a few days after that. So how far could a rebound rally go? As a bare minimum, 5% off whatever bottom we might see this week, although I sense it will be somewhat bigger than that. So, for example, if the Nifty retests 4800 this week, then the rally into June 14-18 would rise at least 5050, probably more like 5150 or 5200. Then we will get another leg down going into early July and the conjunction of Sun, Mercury and Ketu. This should break the February lows by 8 July– assuming they haven’t been broken already. We have two eclipses coming up in late June and early July and that will increase the intensity of the afflictions. Then we will likely see another rally attempt for about two weeks in July followed by the main attraction: the Mars-Saturn conjunction on 31 July. August and early September are likely to see the biggest declines this year with the indices falling 20-30% over a 6-week period . We should break below 4000 on the Nifty at some point at that time.
5-day outlook — bearish NIFTY 4900-5050
30-day outlook — bearish NIFTY 4700-5000
90-day outlook — bearish NIFTY 4000-4400
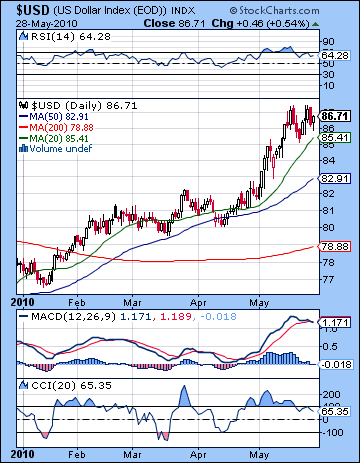 The US Dollar resumed its upward climb last week as the Euro remained an unhealthy fixation for most currency traders. Even after China made all the right noises on Thursday, the Dollar gained more than a cent on the week to close just under 87. This outcome was in keeping with expectations as the intensification of Saturn’s energy put a premium on safe assets. I was off the mark in forecasting gains for the end of the week, however, as Thursday’s decline flew in the face of the supposedly improved circumstance of the USDX chart. It is certainly a busy chart with many powerful aspects occurring simultaneously. On the bullish side of the ledger, the Jupiter-Uranus conjunction is in good aspect to the natal conjunction of the Sun and Saturn. This is part of the underlying strength that the Dollar currently enjoys. More negatively, Saturn is stationing in aspect with the Sun, so it may keep a lid on any gains over the next few weeks. Despite the gains last week, the Dollar’s technical condition worsened as we can see a possible bearish double top forming. Daily MACD is beginning to roll over and has just started a bearish crossover. CCI (65) is fading with a series of lower peaks, as is the RSI (64). The RSI has fallen below the 70 line and may well be entering a retracement phase. In the event of a pullback, the 20 DMA around 86.5 may offer some short term support. More reliable support would probably be found closer to the 50 DMA near 83 since that roughly coincides with the rising trend line from the December low. Volume on UUP, the Dollar ETF, appears to be weakening and recent down moves came on higher than normal volume. This is a bearish signal and a possible sign of lower prices in the near future. From a weekly chart perspective, however, the Dollar still carries significant momentum and hence any pullbacks are unlikely to jeopardize its medium term strength.
This week looks mixed for the Dollar with gains possible in the early going. The Mars-Saturn aspect is unlikely to do the Euro many favors as risk appetite will be diminished. Gains may not last, however, as transit hits to the USDX chart suggest a pullback is more likely later in the week. I think the bears are likely to carry the week. Next week looks more bearish as transiting Mars will impact natal Saturn early in the week while Mercury will get thumped by the same natal Saturn on Thursday. Look for a more significant pullback to get underway here, perhaps moving toward the 50 DMA of 84. Another rally is likely in the second half of the month so we could see 88-90 at that time. It’s difficult to say when we might hit the high of the year. It could be late June or early July or we may have to wait for early September. Certainly September’s rally is going to be something to behold. I would expect the chances are greater for a higher high at that time.
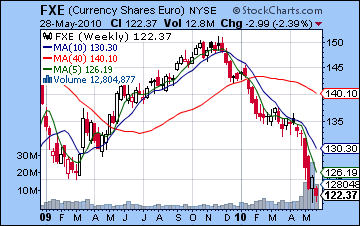 The Euro sank back into the muck below 1.25 last week as Spain’s downgrade made ECB intervention more challenging. I had expected this bearish outcome, but the net result was milder than anticipated. While the Mars influence was clearly a minus, it seems as though the Venus aspect to the Sun provided a significant buffer. The daily FXE chart shows some signs for optimism as volume fell with this week’s decline suggesting that most sellers have already exited their positions. MACD is also forming a bottoming pattern and the beginnings of a bullish crossover. So while some kind of bounce is increasingly likely in the near term, the medium term outlook remains solidly bearish as the weekly chart shows. This week may begin bearishly on the Mars-Saturn aspect. This aspect is likely to highlight negativity in the Euro since Mars is currently transiting its 12th house of loss. This is likely going to test support at 1.21 before heading higher by week’s end. I would not rule out a piercing low to 1.20 or below in the early going. The relief rally should be substantial as a short squeeze is possible going into mid-June. At minimum another run to last week’s high of 1.27 is in the cards, although it may well climb all the way back to 1.30 and the 50 DMA. The situation may deteriorate again by June 18 and the Sun-Saturn aspect. As Saturn once again moves forward, it will cross the ascendant in the Euro chart for one last time. This may be the coup de grace that sends the Euro to parity later in the year. The end of July looks like a complete meltdown as Mars and Saturn conjoin on the ascendant. In astrological terms, it really doesn’t get much worse than that. Meanwhile, the Rupee held its own in an uncertain financial climate last week closing at 46.72. This week it will likely see trades above 47, especially early in the week, but it has a good chance to finish stronger.
Dollar
5-day outlook — bearish-neutral
30-day outlook — bullish
90-day outlook — bullish
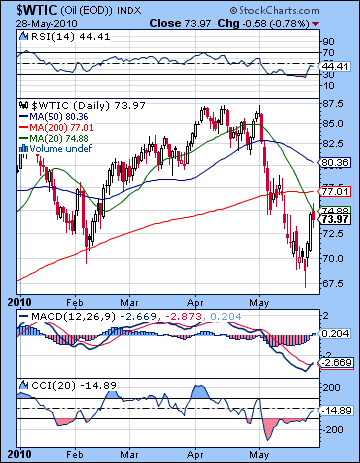 Crude rallied above $74 last week as shrinking inventory data pointed to tighter supply over the high demand summer driving season. I had expected more bearishness here as the late week proved to be positive for crude. I had wondered about the $70 support level holding last week and indeed crude did trade as low as $68 on Tuesday. But the quick rebound and rally into the end of the week gave strength to the bulls as crude regained its recent trading range of $70-76. Certainly, there are more technical reasons for expecting more upside in the near term. Daily MACD has turned higher and is in a clear bullish crossover. CCI (-14) has finally moved out of the red and is trending higher. RSI (44) is also on the rebound and perhaps most importantly is higher than the previous RSI peak on May 13. This is an indication that the rally may have further to go. For the rally to turn into something more substantial over the medium term, it would still have to break above the series of declining peaks. That would suggest a run up to 60 would be necessary for that more bullish signal. Until then, the technicals appear to have temporarily stabilized after being in a oversold condition. Volume indications are mixed as the up volume on the crude oil USO ETF were higher than on down days last week which is a bullish sign. However, the weekly volume was still lower than the previous weeks’ sell-off. This perhaps suggests that more short term gains are imminent but that we’re still not yet in a place where a sustained rally is possible.
This week looks bearish to begin with as the Mars-Saturn aspect on Tuesday and Wednesday seems destined to punish commodities. Another rest of the $70 support is possible here. After that, I would expect a significant rebound rally as Mars makes its way towards the very bullish combination of Jupiter and Uranus. The week could well end up near its current levels, which also happens to be the 20 DMA. The 200 DMA at $77 is perhaps a more formidable area of resistance as this marked the February lows and the initial lows made in the early May correction. We could get there in the week of June 14-18. After that, we should see some consolidation into early July that retests the lows of $68. There is a chance it will fall below this level, although that is unclear. A more reliable scenario for a break down of support occurs in late July when Mars conjoins Saturn. This conjunction will set up in close aspect with the lunar nodes in the Futures chart and has the potential for a sharp decline. The period from late July to early September looks to be the most bearish for the year and should correspond with declines of 20% or more. Of course, the hurricane season will be full swing at that time and oil prices are often connected to possible interruption of production in the Gulf of Mexico. This year’s hurricane season is forecast to be worse than normal but the astrology here shows a clear picture of falling prices, at least in the windows I have specified. It may well be that crude does not fall as far as other commodities, but any weather-related disruption will not be enough to reverse this trend.
5-day outlook — neutral-bullish
30-day outlook — bearish
90-day outlook — bearish
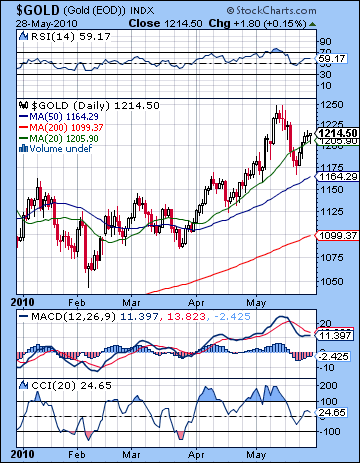 Gold rallied back over $1200 last week on lingering Euro worries closing at $1214 on the continuous contract. While gold investors hit the eject button at the height of the Euro panic, it may be the yellow metal is better suited to a more modest level of concern over the world currency regime. Last week’s bearish call was about as wide of the mark as you can get. I allowed for early week gains and we certainly got some as gold closed above $1200 by Tuesday’s close. But we didn’t see any selling pressure at all later in the week as I had expected. Mars entered Leo on Wednesday and while that may have moderated the gains, prices extended their rise. As disappointing as the missing sell-off was, we should note that Mars stays in Leo until August 19. This is likely to be a negative influence on gold since gold has a symbolic association with the sign of Leo and the Sun. In any event, the technical situation remains mixed. Daily MACD is in a bearish crossover although there are signs of a positive divergence forming there. CCI (24) is in a grey zone with no obvious direction. RSI (59) is bullish but perhaps showing signs of flagging momentum. A head and shoulders top is also possibly in the offing here with one more push higher. Despite the mid-May correction, gold has rallied back to its 20 DMA. This is a considerable achievement that should not be ignored. Nonetheless, it has only managed to push back up to its previous support channel from the recent parabolic rally. For this reason, this line should be seen as possible resistance in the near future. The first level of support is likely to be close to the 50 DMA at $1164. This also coincides with the rising trend line from the 2008 lows and hence it should enhance its significance. If we see a decline here, it may well test this support once and then rally higher. I doubt that such a formidable support level would be broken without at least two tests.
This week looks bearish for gold as the possible fallout I predicted for last week remains in effect here, especially at the start of the week. The Mars-Saturn aspect is unlikely to push prices higher and could well send them tumbling. I would expect a retest of the May lows of $1170 and also the 50 DMA at $1164. It’s conceivable it could break below but it is unlikely to stay below for longer than a day. The most likely scenario would be a two-day plunge that breaks below $1180. Look for buyers to come in by the end of the week at the latest. We should see another significant rally going into mid-June and the Venus-Jupiter-Uranus alignment on the 14th. This looks sizable — at least 5% — and could mark another return to current levels. From a technical perspective, this could set up a situation that intimidates bulls since the all-time high will recede into the background. I think gold has further to fall in 2010 so it is important to speculate on the possible technical scenarios that could precipitate such a decline. A series of declining interim tops would certainly be one possible bearish pattern. Similarly, a double top at $1250 in mid-June would also prompt a sell-off. The low of the year may well occur in September as gold gets burned by the next round of asset deflation. Last year, I had entertained hopes that gold might revisit its 2008 lows sometime in 2010, but that now seems like a pipe dream. At this point $1000 might be a more reasonable downside target and we may well not even get to that level. Look for gold to start moving up after September, as the US Dollar is likely to weaken through Q4.
5-day outlook — bearish
30-day outlook — bearish-neutral
90-day outlook — bearish

