- Gains likely Monday followed by declines midweek on Mars-Ketu; some recovery likely by Thursday’s close
- Dollar to strengthen midweek but possible weakness on Thursday or Friday
- Crude mixed to bearish especially midweek
- Gold subject to significant decline midweek, gains more likely Monday and Thursday
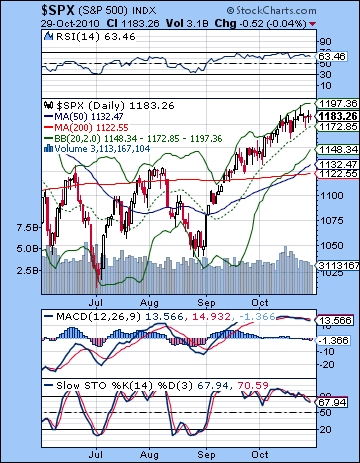 Stocks stayed mostly flat last week as improving unemployment numbers were offset by sluggish Q3 GDP data. The Dow closed at 11,118 while the S&P500 was finished the week exactly unchanged at 1183. While I had held out some hope for a larger midweek selloff, this outcome was not wildly divergent from expectations. As predicted, Monday’s Sun-Venus conjunction corresponded with a modest rise although much of it was lost by the close. Prices generally drifted lower into the midweek Sun-Ketu aspect as Tuesday was flat and Wednesday saw a modest decline, albeit with a larger intraday selloff. Thursday’s Sun-Venus conjunction did produce a bullish open but much of the enthusiasm again fell by the wayside by the close. Nonetheless, stocks generally edged higher. As expected, Friday’s session was weaker than Thursday and we saw more intraday weakness although there was a recovery by the end of trading. Bulls have stayed committed to their positions ahead of the FOMC meeting on Nov 2-3 and have kept the rally intact. The consensus view is that Bernanke will announce a further $500 billion in treasury purchases for QE2 over the next six months on Wednesday Nov 3. If it’s more than that, then the market will likely react favourably as the increased liquidity will free up more money for riskier assets such as equities. If it’s less, then we may get a selloff. What is fascinating about this critically important announcement is that is occurs while Venus is retrograde and at the time of a close Mars-Ketu aspect. Since Venus symbolizes buying and the way we assess value, its unusual backward motion is considered an anomaly and opens the door to shifts in thinking about the way we price assets. The retrograde cycle is therefore a time when participants may be re-assessing their risk reward ratios and making the necessary changes in their portfolio. Does this mean that a correction is an inevitable consequence of the FOMC meeting? No, nothing is inevitable. It is conceivable that the shift in Venusian type thinking about value and assets may actually free up more cash for lending and investing. But this is not at all a probable outcome. The heightened influence of Ketu at this time increases the probability of a change in direction and thinking, especially given the potentially disruptive Mars-Ketu aspect that is very close to exact on Nov 2-3. So I still think a post-FOMC decline is the most likely scenario here. The Pluto-Rahu conjunction on Nov 9 adds to the planetary stressors in play in November and could well serve to magnify any negativity. The sources of bullishness appear to be weakening in the near term as Jupiter enters Aquarius this week and puts more distance between it and Uranus. After November 18, however, it will reverse course and begin to move forward. This is likely to be a bullish influence as we move into early January so it seems reasonable to expect generally higher prices between late November and early January. Whether they are higher than current prices will depend on the extent of the correction we get in November.
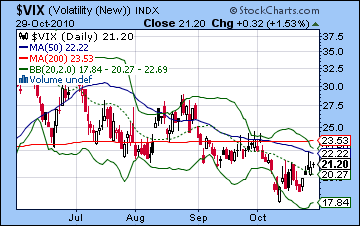
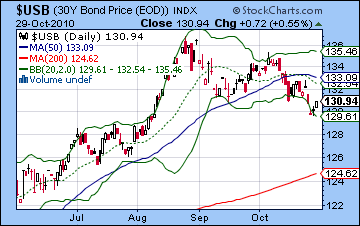
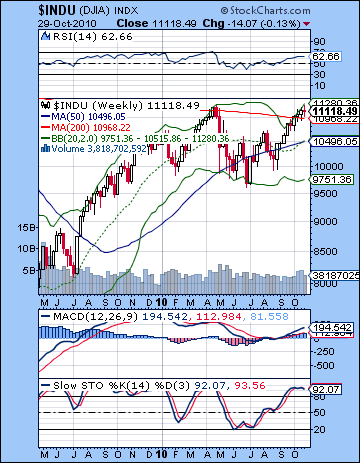 The technicals remain overbought here and give some support to a bearish view of the market. The S&P continues to ride the upper Bollinger band here as pullbacks to the 20 DMA have been aggressively bought. Monday’s shooting star candle was a bearish sell signal as early enthusiasm took prices up near resistance and then fell back by the close. Subsequent trading days did little to alter this interpretation. Daily MACD remains in a bearish crossover and looks to be rolling over here. Of course, more freebies from the Fed could conceivably nullify this crossover but it is not a probable outcome. Stochastics (67) has slipped below the 70 line and are now showing a glaring negative divergence. RSI (63) is similarly showing a negative divergence after its touch of the 70 line. Meanwhile all moving averages are still on the rise and the market has thus far followed through on its golden cross of the 50 and 200 DMA. Resistance is quite strong near the 1200 level while support probably initially kicks in around the 20 DMA at 1175. After that, 1160 is likely a key support level as it marks last week’s low. If that is broken, it would constitute a lower low and might encourage more selling. Of course, 1150 will likely be a place that bulls will want to defend since the breakout above the previous head and shoulders pattern began at that level. Interestingly, 1148 marks the bottom Bollinger band so that may be a natural resting point for the first stage in any corrective move. Bears likely take more comfort in the weekly Dow chart as price remains tied to the upper Bollinger band. Previous contacts with this upper line resulted in eventual corrections back to the 20 WMA (January) or the bottom Bollinger band (May). So there is good reason to expect a correction back to one of these two lines in the not-too-distant future. Currently that would be 10,500 for a mild correction and 9700 for a more severe correction. The double top on the Dow does not look very bullish given the raft of negative divergences on the indicators. MACD, RSI and the Stochastics are exhibit negative divergences with respect to previous peaks. The 200 WMA was an important level of resistance in the past as price has failed to climb above it in Aug 2008 and Apr 2010. At the moment, the Dow is above it but only by 2%. This is still close enough to be considered inconclusive although another gain next week would likely turn this resistance line into support. Bears can also point to the rising $VIX despite last week’s flat performance. This is the second week in a row the VIX has risen despite flat or rising stock prices. Despite the Fed’s continued intervention in the bond market, treasuries remain weak here as yield moved higher on the 30-year. This is an ongoing headache for Bernanke who must heed the lessons of the market. Higher bond yields are a sign that the market thinks holding treasuries is a growing risk given the burgeoning US debt and the falling Dollar. An announcement of more QE 2 bond buying is unlikely to lift bonds too much as there appears to be growing suspicion that this is a flawed strategy. It’s unclear how Bernanke will escape this current conundrum. If the Dollar continues to weaken, no one will buy treasuries and the Fed will be forced to raise rates in order to lure more buyers. However, this is an unsustainable course given the huge US government deficit. And if the Fed continues to buy treasuries in an effort to free up liquidity, the Dollar will continue to fall and thus set up an vicious circle.
 This week promises to be extremely interesting as the bearish Mars-Ketu aspect dominates the midweek period. In addition, Jupiter moves out of the friendly confines of Pisces into the less accommodating sign of Aquarius so that is another potentially negative influence. Monday may well be bullish, however, as the alignment between Venus, Mars and Pluto could well ignite some buying interest. While both Mars and Pluto are considered negative planets, and therefore Venus is outnumbered in this pattern, recent experience has suggested that the market rises on most three planet combinations. If the market turns out to be negative, then that is a clue that the week could well be very bearish. Tuesday could also see some buying as the Moon opposes Jupiter. This is a fairly minor influence so there is a greater chance for declines than on Monday. Wednesday will see the Mars-Ketu aspect become near exact while the Moon is with pessimistic Saturn. There is a good chance we could see the market fall at the open as a reaction to election results, and the close may also be bearish after the FOMC announcement at 2.15 pm. Thursday is harder to call since the Mars-Ketu is still close by but there is a bullish aspect between Mercury and Jupiter. One possible outcome might be a negative open followed by a rebound that takes the market back into the green by the close. Friday looks more negative as Mercury approaches its square aspect with Neptune. A bullish scenario would have the market rising to 1190 on Monday but then falling back to 1170 by Thursday and closing the week somewhere between 1170 and 1190. A more bearish scenario would see a flat performance Monday followed by a sharp selloff into Thursday morning that tests support at 1160 (or lower) with Friday finishing somewhere around 1150-1170. There is a reasonable chance we will see a significant drop midweek so that will be crucial for realizing the bearish scenario.
 Next week (Nov 8-12) also looks bearish to neutral as Mars comes under Saturn’s negative influence late in the week. Monday looks generally bullish as Mercury is in aspect with Venus. Then there is a conjunction of Rahu and Pluto on Tuesday that could take markets lower into midweek. The Mercury-Rahu aspect on Wednesday and perhaps Thursday also tilts towards the bears. Friday could go either way as Mercury is free and clear of affliction but Mars will approach its aspect with Saturn. The following week (Nov 15-19) will likely begin negatively on the Mars-Saturn aspect. Wednesday also looks bearish on the Mercury-Saturn aspect but some late week bounce is quite likely as Venus ends its retrograde cycle while in a positive aspect with Uranus. There is the possibility of some big moves in either direction at this time. With both Venus and Jupiter both changing direction within a day of each other, there is a good chance for a reversal of the preceding trend. The end of November and the beginning of December tilt towards the bulls, although it may be a fairly muted rise. There should be a sizable, if brief, pullback around Dec 8-15 and the Mercury-Mars conjunction. This is likely to be a higher low than what we see in November, although that is unclear. As Jupiter moves closer to Uranus, the second half of December should deliver a year end rally that extends into January. How high the market goes depends on the extent of the pullbacks in November or perhaps early December. It’s possible we could see a higher high, perhaps to 1250, in early January but only if the November correction is mild, say back to 1120. If the correction is deeper as I expect, say down to 1000-1050, then a lower high becomes the more likely outcome. Once this conjunction is exact on Jan 4, there will be a growing likelihood of a correction. The bulk of this decline will likely occur sometime between Jan 15 and Feb 15. Prices will likely stay soft through March and the Jupiter-Saturn opposition. Then we can expect another significant rally building into June and July. While it’s tempting to think markets will simply track lower through 2011 with a series of lower lows and lower highs, I think it’s better to keep an open mind and wait for highs and lows to be established first.
5-day outlook — bearish SPX 1160-1180
30-day outlook — bearish SPX 1120-1150
90-day outlook — neutral SPX 1150-1200
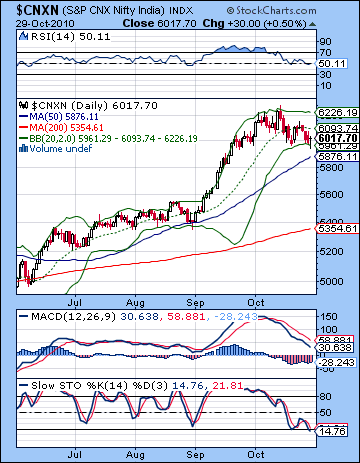 Stocks staged a modest retreat last week as investors took profits ahead of the key RBI and Fed interest rate decisions. The Sensex again traded below 20,000 before rebounding Friday to close at 20,032 while the Nifty finished at 6017. This mildly bearish outcome was largely in keeping with expectations, even if it adhered more closely to the bullish scenario I outlined in last week’s newsletter. The intraweek dynamics closely followed the ebb and flow of planetary influences as Monday’s gain corresponded nicely with the Mercury-Venus conjunction. As expected, prices turned lower after that as Ketu’s influence grew stronger through its aspect with the Sun on Wednesday. I had thought there was a good chance of a significant down day on Wednesday or Thursday. As it happened, the market fell on Tuesday, Wednesday and Thursday, with the biggest decline occurring on Wednesday. While this decline was most welcome, it still was fairly muted given the respective influences of Ketu and of course the ongoing Venus retrograde cycle. As predicted, Friday saw a rebound on the Sun-Venus conjunction as prices moved modestly higher once again. The market has clearly taken a pause from its recent rally during this Venus retrograde period, although it has only been the mildest of corrections thus far. With Venus continuing to move backwards across the sky until 19 November, we may have yet to see the full impact of this influence. It is certainly an interesting coincidence that the next key central bank statement on the economy is slated for this week — right in the middle of this Venus retrograde cycle. Since Venus symbolizes the act of buying and the way in which we assess value, its backward motion is an invitation for buyers to re-examine their assumptions about risks and rewards. While this may not necessarily preclude further rises in price, the process of buyer’s reflection opens the door for changes in perspective, perhaps fundamental ones. The US Fed and RBI meet on the same day to announce any changes in their policy, which also happens to be the day of the US midterm elections. As Venus is in reversal, we may well wonder if there is an increased likelihood that there may be similar policy reversals in approach to the economy. The RBI is expected to raise rates 25 basis points as it addresses a stubborn inflation problem. And yet such a move is likely to push the Rupee even higher, thus further reducing the attractiveness of Indian exports and outsourcers. The RBI is clearly in a difficult position. It could surprise the market with a 50 point hike but this would send the Rupee soaring and would hurt exporters. Leaving rates unchanged would do nothing to address inflation and would likely light a fire under equities. Even the widely discounted 25 point move would invite some investors to sell the news. Overall, retrograde Venus increases the chances of either an unexpected shift in central bank policy or negative market reaction to it.
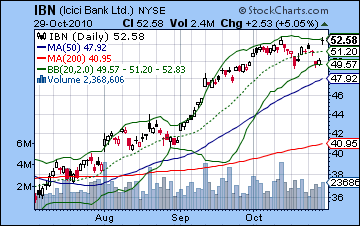
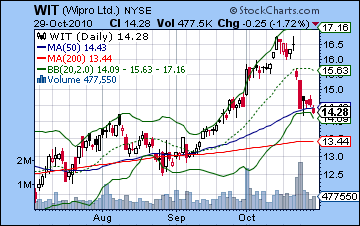
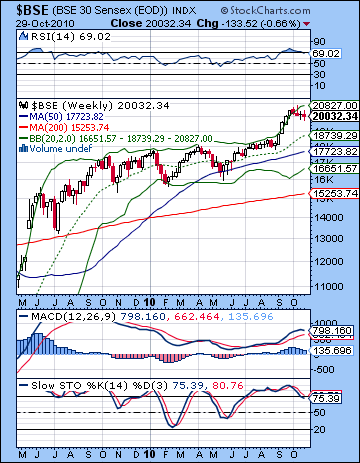 The recent correction has created a more complex technical picture as many indicators are now bearish but some are showing signs of bottoming. Last week’s decline creates a bearish descending triangle on the Nifty from the high of 13 October which requires a break below 5950 for a downside breakout to be confirmed. Another rise towards the falling resistance line could test 6050 or so no the upside. If it rises above this resistance level, then that would be bullish. Support here is close to 6000. This is a tantalizing set up for bears looking for a bigger move lower. At the same time, Friday’s hammer candlestick suggested the possibility of a reversal higher. While hammers are often bullish at the end of a decline, it is more convincing is there are other sources of support. In this case, there is the bottom of the descending triangle and close to the bottom Bollinger band. So that’s a nice blending of indications that might suggest a rebound is in the cards. Stochastics (14) may have bottomed out here as they are at their lowest point since May. This is not to say that a reversal higher is likely but some kind of rally attempt is more probable at these levels. Indeed, we can see a negative divergence with respect to the late August low. Stochastics are lower but price is still much higher, indicating that price still has to catch up to the indicator. Daily MACD is in a deep bearish crossover although it is still above the zero line. RSI (50) has fallen from its overbought area and is sitting on the fence between bearish and bullish. It is still at a higher level than its August low thus indicating no negative divergence. This is therefore a less bearish signal than the Stochastics is giving. The weekly Sensex chart is finally showing Stochastics (75) below the 80 line indicating that a correction is finally underway. RSI (69) has also slipped below the overbought level of 70 and may be taking a longer journey lower. Support on this chart is likely found around the 20 WMA at 18,700 and below that near the bottom Bollinger band at 16,600. Previous corrections have rebounded off this bottom line. Perhaps not surprisingly, the charts of individual stocks contribute both bearish and bullish evidence. After some positive earnings results, ICICI Bank (IBN) jumped in Friday’s trading. Obviously, this is a bullish indication although even there, we can see a potential double top forming in the chart as the shooting star candle creates a potential for an island reversal pattern. The rising Rupee has created havoc for outsourcers such as Wipro and it suffered again last week. It may have found support here at its 50 DMA but any further declines would jeopardize its recent rally off the May low. Overall, then, the technicals look vulnerable to further declines although they also may foreshadow a rally attempt in the near term.
 This week leans strongly bearish on the midweek Mars-Ketu aspect. Monday may well begin positively, however, as Venus, Mars and Pluto form an alignment that could encourage buyers. While the malefics Mars and Pluto outnumber Venus here, there is still a reasonable chance for gains. If for some reason the gains do not appear, then that would increase the probability and scope of a down week. Tuesday and Wednesday tilt towards the bears as Mars casts its aspect to Ketu. As the tail of the snake, Ketu often brings sudden and unexpected changes and its combination with Mars here is quite volatile. We may see difficult circumstances that compel sudden reactions. With markets closed Friday for Diwali, Thursday may see some recovery on the approach of the Mercury-Jupiter aspect. The problem here is that there is also a bearish Sun-Saturn aspect occurring at the same time. It is possible that these two influences will cancel each other out and produce a flat outcome or they may occur in quick succession — a weak opening followed by a positive close. This is an important week because it combines a plausible negative factors (RBI rates, the Fed) with even more probable negative astrological factors. So there is a good chance for a down week overall, although it is unclear how negative it will be. If Wednesday’s selloff is mild, then the Nifty may end somewhere between 5900 and 6000. A mild down move would be a sign that the fundamental bullishness of this market is still in evidence and that nothing much has changed. If it is deeper, then we could see the Nifty move below 5900.
 Next week (Nov 8-12) looks bearish to neutral but will likely begin positively as Mercury aspects Venus on Monday. It is possible the open could be negative here but expect some recovery by the close. Tuesday’s exact Pluto-Rahu conjunction looks more negative and its effects could well spill over into Wednesday. Thursday features a Mercury-Rahu aspect so that is another potentially negative influence. Friday is perhaps more bullish. The following week (Nov 15-19) may begin negatively on the Mercury-Saturn aspect but there is a good chance for a solid reversal higher by Friday. Both Venus and Jupiter will end their retrograde cycles at the end of the week so there is an increased opportunity for gains, especially if prices have been trending lower. Expect an up trend for at least one week and possibly two as we enter December. Then the very potent Mercury-Mars-Rahu-Pluto conjunction from Dec 1-12 is likely to force prices down sharply. It is unclear if this will be lower low than anything we see in November. It’s certainly possible. Then prices should rise again from 15 Dec into early January at least and the Jupiter-Uranus conjunction. Stocks may form another interim top in January and then begin to fall by the last week of January at the latest. The correction should extend well into February with prices remaining weak until March and the Jupiter-Saturn opposition. We could see significant lows formed in mid-February and at the end of March. Then another rally will begin and continue into June and July. Stocks will then take another sharp drop in August and September. There is a good chance that the Nifty will make a series of lower lows and lower highs through much of 2011, at least until September.
5-day outlook — bearish NIFTY 5800-6000
30-day outlook — bearish-neutral NIFTY 5600-6000
90-day outlook — bearish-neutral NIFTY 5500-6000
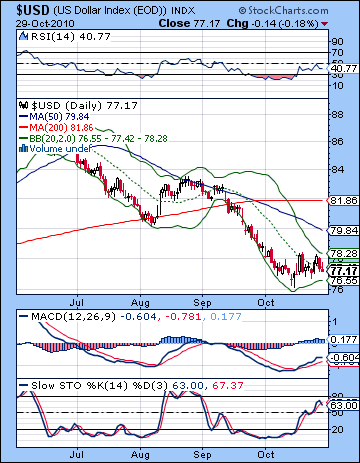 The US Dollar slumped back last week as lackluster economic data suggested the recovery would be weaker than expected. The US Dollar Index finished Friday at 77.17 while the Euro closed at 1.391 and the Rupee at 44.3. I thought we might see more firmness, but the week’s contour did roughly follow the key aspects. The early week brought a loss on the Mercury-Venus conjunction and we did see the expected updraft on the Sun-Ketu aspect midweek. The end of the week Sun-Venus conjunction also generally adhered to expectations as it produced more downside. While the Dollar still looks vulnerable here, it has nonetheless managed to keep its head above water and the recent low of 76. MACD is still rising and in a bullish crossover and Stochastics (63) have made substantial headway. They will soon move into overbought area with one or two more day’s of gains. That may be the more crucial test for bulls. One of the most disappointing developments here is that the USDX failed to climb above the previous week’s high of 78.3, which is roughly near the upper Bollinger band. This has become an important resistance level. Any close above this level may begin a larger breakout higher but until that time, the Dollar will be in a purgatorial state. The weekly chart shows little change and as the Dollar is still in an oversold condition. As long as the Dollar stays above the rising trendline from the 2008 lows, there is still a plausible bullish case for it. This trendline is currently around 76. A break below this level opens a Pandora’s box for the Dollar as it would be a signal that more investors are abandoning it in favour of other currencies. Given the dangerous inflationary game that Ben Bernanke is playing, this is something to keep an eye on. It may well be that the Fed secretly wants to devalue the currency and create inflation as a way to escape the worst of its debt burden and fuel an export-driven recovery. The problem is that a lower Dollar will make US treasuries less attractive and that would drive up yields. This is an untenable situation for the Fed given the massive amount of US debt issuance. Higher interest rates would cripple the government even more than it currently is as interest payments would absorb a higher proportion of revenues. Perhaps this week’s FOMC meeting will shed some additional light on this question.
This week looks more bullish for the Dollar as the midweek Mars-Ketu aspect could see a short but sharp lift in the greenback. Monday could see further losses, however, as the Venus-Pluto aspect may embolden risk takers and they look for higher yields. Wednesday and Thursday perhaps look the most bullish as the Sun-Saturn aspect and the Mars-Ketu aspect conspire to take the Euro lower, perhaps below 1.37. The Euro should nonetheless see a boost on Thursday on the Mercury-Jupiter aspect. Next week also looks quite positive although the early week period may see further erosion. The midweek Mercury-Rahu aspect could see the EUR/USD fall below 1.36. The current rebound in the Dollar may fizzle out sometime near the Jupiter and Venus direct stations on Nov 18 and 19 respectively. I would not be surprised to see the Euro fall to its 50 DMA at 1.33 by that time, perhaps even a little lower. This would be in keeping with the rising trendline off the June low. Then the Dollar may resume its slide once again as we move into December. We should see the Dollar start to bounce again sometime around Christmas. This rally should extend into mid to late January although it may not take it much higher than its November high.
Dollar
5-day outlook — bullish
30-day outlook — bullish
90-day outlook — neutral-bullish
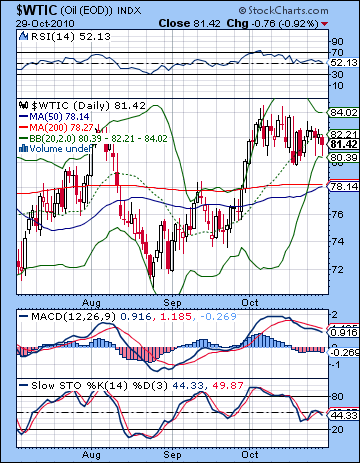 Crude oil continued to struggle last week as worse than expected economic data dimmed demand forecasts. After trading as high as $83 on Monday, crude futures settled closer to $81.50. This mildly bearish outcome was largely in keeping with expectations as the midweek Sun-Ketu aspect put a damper on prices. We did get the forecast gains on the Venus conjunctions on Monday and Thursday but declines pervaded the landscape on all other days. The technical picture looks mixed. On the bullish side, Friday’s close stayed above the bottom Bollinger band and also featured a bullish hammer candlestick. Wednesday’s decline also produced a hammer with a very similar intraday low suggesting the possibility that a near term bottom may have been reached. On the other hand, Stochastics (44) are listlessly drifting towards the oversold zone and given the recent weakness in crude, it seems a good bet there will get there before reversing. Daily MACD is still in a bearish crossover and still well above the zero line. This does not make a compelling case for going long. There may well be some support near $81 and the bottom Bollinger band but the proximity of the 50 and 200 DMA near $78 may act as a magnet in the event of a deeper correction. If $78 should not hold, then crude may go all the way back down to $70-72.
This week offers the prospect for further declines on the fallout around the Mars-Ketu aspect and FOMC meeting on Wednesday. Monday could well begin the week on the winning note as the Venus-Pluto aspect could bring in buyers. Thursday’s close also looks quite positive as Mercury is in aspect with bullish Jupiter. This has the added bonus of hitting a sensitive point in the Futures horoscope so that increases the likelihood of a gain on Thursday. Friday is harder to call although the presence of a Mercury-Neptune aspect would tend to reduce much upside. Next week looks more mixed with early week gains offset by probable declines on Wednesday and Friday. The overall picture looks fairly bearish for crude until both Jupiter and Venus reverse their direction on Nov 18-19. This should coincide with a one or two week rally that extends into early December. Then we will likely see another significant correction going into Dec 15th and the period around the Mercury-Mars conjunction. Crude will likely rally into the new year on the Jupiter-Uranus conjunction. Watch for further downside, however, in February and March. These could well be below the November low.
5-day outlook — bearish
30-day outlook — bearish
90-day outlook — bearish-neutral
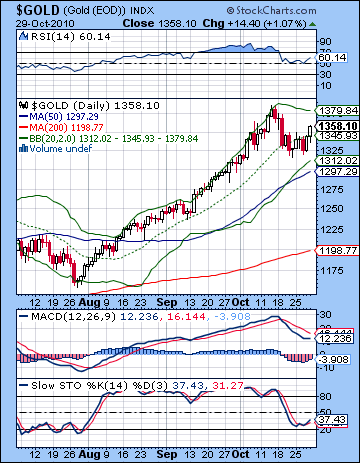 Gold resumed its ascent last week on further Dollar weakness as disappointing economic data increased the likelihood of further stimulus measures. After trading below $1320 on Wednesday, gold finished at $1358 on the continuous contract. I thought we might get some significant moves in both directions and that definitely came to pass. However, I had expected a little more midweek downside with perhaps fewer gains in the late week period. Monday’s Mercury-Venus conjunction corresponded nicely with a gain and then prices turned bearish into Wednesday’s Sun-Ketu aspect. Thursday’s Sun-Venus conjunction brought bulls back into the picture. Friday was perhaps the most unexpected result here as the bullishness remained intact for a second day running. The technicals on gold improved somewhat last week as prices moved above the 20 DMA. Daily MACD is still in a bearish crossover, although histograms are now shrinking suggesting a possible reversal. Stochastics (37) have turned higher although it is unclear if this is a blip on their way down to the 20 line or if they are moving back to the 70 line. The weekly chart is still strongly trending higher and remains very overbought. There is still a good case to me made for a correction back to the breakout level at $1250. Price is still well above the 50 DMA at $1297 suggesting that gold is only a momentum play rather than a value play. While it may continue to have some short-lived rallies here, eventually it will have to consolidate and correct back to at least this level.
This week looks mostly negative for gold as the midweek Mars-Ketu aspect may prop up the US Dollar. Gains are probable on Monday and perhaps into Tuesday on the Venus-Pluto aspect. Thursday may see some buyers come in on the Mercury-Jupiter aspect with Friday being neutral to bullish. Next week looks mixed with gains possible early in the week but losses more probable midweek on the Mercury-Rahu aspect. November looks quite mixed with declines more likely up to the end of the Venus retrograde cycle on Nov 19. Some gains are likely at the end of November, but the first half of December may be quite bearish on the Mercury-Mars-Rahu-Pluto conjunction. At this point, I don’t expect the high of $1390 to be taken out in November. $1250 looks more likely by mid December. We may well get another serious rally in the second half of December and into early January. Another pullback is likely from Jan 15 to about Feb 15 but look for another run higher after that. I think there is a good chance that gold will continue in this general upward channel until at least September 2011.
5-day outlook — bearish
30-day outlook — bearish-neutral
90-day outlook — bearish-neutral

