Summary for week of November 21 – 25
Summary for week of November 21 – 25
- Stocks more prone to weakness early but recovery later in the week
- Euro likely to rebound by midweek
- Crude mixed with gains more likely later
- Gold bearish early in the week
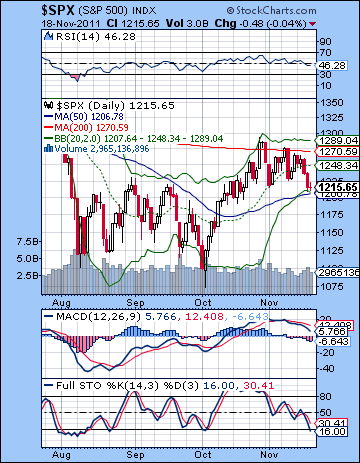 Stocks tumbled last week as the latest chapter of the Euro-drama unfolded in the bond market as yields resumed their upward climb. The Dow lost 3% closing at 11,796 while the S&P500 finished at 1215. This bearish outcome was largely in keeping with expectations, although the extent of the decline was a little surprising. Monday was down as anticipated as the twin effects of the Saturn ingress into Libra and the Rahu conjunction with Mercury and Venus eroded confidence. I had been somewhat ambivalent about the direction here, although my bias was clearly negative. But the decline itself was fairly modest and set up a recovery into Tuesday. I thought we might see a midweek boost on the Mars-Jupiter aspect and it arrived a little early. The rest of the week saw the bears take over in force as Thursday’s Sun-Saturn aspect provided more than enough fuel to produce significant downside and take out a key technical support level.
Despite new governments in Greece and Italy, the EU debt crisis shows no signs of abating any time soon. The bond vigilantes have returned with a vengeance and are driving up yields on the bonds of every EU country except Germany. Even France has seen its yield spread with German Bunds pushed higher as fears that the crisis is out of control and will end in disorderly defaults and bank failures. With bonds front and center it is perhaps not surprising that Saturn should be the key planetary player at the moment. Saturn’s entry into sidereal Libra on Monday highlighted the pessimism that has been percolating since the announcement of the EU agreement in late October. Saturn not only symbolizes caution, austerity and negativity, it also represents debt. This is particularly appropriate at this time when financial markets are so fixated on bond yields! The Congressional Supercommittee will also be charged with reducing (Saturnian) debt when it meets this week. If the Libra ingress corresponded with this week’s modest declines, the real test lies ahead and the eventual opposition aspect between Saturn and Jupiter in December and early January. Aspects between Jupiter and Saturn often mark significant turning points in the market. The aspect has a decidedly bearish influence. The last opposition aspect occurred in mid-2010 during the major correction. The reason why the aspect is usually bearish is that Saturn moves more slowly than Jupiter and planetary velocity varies directly with strength. The upcoming opposition (180 degree) aspect is a little different, however, because 1) there will be no exact aspect due to Jupiter’s direct station and 2) Jupiter will be moving more slowly than Saturn. This could modify the effects of this bearish pairing somewhat. The aspect is closest in early January when the two planets are 178 degrees apart. This is one reason why I do not expect a move straight down in the coming weeks. While my outlook remains bearish, there will likely be some sudden, powerful rallies in the midst of a broader and deeper move lower.
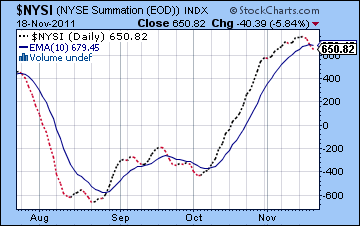 The bears chalked up a huge victory last week as the triangle pattern resolved to the downside and support at 1220-1230 was also broken. This support marked the previous resistance of the late summer trading range and it had acted as a base line of support in the October rally. Thursday’s close below 1220 was very bearish. It was also telling that the SPX could not rally back to 1230 on Friday as all rally attempts above 1220 were met will selling. Perhaps 1230-1240 will now act a key resistance zone. Price did bounce off support at 50 DMA at 1206 so all is not lost for the bulls. The market needs to stay above 1200-1206 or else it will begin to test all those low-lying Fibonacci levels — 1183 (50%) or 1158 (61.8%) or lower. We could also see the recent series of falling peaks resolve into a falling channel that would culminate support at 1180-1190 this week. But even if 1200 holds for this week, sell signals abound on the daily chart. MACD is still in a bearish crossover and now has clearly growing histogram bars. The RSI is now below the 50 line and has broken out of its own bearish descending triangle. On the other hand, Stochastics are close to being oversold here and the SPX arrested its decline near the bottom Bollinger band. Perhaps this week could be the pause that refreshes. But the worse news is that the Summation Index now clearly shows a sell signal. This breadth indicator is a good general barometer for medium term market direction. When it moves under its 10-day EMA it suggests that a significant correction is imminent. Conversely, when it rises above its 10-day EMA it is an additional sign that bulls have taken control. This buy signal was triggered in October shortly after the low. While there is no guarantee that it could not once again move back to "buy", this crossover should be taken very seriously. It also meshes nicely with the bearish astrological indicators that I am seeing for the next few weeks. So it seems we are on the verge of another significant correction.
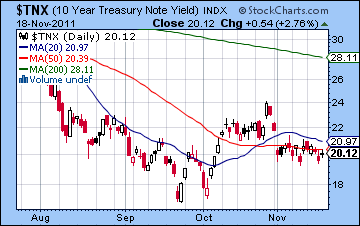
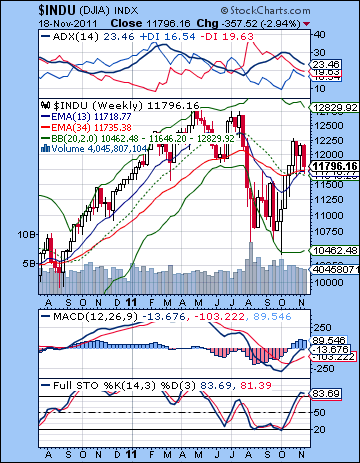 The weekly Dow chart is still more of a mixed bag. The 13/34 week EMA are still in a bearish alignment although just barely — a negligible 17 points separates the two. MACD is still in a bullish crossover although the latest histogram bar was flat.with respect to the previous bar suggesting the rally may have stalled. For the corrective move to really get going the weekly chart needs a MACD bearish crossover. Once this occurs, there is a better chance that we can take out the October low. Stochastics are overbought here (83) and are just one more negative week away from a bearish crossover. If this happens this week, then this would be another important sell signal in a different time frame and would further cement the bearish case. ADX is still in a bearish crossover although it could use some widening to give the bears more breathing space. The treasury market basically went sideways last week as 10-yr yields stayed close to the 2% level. It is possible that they could make another run towards the October low although there appears to be a lot of support around 1.95%. Only a crisis-type move would likely break below that level. Copper is similarly trending down and should not give bulls much comfort. With China looking more vulnerable to a slowdown, demand for raw materials like copper is weakening. Overall, the technical picture suggests the next big move will be lower although it may not come all at once like the July-August move did. There is significant support between 1120 and 1180 that may act as a temporary break on any sell-off. Whether any subsequent bounce off these levels would be enough to improve the technical outlook remains to be seen, although I would be skeptical about that prospect.
This week is a real grab bag of planetary influences that does not clearly indicate a direction. The situation is made more complicated by the Thanksgiving holiday close on Thursday and a half day on Friday. Typically, it is thinly traded week with a bullish bias although the Supercommittee deadline on Wednesday could add some urgency. The early week Venus-Saturn aspect definitely tilts bearish for Monday and Tuesday, but it is unclear how negative it could be. Venus will enter sidereal Sagittarius on Monday and this could actually provide a bullish boost for the market. But the problem here is that Saturn’s influence could subvert the positive influence and produce a down day. Tuesday features an intense Mars-Pluto trine aspect which could prove to be too much for the Jupiter influence to handle. This is a bit of a question mark, however, so I cannot rule out a gain on Tuesday and Wednesday. Wednesday looks somewhat more positive than Tuesday, however. But the fun is only starting. On Thursday, Mercury turns retrograde and Friday we have a partial solar eclipse in Scorpio. Friday also features a fairly bullish Venus-Neptune aspect, although that may boost Asian market more than the US. The eclipse occurs overnight and increases the possibility of an unexpected move during Friday’s trading session. I don’t think there is enough affliction here for a large move, but it could be enough to upset the positive Venus vibe that would otherwise tend to produce an up day. So there is a somewhat greater chance of declines on Monday or Tuesday with gains more likely on Wednesday and Friday. I am not expecting a major bounce here, and I am not expecting another big move lower either. We may finish somewhere between 1200 and 1230.
 Next week (Nov 28-Dec 2) looks like a better candidate for downside. We move into thick of the eclipse period and the Mars affliction to both Sun and Mercury intensifies. This should be enough to cleanly break support below 1200. The first half of the week looks more benign so I would not rule out another rally attempt back to resistance — perhaps to 1230-1240. But the second half of the week Dec 1 and 2 sees an exact Mars-Sun aspect and a Mercury-Rahu conjunction that could see sharp declines. The following week (Dec 5-9) should start bearish on the Mars-Mercury aspect so we could see a follow through push down to 1120 or 1150. Gains are more likely at the end of the week. After that we get a nasty Mars-Rahu square aspect into the middle of the month. This could mark an interim low. We should get an abbreviated Santa Claus rally in the week of Dec 19-23. Even here, there is an element of uncertainty due to the tightening of the Jupiter-Saturn aspect. While this aspect is bearish, the proximity of bullish Uranus in the mix suggests there could be some powerful, if brief, rally attempts in late December or early January. I’m not entirely convinced these will be anything other than bear market rallies, but it is something to be aware of. Hopefully, our technical indicators will provide additional guidance through this volatile year-end period. Q1 2012 is looking a little shaky also given the Mars retrograde period begins on January 21 and the Saturn retrograde in early February. My best guess now is that IF we see a large sell-off into early January, then a major rebound rally is likely starting in February that continues into March.
5-day outlook — bearish-neutral SPX 1200-1220
30-day outlook — bearish SPX 1100-1150
90-day outlook — bearish-neutral SPX 1100-1200
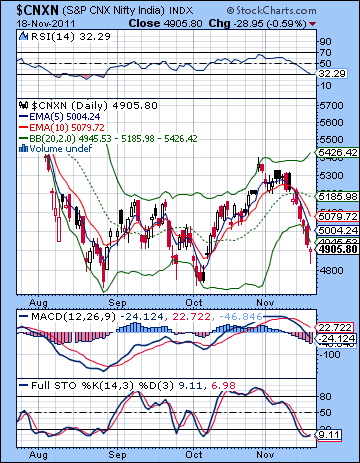 Stocks slipped for the second straight week as investors weighed the consequences of the depreciating Rupee alongside the seemingly endless Eurozone debt crisis. Falling in all five sessions, the Sensex lost 4% closing at 16,371 while the Nifty finished the week at 4905. This bearish outcome was largely expected, although the extent of the selling was somewhat surprising. I thought that the entry of Saturn into Libra on Monday would likely tilt the balance toward the bears, especially given the added burden of Rahu and its conjunction with Mercury and Venus. The midweek bounce never really took hold, however, as the Mars-Jupiter aspect was swamped by an impressive show of Saturnian gloom. Thursday was the largest decline of the week and that arrived more or less on cue with the Sun-Saturn aspect. While Friday was also lower, I was correct in calling for some kind of recovery into the close as stocks rallied off their midday lows.
Last week I wondered if Saturn was strong enough to create more downside. Its entry into Libra appears to have intensified the already jittery mood that has prevailed in world markets in November. Jupiter has largely moved into the background here and is not due to make a significant reappearance until mid-December at the earliest when it moves closer to its aspect with Uranus. That paves the way for nasty old Saturn to more or less have his way with this market for the interim. Certainly, the spark for this latest round of Euro-skepticism is the immediate cause of the most recent downdraft. European bond yields are rising as the bond market is not yet convinced that new technocratic governments in Greece and Italy will be able to fix the problem. It’s worth noting that debt and bonds are very much Saturnian in themselves. If Jupiter symbolizes stocks and part ownership of a company, Saturn represents debt and so the ringed-planet is said to rule the bond market. With Saturn in the driver’s seat at the moment, debt levels and bond yields are guiding the market direction. In addition, this Wednesday will mark the deadline of the US Congressional Supercommittee charged with reducing government spending. Saturn again. Now that Saturn has entered Libra, it is approaching its opposition aspect with Jupiter. This is a key planetary indicator for the market over the next 6-8 weeks. Jupiter and Saturn represent the polar opposite of sentiment — Jupiter is bullish and Saturn in bearish. When they come together by aspect, we are more likely to see reversals in direction. Stocks tend to decline around the time of their closest angle, although this is only a probability. The previous opposition aspect (180 degrees) between Jupiter and Saturn occurred in mid-2010 and coincided with a significant correction. This time around is likely to produce more downside. That said, the aspect does not form an exact opposition so it may be modified somewhat both in terms of power and duration. The aspect is closest in early January. By rights, the market should be bearish until early January. And yet the overall picture is complicated by the presence of a simultaneous bullish aspect from Uranus. (see below).
 The bears took control last week as the Nifty broke cleanly below 5000. The short term trend is clearly down as the 5-day EMA is below the 10-day EMA and both are both the 20 DMA. All three are sloping down and price is below all of them. It is the very picture of bearishness. MACD is still in a bearish crossover and the histogram bars are still lengthening suggesting the down move has further to go. RSI is coming up close to oversold levels however so it is unclear how much lower this move has. Stochastics are also oversold and Friday’s session produced a bullish crossover. A move above the 20 line would be a minor bullish signal and could embolden bulls to take long positions. Friday’s long-tailed dragonfly candlestick has bullish potential to mark a reversal. Buyers came in when the Nifty approached its recent low and pushed it up quickly. The late week moves pushed the Nifty below the bottom Bollinger band. This is often a signal of some kind of rebound, however temporary.
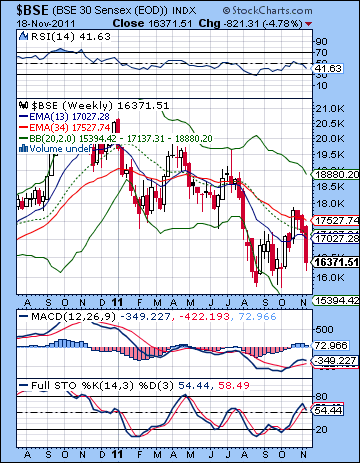
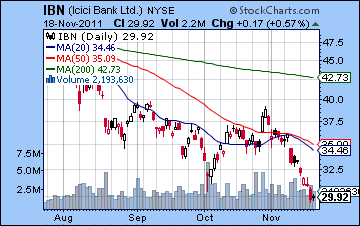
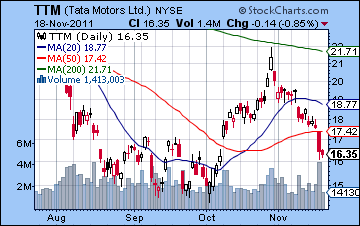
If support is around 4800, resistance is likely around the 50 DMA at 5066. In the event we see a stronger bear market rally, the next resistance level would be around 5200 and the 20 DMA at 5166. A rise to 5200 would likely be enough to work off the oversold condition on the daily Stochastics chart and could usher in a new wave of selling. The weekly chart suggests the medium term trend is still down as the 13-week EMA is below the 34-week EMA. RSI shows a series of lower peaks over the past several months as one would expect from a bear market. There is no sign of any disruption of this pattern as the last peak was not higher than the previous one. Moreover, it barely rose past 50 and then promptly fell again suggesting further weakness ahead. Stochastics got a bearish crossover and added to the overall gloomy picture. While MACD is still in a bullish crossover, the weekly histogram bar was shorter suggesting a down trend. Of course, as long as support holds at 16K, then the market could conceivably limp along for some time. A break below this support level could produce some sharply lower prices, however. All this talk about debt and default has been tough on the banking sector as the chart for ICICI shows (IBN). It broke below its October low last week and shows no sign of reversing here. Without any clear source of support, it is unclear where bulls would enter safe long positions. Tata Motors (TTM) also had a bad week as Thursday’s decline came a big volume. The gap below 17 was filled in this sell-off so it is possible we could see a rally attempt from here. There could be a fair amount of overhead resistance above 17 however as that not only brings in the 50 DMA but also some significant horizontal resistance over the past months. Trapped bulls may chose to exit at this level rather than wait for any potential future rally higher.
 This week looks more mixed despite some onset of the uncertain eclipse period on Friday. The early week tilts bearish as Venus comes under the aspect of Saturn on Monday and perhaps Tuesday. Venus rules buying and shopping, so Saturn’s penchant for restraint could produce a lack of buyers. That said, Venus will be entering the sign of Sagittarius on Monday so that could conceivably offset some of the bearishness. Tuesday and Wednesday feature a Mars-Pluto aspect that also could be problematic for the market. It seems unlikely that we will see both days in the red, however. Generally, the odds of a gain will rise as the week progresses as Wednesday’s Moon-Jupiter aspect may be enough to cut through the Saturnian fog. Thursday looks more clearly bullish as Venus is in aspect with Neptune. As a potential wild card, however, Mercury will turn retrograde during the trading day on Thursday. I do not expect this to immediately undermine the positive energy here. Friday is noteworthy for the solar eclipse that occurs in Scorpio. Eclipses can increase volatility although aspects still have the final say. In this case, we could see further gains since the Sun-Moon conjunction will be in close aspect with Jupiter. Even if we see some declines early in the week, they are unlikely to be large enough to threaten support at 4800. That will provide a good basis for some upside during the course of the week. If Monday happens to be higher, then Tuesday is more likely to manifest as a loss although this may only return the Nifty to the current 4850-4950 range. With gains more likely later in the week, we could see 5000-5100 by Friday. That suggests there is a good chance for gains overall.
 Next week (Nov 28-Dec 2) could begin with a bullish bias but the mood looks likely to turn negative by the end of the week. The Venus-Pluto conjunction on Tuesday and Wednesday could lift prices a little further — perhaps to 5200-5300? — but the late week Mars-Sun aspect looks quite negative. This will likely push stocks down sharply, especially on Friday when Mercury conjoins Rahu. This will likely return the Nifty to the support range of 4800-4900. The following week (Dec 5-9) will likely continue the bearishness at the beginning of the week on the Mars-Venus aspect. While we could see some mixed results midweek, there is a slight risk for more downside here as the Sun conjoins Rahu on Wednesday. The trend looks mostly bearish into mid-December as the Mars-Rahu aspect on the 13th could also spark selling. We could see another rally attempt at the end of December near the Jupiter direct station on the 26th. But the bearishness will likely return in early January on a Saturn-Rahu aspect. The picture through January is not as clear as I would like and I acknowledge there is a considerable degree of uncertainty in this forecast. We could stay bearish through to January and test 4000 on the Nifty or we could end up trapped in ta trading range of 4400-5000. I tend to think there is enough downside energy to take out the previous low of 4747 by mid-December. Where we go after that is more uncertain, however. On a technical basis alone, one would think that a break below 4700 would be extremely bearish and would invite huge selling. The astrological picture does offer some support to this collapse scenario in December and January. And yet there is also a case to be made for rallying back above 5000 in late December due to the Jupiter-Uranus aspect. I tend to favour the major decline below 4700 scenario here. The prospects for a strong rally in February, March and April are somewhat clearer.
5-day outlook — neutral-bullish NIFTY 4900-5100
30-day outlook — bearish NIFTY 4500-4800
90-day outlook — bearish NIFTY 4000-4500
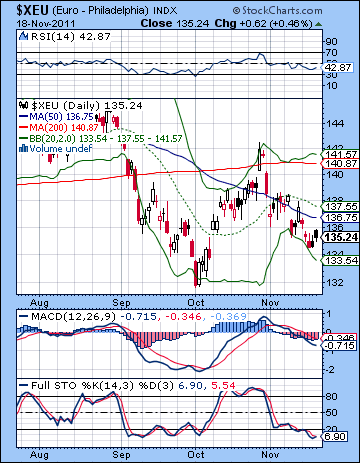 The Euro took it on the chin again last week as the bond vigilantes were out in force casting a skeptical eye on European debt. The Euro slipped below 1.35 before recovering to 1.352. The Dollar Index continued its march to the magical land of 80 closing above 78 while the Rupee weakened considerably to 51.34. This bearish outcome was largely in keeping with my albeit vague expectations. The early week was correctly identified as the more bearish possibility around the Rahu and Saturn influences. The second half of the week brought an attempt at a rebound but it was fairly tepid. As battered as the Euro may be at the moment, one wonders if it isn’t setting up for another bounce. We can see the outlines of a new bullish falling wedge pattern in the month of November and Stochastics are deeply oversold on the daily chart. It is possible we could see a push to the 20 or 50 DMA at 1.37 although that wouldn’t change this down move a bit. That late October spike above the 200 DMA is looking pretty lonely at the moment. Unless the Euro can consolidate at or above its previous low of 1.32-1.33, it may doomed to go lower, perhaps to 1.28. If it can reverse this week, then it could lay claim to forming a bullish IHS pattern which would have an upside target of 1.41. Well, I’ll believe that when I see it. Nonetheless, a move above the 20 line on the stochastics chart would be a concrete step in this direction.
The Euro could come under more pressure early in the week as Saturn aspects Venus. This is likely to reduce risk appetite and may force investors into the safety of the Dollar. Gains are more likely as the week progresses. Wednesday is perhaps a better bet than Tuesday although I would not rule out a gain on both days. The mood is likely to lift in the second half of the week as Venus is in aspect with Neptune. This will produce a nice hit in the Euro chart so that increases the probability of a bullish day or two on Wednesday and especially Thursday. Of course, US markets are closed for Thanksgiving on Thursday so that gain may occur on lighten than normal volume. Friday’s solar eclipse does not hit any planet in the Euro horoscope directly so I would not be surprised to see sentiment to stay relatively positive. Overall, there is a reasonable chance for a positive week for the Euro. Perhaps 1.37-1.38. Next week looks more dangerous as the late week Sun-Mars square will likely reverse this rebound rally in a decision fashion. December looks quite bearish for the Euro so I am expecting new lows to be put in at that time. 1.28 would be a conservative downside estimate by mid-December. I am unsure how long the corrective move will last. It is possible it could basically run right into early January. That seems a little too bearish even for me, but it is definitely a possible scenario here given the Jupiter-Saturn opposition aspect.
Euro
5-day outlook — bullish
30-day outlook — bearish
90-day outlook — bearish
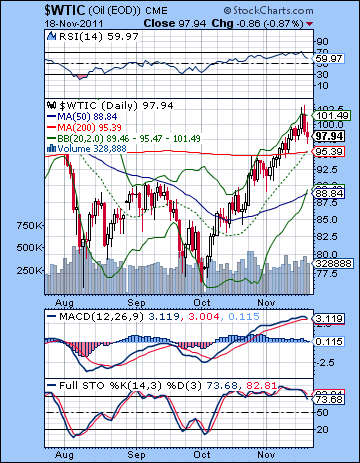 Crude oil stayed bullish for most of the week as it briefly traded over $100 on Wednesday and Thursday. It settled Friday back under $98 and put in a small decline for the week. This outcome was largely in keeping with expectations as I thought that any early week dip would be bought. Monday was lower as expected, but we did not even test the $95 support level. Prices rose as anticipated into Wednesday’s Mars-Jupiter aspect and then fell more steeply on the Sun-Saturn aspect on Thursday. Friday saw the selling continue despite a moderately positive Moon placement. Crude entered into overbought territory on the RSI this week before coming back down to earth on Friday. The technical picture looks more bearish now that MACD is on the verge of rolling over. Stochastics already has rolled over and is now below the 80 line. These indicators are strongly pointing to some kind of pullback. The moving averages remain bullishly aligned in the short term as the 5 is still above the 10 and both are above the 20. The inability of crude to stay above $100 is an important piece of evidence going forward. If it should break below $95 and the 200 DMA on any retracement, that would cast it back into its previous trading range. This would suggest that the $100 was a one-off false breakout generated by fleeting Mideast tensions and the gradual re-calibration of the price of WTI with Brent. $90 may actually turn out to be better support so we should watch to see if that holds.
This week is hard to call. The early week does offer a better at more downside, although that is less clear than I would like. The Venus-Saturn aspect on Monday should be bearish for most asset classes, but it may not quite pan out that way for crude due to a potentially positive placement in the Futures horoscope. For this reason, I would not be surprised to see gains early in the week. While declines are more possible into Wednesday, gains are more likely late in the week. There is no trading on Thursday due to a US holiday but Friday has a good chance for a gain on the Venus-Neptune aspect. So if the astrology is mixed, the technicals are divergently bearish. Overall, that may mean that we could slip below $95 Monday or Tuesday but recovery back above $95 is possible by Friday. Another run above $100 seems more unlikely here, as does a big move lower. Probably we will end up fairly close to where we are now. Next week looks more negative, however as the late week Sun-Mars aspect could see a sharp sell-off. Oil looks likely to trend lower for the first half of December at least. Some significant rebound rally is likely to begin in either late December or January. I am unsure just how strong this rally might be. It may only last a couple of week and we could end up moving tilting lower again starting in late January and February. This is likely to produce a lower low by March.
5-day outlook — neutral-bullish
30-day outlook — bearish
90-day outlook — bearish
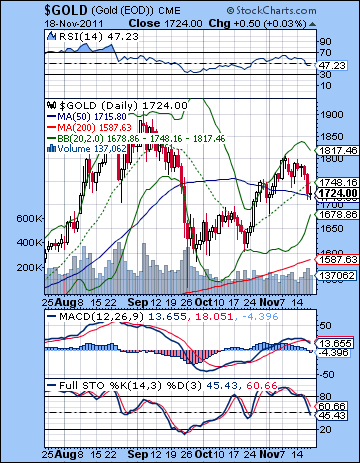 Gold fell sharply last week as fears of an economic slowdown reduced its appeal as a hedge against inflation. Gold declined more than 3% closing at $1724. This bearish outcome was largely in keeping with expectations as I thought that the growing influence of Saturn would be bearish. Monday was negative as expected as Saturn entered Libra that day just as Rahu was similarly distorting the otherwise bullish influence of Venus through the conjunction. As expected, we saw a small rise on Tuesday as the Mars-Jupiter aspect began to make itself felt. While I thought that Wednesday could be higher (it wasn’t), it was gratifying to see the largest decline of the week arrive exactly on cue with Thursday’s Sun-Saturn aspect. Friday’s rebound also came as no surprise as the Moon-Mars aspect sparked some buying. The technical situation of gold looks quite iffy here as the MACD is now in a bearish crossover. Stochastics are also in a bearish crossover and have much further to go before they are oversold. Price has settled at the 50 DMA which is a presumed support level. It’s unclear how long it can hold here given the technical pressures after its recent rally to the $1800 resistance level. There could be a strong pull towards $1600 now that the 200 DMA has risen to meet up with horizontal support at this level from the previous low. The larger question is whether gold can hold near that level or if it will retrace more deeply.
This week looks bearish for gold, at least in the first half of the week. Monday’s Venus-Saturn aspect looks bearish for gold, as does Tuesday’s Mars-Pluto aspect. Between the two of them, we should be a net loss for gold and there is the potential that it could be significant. The second half of the week should see some improvement, although Thursday’s holiday closing may reduce the upside. It is possible that we could see a gain on Wednesday. Friday also tilts bullish on the Venus-Neptune aspect. That said, Friday’s solar eclipse may undercut the probability of that positive outcome somewhat. Overall, I think we could see gold slide further on the week. Next week, the bearishness will likely continue, especially in the second half of the week. The Mars-Sun aspect could be quite negative with Friday standing out as particularly vulnerable. I am quite cautious about gold in December and January. While I am not certain it will correct sharply, I do think this is very possible and it could overshoot $1600 on the downside. By mid-December we may have a better idea of where gold is headed. I think there is a good chance we could $1600 by that time, so that would set up the possibility of another move lower. I certainly would not be surprised by a larger decline. Perhaps it will rally in late December and early January. This would set up another corrective move in late January and February.
5-day outlook — bearish
30-day outlook — bearish
90-day outlook — bearish-neutral

