- Gains more likely Monday and possibly Tuesday followed by declines into Thursday on Mercury-Rahu-Pluto
- Dollar to mostly strengthen into Thursday
- Crude may weaken after Tuesday
- Gold rises Monday with profit taking more likely after
- Gains more likely Monday and possibly Tuesday followed by declines into Thursday on Mercury-Rahu-Pluto
- Dollar to mostly strengthen into Thursday
- Crude may weaken after Tuesday
- Gold rises Monday with profit taking more likely after
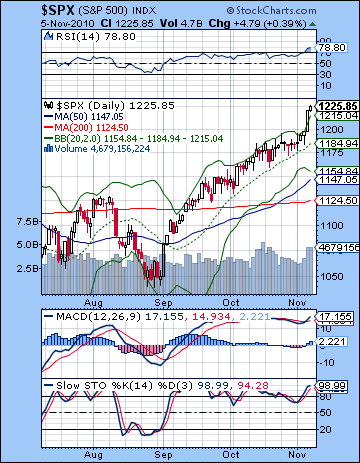 I fought the Fed and the Fed won. Stocks broke out above their April highs as investors reacted favorably to the Fed’s announcement of $600 Billion of QE2 stimulus on Wednesday. The S&P500 eclipsed its previous high of 1220 to finish at 1225 while the Dow closed at 11,444. Needless to say, it was a very humbling result given my expectation for a larger midweek pullback on the Mars-Ketu aspect. While the size of stimulus was very much in line with expectations ($500-750 Billion), it seems that there were enough investors that needed to hear it from Bernanke’s lips before piling into stocks. At the same time, I had noted that the presence of some positive aspects would generate some buying, most likely in the early week period and again on Thursday. Monday’s Venus-Pluto aspect corresponded with a small gain as did Tuesday’s Moon-Jupiter aspect. I was uncertain how Thursday would shake out, although I thought it would finish strong on the Mercury-Jupiter aspect so the gain did not completely come out of left field. So the big disappointment was the absence of any bearish energy on Wednesday. While some intraday selling occurred after the Fed announcement, bulls rushed in by the close and took prices modestly higher. Perhaps my biggest mistake lay in trying to marry the difficult medium term astrological influences with some plausible real world causes such as the Bernanke announcement. While QE2 is now out there for the market to digest, the medium term astro influences have not yet fully manifested. The bottom line is that there is still considerable downside risk to this market over the next few weeks. Admittedly, the Venus retrograde cycle that began in early October has been quite kind to stocks and that seems unlikely to change by the time it concludes on November 19. As previously noted, however, this week’s conjunction of Rahu and Pluto is another potentially negative influence for the market since both are considered malefic planets. Rahu symbolizes greed and uncertainty while Pluto represents power and control, especially of large organizations such as corporations. Since both are slow moving planets, the conjunction will be exact this Tuesday November 9 but will remain within one degree for the rest of November and into December. This pairing was one of the key reasons why I was generally bearish for Q4. The Rahu-Pluto conjunction will be highlighted by Mercury and Mars in a rare quadruple conjunction in the first half of December so it is possible that a pullback could extend into December. Previously I had wondered if this December decline would be a lower low or higher low from anything we saw in November. Given that prices have continued to rise into early November, the case for a lower low in December has been correspondingly strengthened.
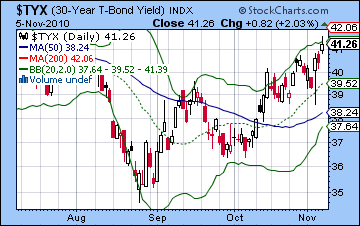
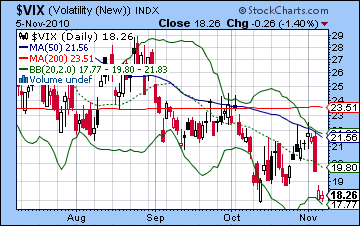
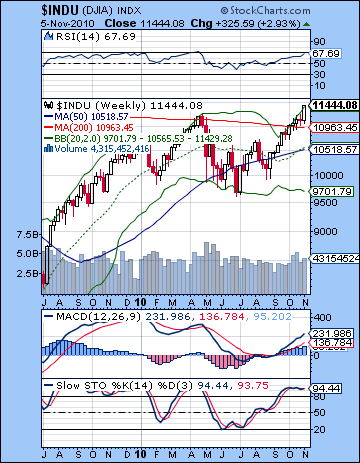 Bulls can well crow about their achievement of new highs for the year as the April highs on both the Dow and the S&P were taken out with this week’s rally. Once 1200 on the S&P crumbled, there was a wave of triggered stops and short covering that quickly accelerated the rise up to 1220 and above. How much damage has been done to the bear case? Quite a bit, since the highs occurred on good volume and we got an erasing of some negative divergences on the key indicators. Daily MACD is again rising and now in a bullish crossover while both Stochastics and RSI erased their negative divergences from last week. Prices broke above the 200 WMA on the weekly Dow chart, something that hasn’t happened since early 2008. Previous rally attempts had been turned back at this level and the rise here definitely improves the bullish case. This line (10,963) is now acting as support in the event of a correction. A quick move below this line would paint last week’s gain as a fake out, while another week above the 11K level would solidify the case for another leg higher in the bull rally. Another intriguing technical level is around 1228 on the S&P. This is the 61.8% Fibonacci retracement level as measured from the March 2009 low. While the Dow punched above its 61 Fib line (11,245), the S&P has yet to do so. For the market to undertake the next bull move higher, it would need several days above this level on the S&P to confirm. If it does, then it may well march to the 75% retracement level at 1320. If it falls back below 1220 and below 11,245 on the Dow, then the bears may have a more credible case. The rising channel is another obvious source of support, now around 1180-1190. A break below this rising channel support would greatly increase the prospects for a larger pullback. But are these new highs reason enough to now go long? On the contrary, there are indications that we may have reached the end of the rally. We can see that the bullish inverted head and shoulders pattern from the July low is near completion. The Nasdaq has already completed its IHS since it has outperformed the Dow and S&P. The S&P would have to reach 1250 for its IHS to be completed. If and when it might reach that level, it would be more susceptible to profit taking and a selloff. The Fed’s largesse has given rise to complacency as the $VIX has again fallen below 20. While past experience shows that the VIX can stay low for a long time without bouncing, it’s important to take note of its current condition. And with the announcement of a significant treasury buy back, one might have expected more gains in the treasury market. Not so, as the 30-year yield moved higher in Friday’s trade. This is potentially ominous for the Fed and the US economy as a whole. Despite the promise to intervene in the treasury market, bond investors are seeking a higher risk premium as the risk of inflation grows. But the precarious debt position of the US government means that long term yields cannot go too high or they will increase the likelihood of default. One would think that Bernanke will have to keep yields as low as possible in order to allow the US to continue to service its debt. If yields creep higher, he may be forced to squeeze liquidity out of the system. This would be negative for stocks and good for bonds and the Dollar.
 This week will see the immediate fallout — if any — from the Rahu-Pluto conjunction that is exact on Tuesday. This definitely has the potential to correlate with a decline, although we should note that its slow velocity means its effects could play out over a period of weeks. Monday offers the possibility for further gains on the Mercury-Venus aspect. Both planets are benefics, so we could see another up day. Tuesday is harder to call, although it would appear to have less in the plus column. The Moon conjoins Rahu and Pluto at the close so that could represent a potentially significant turning point. This looks like a time when investors rely on emotions, so it’s possible that we could reach some significant level around that time. Wednesday and Thursday look more bearish as Mercury aspects Rahu-Pluto. This is likely to create more uncertainty in the market. Given the upcoming G20 meeting in South Korea on Nov 11-12, we may have another plausible cause for a correction. Much of the current rally has been predicated on a falling US Dollar but this is straining its trading partners as they are furiously buying up greenbacks in order to keep their exports competitive. A coordinated effort to support the Dollar might therefore take the air out of the equity balloon either this week or perhaps next. Friday’s session looks somewhat more bullish, although it lacks any strongly positive aspects. A bullish scenario for the week would have Monday-Tuesday rise to 1240(!) followed by a decline into Thursday to perhaps 1210-1220. Friday would see a recovery back to current levels. A more bearish outcome would be a mild rise to 1230 Monday and then the possibility of a sharper decline midweek to 1200-1210 with Friday mostly flat. There is certainly a growing risk of a sharp decline in November and early December but this week isn’t a great candidate for it. We could see the start of it, but I would still lean towards the bullish scenario here.
 Next week (Nov 15-19) could see some large moves in both directions. Monday is oddly characterized by a very positive aspect (Sun-Jupiter) and a very negative aspect (Mars-Saturn). It’s quite possible these two will mostly cancel each other out but I do think the downside is quite real here. It may wait until Tuesday to start rolling, however. The midweek looks quite bearish indeed on the Mercury-Saturn aspect. While the end of the week could go either way, there is a genuine chance of significant downside. The following week (Nov 22-26) also looks bearish at least to start with some recovery likely on Thursday’s Mercury-Jupiter aspect. December may well tell the tale here as the quadruple conjunction between Mercury, Mars Rahu and Pluto does not look at all favorable. This alignment runs from about Dec 3 to Dec 14. This pattern alone could well produce at least a 10% decline and perhaps more. Overall, I would not rule out a decline back to SPX 1040 by early December. It may well be deeper than that, although that seems a bit like science fiction at this point. Then we should get a significant bounce from about Dec 15 to Dec 24 as Jupiter and Uranus again approach a conjunction. After a sharp but short selloff Dec 28-30, the New Year should begin positively. It is possible that prices could stay fairly strong until Jan 25 or so, and then begin to fall sharply into February. I expect a major decline of 15-20% at some point in Q1 2011 and February is the most likely time for it. March may also be bearish to neutral on the Jupiter-Saturn aspect although there should be a significant rally into June and July. Another decline seems likely in August and September. Whether we get a series of lower lows through 2011 is really one of the key questions. I lean towards that bearish view although it is not at all certain.
5-day outlook — bearish-neutral SPX 1200-1220
30-day outlook — bearish SPX 1050-1150
90-day outlook — bearish-neutral SPX 1050-1200
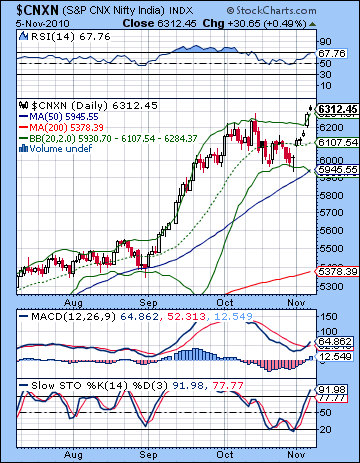 Stocks closed at new all-time highs last week after the Fed’s QE2 announcement improved prospects for greater FII inflows. The Sensex finished the week at 21,004 with the Nifty at 6312. This bullish result was disappointing as I had expected much more midweek downside on the Mars-Ketu aspect and the Fed announcement. As has been the pattern recently, the downside was barely noticeable as Tuesday saw the smallest of pullbacks and Wednesday actually saw gains. The week began more or less as expected, however, as the Venus-Pluto aspect coincided with significant gains. Similarly, I was also correct in expecting some late week buying on Thursday and Friday’s Mercury-Jupiter aspect. But my mistake was attributing too much influence to the midweek Mars-Ketu aspect. While I still believe we are on track for a significant correction in Q4, the problem is timing exactly when this will begin. I had thought that the Venus retrograde cycle (7 Oct-19 Nov) might be a good catalyst for this move, but aside from the very shallow 5% correction we got over the past weeks before last week, there really hasn’t been enough negativity to take prices down substantially. Last week’s twin announcements from the Fed and the RBI offered plausible ‘real world’ reasons for a selloff especially when coupled with the Venus retrograde cycle, but the market had other ideas. So where does that leave us? From a purely financial perspective, it is conceivable that the new stimulus money from the Fed will keep a support under prices and take the market higher. And yet, clouds are gathering as currency markets are growing more chaotic. The Fed’s injection of easy money has devalued the Dollar and pushed up most global currencies which is wreaking havoc with many export-led economies. There are growing calls for a new level of coordination between G20 nations. They meet in South Korea on 11-12 November and will pressure the US for greater stability and predictability in exchange rates. If there is a coordinated effort to boost the Dollar, then we could see all the air sucked out of the equity balloon in very short order. Much of the recent gains in the stock market have been dependent on liquidity and if and when this flow is cut off, it could have an immediate impact. Of course, it is possible that the the stock market bubble could be inflated still further but it seems increasingly unsustainable. From an astrological perspective, there are still some key negative influences that have yet to run their course. As previously noted, both Jupiter and Venus end their retrograde cycles within one day of each other, on 18 and 19 November respectively. I had initially thought this might mark an interim low in the market. Given that we have not yet seen much of a pullback, I now wonder if this may only mark a pause in a decline. I had also noted a very difficult quadruple conjunction of Mercury, Mars, Rahu and Pluto in the first half of December. While it was clearly negative, I was uncertain how it would fit into the landscape of a larger correction. It was unclear if mid-December would see a lower low from what we see in November. I am still uncertain when we are likely to see an interim bottom, but it seems somewhat more likely that it will occur in early December.
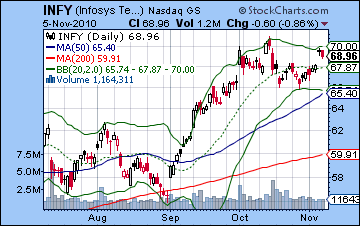
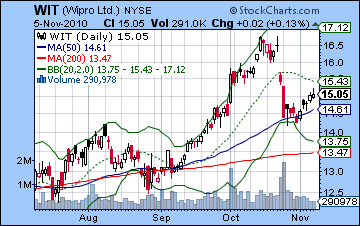
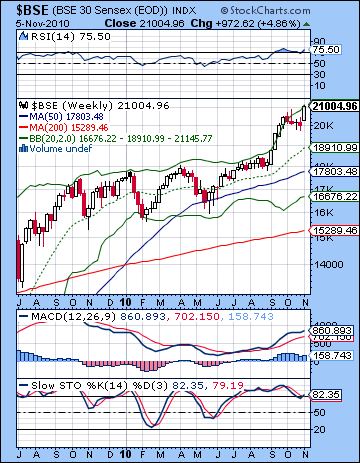 With the new highs, bulls have obviously taken the reins once again. Thursday’s breakout occurred on high volume so that is an important factor that increases the likelihood of higher prices in the near term. We can spot a broadening triangle pattern dating back to early October with resistance at 6400 and support currently at 5700. Given the bullish volume picture, one would think that 6400 will likely precede any test of 5700. While this is quite bullish, we can see that price is currently running up against the resistance of the rising trendline comprised of the lows of July 2008, the high of Oct 2009 and its high in Oct 2010. Its current level of 6312 is still below this trendline and resistance lies around 6400 for mid-November. A break above this level would therefore be even more bullish — as if that was possible. If we understand the Nifty from this perspective, however, we can see that further rises to 6400 do not preclude a significant correction. The technical indicators are showing a very overbought condition here. As I noted last week, Stochastics (91) were perhaps more likely to see a bounce since they were under the 20 line. Now they’ve done a complete flip and stand in overbought territory. This increases the chances of some kind of pullback. RSI (67) is creeping back up towards the overbought area but isn’t quite there. We can see a negative divergence with respect to previous highs showing that the current rally is not sustainable. MACD is now in a bullish crossover although there is still a glaring negative divergence here with respect to the October high. Price closed above the top Bollinger band indicating possible greater upside, even if it does not represent value. The weekly chart is somewhat less impressive, however, as price is still just underneath the top Bollinger band and a negative divergence is in evidence in the RSI (75). Any correction would likely test support initially at the 20 DMA at 6100. If this fails after a test or two, then we could fall down to the bottom Bollinger band at 5950, which also happens to be the 50 DMA. Below that, the bottom of the broadening triangle at 5700 would likely bring in new buyers. Significantly, the 5700 level also roughly corresponds to the previous resistance of the rising channel that was broken to the upside in early September. While the bullish case is strengthening, it is by no means rock solid. Much of the gains have come as a result of Fed-driven liquidity injections and a falling US Dollar. A move to boost the Dollar either through Fed action or by coordinated international action could spell a quick end to the rally. Exporters are finding the high Rupee to be tough going here as Wipro’s gains last week were more modest (WIT). Infosystems (INFY) has similarly failed to make new highs.
 This week looks mixed as we will see what effects, if any, we can observe from Tuesday’s Rahu-Pluto conjunction. Monday may begin negatively as the Moon joins Mars in Scorpio. However, there is also a potentially offsetting positive aspect between Mercury and Venus here. It may be that we get a down open with growing strength through the day. Tuesday looks somewhat more bullish, at least to start and we may see 6400 on the Nifty at some point. Wednesday looks somewhat more negative as Mercury forms an aspect with Rahu and Pluto. This may well carry into Thursday so there’s a good chance for a net down over this two-day period. Thursday looks more bearish than Wednesday. Friday is harder to call. The bearish Mars-Saturn aspect is getting closer here but it’s not quite as close as I would like it. It may be that Tuesday’s Rahu-Pluto conjunction acts as a dividing line between rising prices Monday and Tuesday with price declining starting on Wednesday and lasting through Friday. A bullish scenario would see gains to about 6400 by Tuesday’s close and then a pullback to 6250 by Thursday followed by a mild rise on Friday back to near current levels around 6250-6300. A more bearish scenario would still likely see 6400 by Tuesday followed by a deeper pullback to 6100 and then mostly flat Friday for a negative week overall. I would lean towards the bullish scenario here.
 Next week (Nov 15-19) sees the increase in the likelihood of a larger decline, although there is still the possibility of a mixed week. The week begins with two potential offsetting aspects: a bullish Sun-Jupiter aspect and a bearish Mars-Saturn aspect. These could end up cancelling each other out but they also increase the chances of a big move. Given the current stressful medium term influences, we could see negativity prevail here. The close looks somewhat more positive however. The Mercury-Saturn aspect should increase bearish sentiment into midweek. Then an up day Thursday on the Sun-Uranus aspect followed by another possible up day Friday on the Sun-Venus aspect. The following week (Nov 22-26) looks more bearish at the start with some gains possible at the end of the week. The the first half of December looks quite bearish as there is a rare quadruple conjunction involving Mercury, Mars, Rahu and Pluto in Sagittarius. To make matters worse, Mercury will be turning retrograde in the middle of it. This is likely to represent another significant move lower. A possible interim low may occur near 14 December. After that, the market should rally into the 24th. Late December may be bearish, however, and then early January should be mostly positive. We could see another run towards the November high at this time. Saturn turns retrograde on 26 January so this may factor into the next major leg down. This could well last into February. Stocks may stay fairly weak until April and the Jupiter-Saturn aspect and then begin to rally into June and July. Whereas Q1 2011 looks very negative, Q2 looks more bullish. Q3 will likely begin bullish and then turn sharply bearish by September. I am expecting a series of lower lows through most of 2011.
5-day outlook — bearish-neutral NIFTY 6200-6300
30-day outlook — bearish NIFTY 5700-5900
90-day outlook — bearish NIFTY 5500-6000
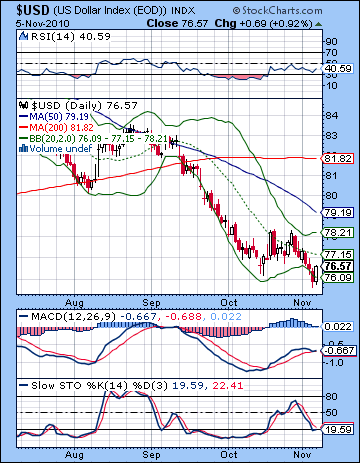 Resistance was futile against the full force of the Fed last week as Ben Bernanke took the US Dollar out to the woodshed. After making a frightening low below 76 on Thursday, it recovered strongly on Friday to finish at 76.5. The Euro climbed above 1.40 while the Rupee finished at 44.12. While I correctly expected the Dollar to suffer from Thursday’s Mercury-Jupiter aspect, it didn’t receive any benefit from the midweek Mars-Ketu aspect. It was another week of probing for a bottom in a muddy lake filled with freshly printed Bernanke pesos. The Dollar is perched precariously on the rising trendline off the bottom going back to 2008. A break below 75 would be quite damaging and would likely see it quickly test all-time low at 71. I’m not sure if even Bernanke wants that right now. Fortunately, the technical picture offers some rays of hope. Stochastics (19) are back under 20 and may be preparing for a more durable move higher. MACD is on the verge of a bearish crossover but has yet to do the deed. RSI (40) is trying to get up off the mat and Thursday’s flirtation with the 30 line may be enough to bring in more bargain hunters. Price hit the bottom Bollinger band (again!) and may be poised for another thrill ride to the top Bollinger band at 78. Support is probably fairly solid at 76 while resistance lies near the 79 level and the 50 DMA. This is also around the top of the falling channel off the June high. The short Dollar trade seems very overcrowded these days as bulls are numbering less than 5 percent in sentiment surveys. One wonders if the G20 meeting in South Korea will arrive at some coordinated plan to stabilize world currencies. Currently, individual countries are having to buy back dollars in order to keep their own currencies from rising too high. Bernanke has come under increased criticism this week from various international bankers for the havoc his QE2 policy is wreaking upon global financial markets. He seems unlikely to publicly blink in the face of this opposition, and yet he has to eventually recognize that the Dollar cannot continue to fall indefinitely lest US debt becomes less attractive to foreign buyers. Since treasury yields are continuing to rise, Bernanke may be forced to remove some liquidity in order to keep yields low. This could boost the Dollar.
This week offers another plausibly bullish case for the Dollar. Like last week, however, there are a mix of aspects so we can’t be certain that the good days will outnumber the bad. The early week looks generally worse as the Mercury-Venus aspect on Monday could increase risk appetite. This is usually negative for the Dollar although there are increasing signs that this usual relationship may be breaking down. Friday’s rise came on good jobs number which also corresponded with a rising Dollar. The midweek period looks more reliably bullish with gains most likely on Wednesday and Thursday. Friday is harder to call although it seems somewhat less reliably bullish. Next week also looks fairly decent for the Dollar with the early week looking very volatile and potentially very positive also. We could see a big move higher on Tuesday and perhaps on Monday also. Given the diametrically opposing energies on Monday, I would not completely rule out a big down day at that time, however. The Dollar should strengthen over the rest of November but December may see it weaken again, especially in the second half of the month. January may see a recovery in the Dollar, perhaps back to 80-82 but more weakness looks likely in February. The outlook for 2011 still looks bearish from here, albeit with some significant rallies mixed in especially in March and June. The August-September period looks very negative for the Dollar.
Dollar
5-day outlook — neutral-bullish
30-day outlook — bullish
90-day outlook — bullish
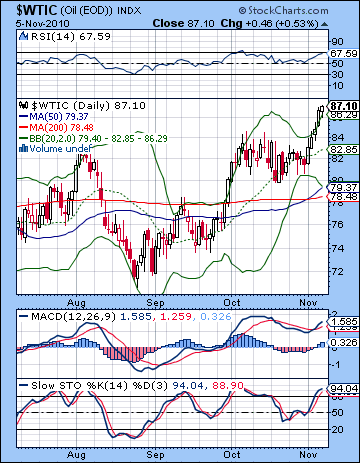 As most commodities rallied on the Fed news, crude oil also benefited from Uncle Ben’s $600 Billion gift as it closed Friday above $87 on the continuous contract. While I noted a couple of positive aspects on Monday and Thursday last week, Ketu’s menace proved to be more of a mirage than anything else as prices rose on all five days. Mirroring equities, crude has climbed all the way back to its April highs and actually closed above its highest April close. It still has a ways to go before it challenges the heady days of 2008, but the weakening Dollar is revealing a possible inflationary future as commodities take flight. While the move was large, crude seems overbought here and does not offer a compelling case for more upside. Price has moved to the top Bollinger band and RSI (67) is inching its way back to the overbought area. Nonetheless, it remains in a negative divergence with respect to previous highs. MACD is now in a bullish crossover although it, too, also remains in a negative divergence. Stochastics (94) are now overbought and increase the likelihood for a move lower. While the Fed’s free money program could conceivably take crude higher, there are few obvious areas of resistance. Current prices are very close to the 50% Fibonacci retracement level from the Oct 2008 low which would be $92. That is perhaps the most plausible resistance target. Support is likely found near the 20 DMA at $83. Below that level, there is a clustering of the bottom Bollinger band, the 50 DMA and the 200 DMA near $78-79. Given the rising channel off the July low, it seems that any correction will likely find immediate support above the previous low of $73.58. A break below this level would reverse the bullish trend of higher highs and higher lows.
This week will see moves in both directions. Monday has a reasonable chance for gains on the Mercury-Venus aspect. As Mercury forms an aspect to the Rahu-Pluto conjunction by Wednesday, however, the odds will tilt the other way and favor the bears. The end of the week looks somewhat more positive, with Friday standing out perhaps as a decent up day. The indications are not as reliably strong as Monday’s. I would not be surprised to have prices stay at or near current levels this week, although there is a growing chance that the midweek pullback could outweigh the opportunities for gains on Monday and Friday. Next week should be more negative especially in the first half of the week with some recovery likely by Friday. There are some significantly negative medium term influences on crude that strongly suggest a down move is at hand. Most of this down move should come after Jupiter has turned direct on November 18 and it may well coincide with the Mercury-Mars alignment in early December. There is a good chance that $73 will be tested by then. After that, a rebound rally is likely until Christmas. Even with further gains likely in early January, there will likely be another major move lower by late January and into February. This looks like a lower low than what we will see December. March and April looks quite mixed with short rallies followed by rapid selloffs although we should see a gradual rise in prices. A stronger rally seems likely in June and July after which we will see another huge leg lower into September and October.
5-day outlook — bearish-neutral
30-day outlook — bearish
90-day outlook — bearish-neutral
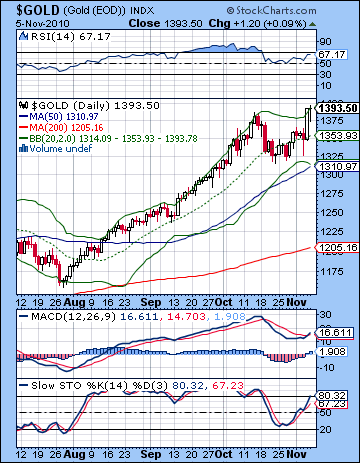 As the Fed opened the liquidity tap wider last week, gold jumped more than 2% to close at a new all-time high of $1393 on the continuous contract. While we did see some midweek weakness on the Mars-Ketu aspect, much of it was intraday as prices rallied most of the way back by the close. And while I thought Thursday would see some gains, I never quite expected it would result in the big up day that we got. Overall, it was a lesson in the ongoing bull market in gold where bad influences translate into modest declines and good aspects lead to even bigger gains. Technically, gold seems overstretched here as it has broken above it rising channel off its 2008 high. Last week’s high is higher than its October high so that is an argument for still higher prices. Aside from the unlikely prospect of the total collapse of the US Dollar, what is the technical argument for buying gold at this point? Actually very little, as most indicators are overbought. Price has moved to the top Bollinger band and so that loads the dice in favour of retracement. Wednesday’s intraday low of $1325 was very close to the bottom Bollinger band, so that may well figure in any future corrections. RSI (67) has moved very close to the overbought area and is in a clear negative divergence with respect to the previous October high. Stochastics (80) have similarly moved to the overbought zone and while they have yet to show a crossover, they do not present a compelling evidence for going long anytime soon. The recent rally has produced a bullish MACD crossover although it, too, still shows a strong negative divergence. Support is likely first encountered near the 20 DMA at $1350. As long as prices stay above the previous low of about $1320, the bulls will be fully in control of this market.
This week offers the opportunities for both gains and losses. Monday’s Mercury-Venus aspect may provide a short term lift that could take prices over $1400. Wednesday and Thursday may be more bearish, however, as Mercury lines up with Rahu and Pluto. Friday could go either way. The medium term aspects are still out there beckoning to take prices lower but it is quite possible they will stay fairly lofty here for another week. Next week increases the chances for declines. Monday’s Sun-Jupiter aspect may mark the beginning of a sharper correction, either on that day or on Tuesday the 16th. The rest of November looks mostly negative as does early December, although we shall have to see just how negative it will be. Given the various planets in play, there is a good chance for a correction back to the breakout level of $1250 or so. We should see a rally attempt in the second half of December. January looks more bearish, however, especially once the Jupiter-Uranus conjunction is past after Jan 4. A lower low than the early December low is definitely possible in January and February. March looks more solidly bullish.
5-day outlook — bearish-neutral
30-day outlook — bearish
90-day outlook — bearish

