- Declines probable on Mars aspects to Sun and Mercury this week; weakness to continue after US midterm elections in November
- Dollar may gain traction here; strength through much of October
- Crude oil to pullback this week; correction below $70 likely in November
- Gold set to correct in wake of Venus retrograde; sudden drops possible
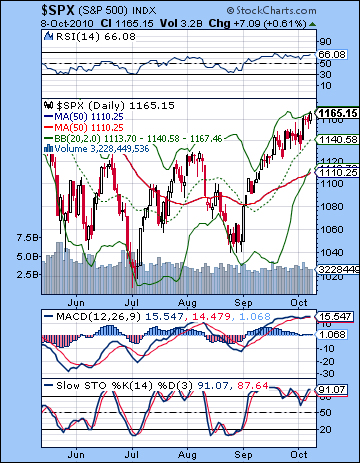 Despite another weak jobs report, stocks moved higher last week on the prospect of more Fed easing in the near future. The Dow gained 2% and closed at 11,006 while the S&P500 ended the week at 1165. The Dow is now just 2% below its April high, while the broader indexes are more than 5% off their highs for the year. Needless to say, this was a disappointing result given my more bearish forecast. Friday’s Venus retrograde station coincided with gains and not even the Mercury-Saturn conjunction was enough to turn the tide on this rally. While I had wondered aloud if the Mercury-Saturn conjunction might actually deliver a gain, I did not fully expect it. Before Friday’s folly, things were actually roughly following the script as Monday saw a decline on the exact Venus-Mars conjunction. While it was less than the hoped for 1%, it was nonetheless a pullback. As expected we got more bullishness into the midweek on the Sun-Venus aspect. I had not quite expected it would be so large (2%), but it at least it was adhering to the prevailing energies in the sky. Wednesday saw some early buying as predicted, but the bulls could not advance prices any further and the market ended flat. Thursday was down as expected, but only very modestly. And that set up Friday’s gain. Given the start of the Venus retrograde cycle here, I thought it might be a very significant day. Well, the only significance was another close above the 1150 resistance level and the knocking out of the left shoulder. I have previously noted how prices can sometimes rise into these major reversal patterns, even if prices do not fall on the day of. It’s possible that may occur this time around, although that thought does not provide much consolation. Retrograde cycles do have a decent track record of corresponding with price reversals, although it is nowhere near 1:1. The start of the Saturn retrograde cycle on May 25 closely mirrored the initial correction low on May 30. The Satanic low of SPX 666 in March 2009 occurred just one day after the beginning of a Venus retrograde cycle. So while they are not bankable indicators, they can be helpful and are worth paying attention to. The fact that Venus just turned retrograde yesterday opens up the possibility for a price reversal in the near term. This is perhaps more likely given the weakening of Jupiter here as it separates from Uranus and its recent conjunction. However, the failure of Saturn to take charge thus far in October and take prices lower is troubling. While the aspect with Ketu is still in place, it is fading and growing weaker, thus lessening the chances for a major correction this month. I still expect lower prices in the near term, but the notion of a crash seems all but dead. That said, Q4 still seems generally bearish from an astrological perspective, although the bulk of the decline may be put on hold until November and after the midterm elections on the 2nd. The guarantee of a further quantitative easing measures from the Fed (QE2) has clearly propped up markets in recent weeks and for all intents and purposes been discounted by the market. That means that any announcement of Treasury buying or other stimulus measures by Bernanke will probably not generate much upside as it will already have been priced in. It’s also possible that the market could vote with their feet if any further stimulus measures are seen as too small or smaller than expected. With the next FOMC meeting slated for the day after the elections on November 3, the disappointment scenario definitely seems more plausible, especially if the anti-spending Republicans do better than expected.
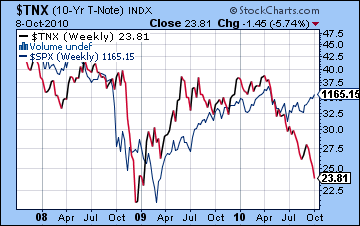
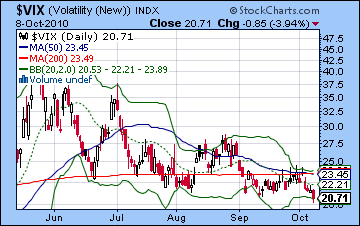
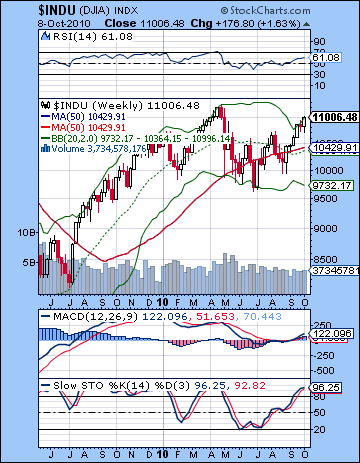 With the 1150 right shoulder resistance broken to the upside last week, the technical condition of the market tilted again towards the bulls although with some important caveats. The Dow closed above the 11,000 level and it is just one good day away from matching its high for the year. Hard to argue with that. The lag of the broader averages offers some consolation to the bears as the rally may be narrowing here as it climbs higher. But the break above resistance at 1150 forced a lot of short covering and likely took many bears out of the market. It’s a case of heads I win, tails you lose here as bad economic numbers merely hasten the arrival of more Fed money. With the prospects for more Fed stimulus, bulls can make a plausible case for more upside, at least up to previous highs. Perhaps the last best chance of the bears is to defend the falling trendline from the 2007 high. Current prices are almost exactly on this line and a weekly close above 1170 would jeopardize this resistance level. Of course, only a close above 1220 would turn this market into a more legitimate bull rally although it certainly has the momentum now. Daily MACD stubbornly stayed in a bullish crossover despite showing signs of rolling over. Stochastics (91) are overbought once again and RSI (66) is making another run to the 70 line. Both of these indicators are displaying a negative divergence however, which only a new high over 70 on the RSI would erase. The next resistance level is likely around the post-Flash Crash peak of 1175, and after that, 1220. It should be noted that price has again move to the top Bollinger band so that increases the chances for a pullback of some kind. In the event of a correction, support is initially around the 200 DMA around 1120 and below that, the rising trendline off the July low at 1070. The weekly Dow chart shows how price has also pushed to the top Bollinger band line and is also very overbought at 96 on the Stochastics indicator. The $VIX fell but significantly it remains above the 20 level despite equity prices continuing to rise. This is a divergence that can also offer bears some hope. Bond yields continue to fall as the Fed’s promise to buy back treasuries to the tune of a $1 Trillion or more is putting in a solid price floor. This is having a corrosive effect of the Dollar, however, as it is on the verge of breaking through some significant support level. The short trade on the Dollar seems over crowded at this point with bullish sentiment hovering near 5% — a potential reversal point from the contrarian perspective. From the weekly $TNX chart, we can also see how equity prices are lagging treasury yields over the past few months. Usually equity prices and yields more in unison but the recent stock rally has seen a major divergence from that pattern. One of these will have to reverse direction soon. I think bond yields will stay low until November at least, so that increases the chance that equities will reverse before bonds do. After November, yields are likely to drift higher.
 This week again offers more support for the bearish scenario. First, in the wake of Friday’s Venus retrograde station, there is a somewhat greater chance that prices will retreat. More specifically, there will be some close aspects involving Sun, Mars, and Mercury this week that also do not incline towards the bulls. Monday begins on a Sun-Mars aspect that seems bearish. While it is not a major aspect, it could still be enough to take prices lower. Just how much lower will be an important test of the Venus retro terrain. If it’s more than 1%, then that will be a signal that the bears may have legs here and the market is poised for a fairly significant pullback. If the decline is more modest or if prices are flat, then that would suggest that the pre-election corrective phase may be muted. I would expect the negative sentiment could well spillover into Tuesday’s session but I am unsure if prices will stay down by the close. There is a minor Venus-Uranus aspect forming on Tuesday-Wednesday that is likely to see some bullish moves take root. Could we see a higher high on this midweek pattern? It’s certainly possible. It we don’t, however, that is another clue that we are headed lower in the near term. The end of the week again looks bearish as Mercury approaches an aspect with Mars. Friday looks worse than Thursday as Mars will move into a minor aspect with Rahu. This pattern has the potential for taking prices down significantly. If there is going to be anything like a crash in Q4, this pattern is one of the prime candidates. In light of the indefatigableness of the bulls recently, it seems more likely to take markets down by only 2%.
 Next week (Oct 18-22) looks more mixed to bullish with a potential for a big gain early in the week. The aftermath of the Sun-Mercury conjunction lines up with Jupiter, Neptune and Uranus and could drive the market up significantly, probably on Monday and especially if Friday has seen a sharp selloff. Tuesday also tilts towards the bulls on the Mars-Jupiter aspect, although that seem both less certain and less positive. Sentiment may worsen as the week progresses, as Mars forms an aspect with Saturn on Thursday and Friday. Overall, there is a genuine chance for gains during this week since the early week bullishness could outweigh the late week bearishness. The following week (Oct 25-29) also offers a good chance for gains as Monday’s Mercury-Venus conjunction looks positive. The Sun-Venus conjunction on Wednesday and Thursday (27-28th) also seems generally bullish, although I would note the aspect from Ketu could confuse the issue somewhat. I don’t think this will be enough to flip the outcome completely, but it does somewhat lessen the reliability of this bullish pairing. Generally, there is a plausible case to be made for a rise in prices into the midterm elections on November 2. I’m not convinced this will happen due to the negativity of some medium term factors, but it is certainly possible. If we get a mid-October pullback, then the pre-election rally may end up not exceeding current levels, but it does suggest that any significant correction that tests the July low (1010) will probably be delayed until November and perhaps into early December. The Rahu-Pluto conjunction of November 9 is likely a critical factor in this forthcoming correction. But I do expect a resumption of bullishness starting in mid-December at the latest and continuing into early January. Q1 2011 looks generally bearish, with March looking more negative. Q2 2011 looks more bullish with a rally more likely from April into July.
5-day outlook — bearish SPX 1100-1120
30-day outlook — bearish-neutral SPX 1100-1150
90-day outlook — bearish SPX 1050-1100
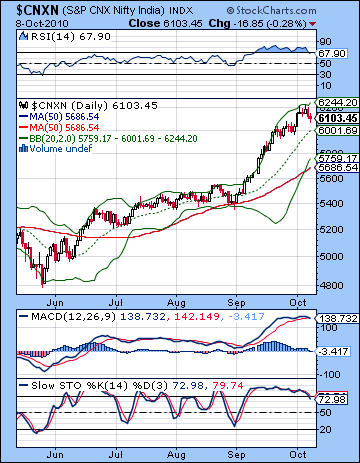 Stocks in Mumbai moved lower last week on profit taking ahead of the release of quarterly earnings reports. After making intraday highs on Monday, the Sensex closed down 1% at 20,250 while the Nifty closed at 6103. While I had been bearish here, the extent of the pullback was lacklustre to say the least. Monday’s exact Venus-Mars aspect resulted in only a flat market with a very small decline on Tuesday. The midweek gain finally arrived on Wednesday as the Sun-Venus aspect coincided with a greater interest in spending and speculation. As expected, the late week period was more negative as Thursday’s 1% decline was followed up by another mild pullback on Friday. This coincided with the Mercury-Saturn conjunction and the beginning of the Venus retrograde cycle that will last into mid-November. The inability of last week’s planets to produce more of a move down increases the likelihood that the bulk of any correction will likely not appear until November. Saturn is still in a tense aspect with Ketu but its effects are weakening. Jupiter is still just two degrees past its aspect with Uranus and it seems to be retaining enough energy here that is preventing any significant correction from taking place. The Venus retrograde station offers another possible reversal point although it is unclear how much immediate bearishness it will release. The Venus retrograde period will last until 18 November but it seems unlikely it can trigger a sudden, major correction during the month of October. Possible, but not likely. While the whole of Q4 tilts towards the bears, it seems more likely that we will see more downside with the conjunction of Rahu and Pluto around 9 November. This will coincide with several other bearish alignments that should take prices lower. Interestingly, this will coincide with the post-election period in the US. The midterm elections of 2 November are crucial for Obama’s economic vision to be realized. Many commentators have speculated that the Fed prefers Obama’s Democrats because they favour government intervention in the economy. For this reason, the Fed may be intervening in the financial markets to a greater extent ahead of the election in order to keep stocks high and the public mood as positive as possible. This would enhance the chances of the Democrats retaining control of the Senate. Regardless of how much Fed manipulation there may be beyond their quantitative easing to buy large amounts of government debt, it is very possible that the election brings changes in financial markets. If Republicans do well, then US stocks could sell off in anticipation of greater spending constraints on Obama and Bernanke, and thereby take Indian markets down also.
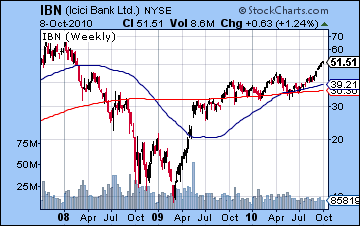
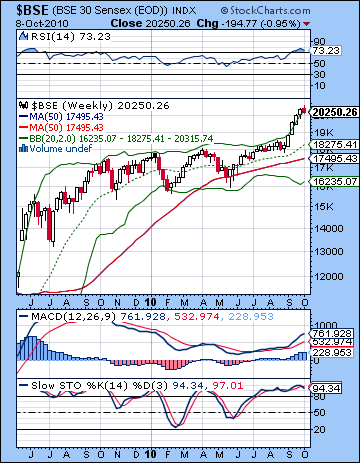 The technical picture remains strongly bullish. Stocks are in an ascending channel marked by a series of higher highs and higher lows. The indices have yet to reach their previous highs from 2008 but are less than 5% from those levels. Bulls can feel comfortable in the knowledge that the moving averages are all sloping higher although they may well wonder how much further prices can advance given the proximity of the previous high. The prospect of a bearish double top patterns hangs over the market now as a failure to break above the all-time high of 21,206 on the Sensex would invite more profit taking. The likelihood of some kind of pullback is also evident from the key technical indicators. Daily MACD on the Nifty is forming a bearish crossover here. Given how high above the zero line it is, this situation is perhaps more reminiscent of the steeper pullback in May than the shallower correction in June. Stochastics (72) have slipped below the 80 line and are also signalling a greater likelihood of a correction. RSI (67) has come off its recent highs above the 70 line and still shows a negative divergence with respect to equivalent prices from three weeks ago. Clearly, momentum is slowing here. Price bounced off the top Bollinger band early in the week but remains well above the middle line (20 DMA). Even a very modest pullback would likely test support there, currently near 6000 on the Nifty. If anything, the weekly chart of the BSE is even more overbought. Prices closed on the top Bollinger band last week and the RSI (73) remains in overbought territory. Stochastics (95) are also overbought although we should note that given the torrid pace of the rebound rally, they have not been below the 20 oversold line since early 2009. Weekly MACD is in a bullish crossover although a negative divergence is clearly evident. A deeper correction would test support at the top of the previous rising channel at about 5700 on the Nifty. The next key level of support is likely around 5000/16,000 which is the approximate location of the bottom Bollinger band on the weekly chart and a little below the 200 DMA on the daily chart. ICICI Bank (IBN) made further gains last week although it remains well below its previous highs from 2008. The vulnerability of the banking sector is revealed in the fact that while the overall indices are within less than 5% of their all-time high, India’s leading private bank is more than 30% off its 2008 high. Overall, the technical picture favours a correction of some size in the short term against a mostly bullish medium term outlook. The general picture will stay bullish unless the previous significant low of 5350 is taken out. If it does, then the bears will gain more converts as the double top will start to loom large in the rear view mirror.
 This week looks mostly bearish in the wake of the Venus retrograde cycle that began last Friday. This should be seen as a medium term bearish influence which can undermine some of the residual bullish influence from Jupiter. In addition to the plausibly bearish influence of Venus, we can also point to two negative aspects this week. On Monday and possibly Tuesday, there will be a tight Sun-Mars aspect which is usually negative for stocks. The midweek period looks more bullish, however, as Venus is buttressed from Uranus. This aspect seems likely to manifest late Tuesday and/or Wednesday, with Wednesday being somewhat more likely to be bullish. The end of the week tilts bearish as Mercury moves into aspect with Mars. Friday seems worse than Thursday in this respect, as Mars also has the added burden of an aspect with Ketu. This fiery combination has the potential for a sharp, sudden move lower. I am expecting a significant down day here, presumably something greater than 1%. While previous negative aspects have been disappointingly modest over the course of this recent rally, this will be a good test of the effect of the Venus retrograde cycle. It may well create a more hostile environment for stocks so that tense planetary aspects have more downside impact. We shall see. A bullish scenario might unfold with a small decline Monday followed by a larger gain into Wednesday that takes the Nifty back to test 6200 intraday and then down again Friday to current levels around 6100. A more bearish scenario (which I favour) would see a decline to 6000 or below on Monday and then a rise back to 6100 by Wednesday and then down hard at the end of the week to 5800-6000.
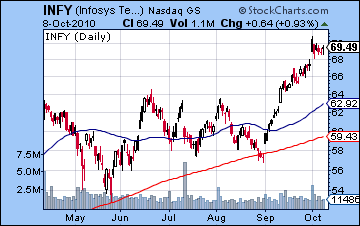 Next week (Oct 18-22) looks quite bullish to begin the week as the Sun-Mercury conjunction lines up sympathetically with Jupiter and Neptune. A 2% rise is quite possible here on Monday and into Tuesday. Sellers are more likely to prevail going into the end of the week as Mars forms a minor aspect with Saturn. A positive week is definitely possible. The following week (Oct 25-29) is likely to begin with gains as Mercury conjoins Venus on Monday. The end of the week features a Sun-Venus conjunction. This is normally a very positive combination but it occurs in close aspect with Ketu so it is possible this could upset the balance. For this reason, it is harder to call this outcome for this particular week. I would lean towards a bullish outcome, although it could very well end fairly flat. November is likely to begin bearishly as Mars aspects Ketu on the 3rd. This should mark the beginning of another move lower through much of November that should break support at 5700 and could well test 5000. There are a couple of different patterns in early December that may constrain the market to some extent, but Jupiter will once again conjoin Uranus in the second half of December so a rebound rally seems quite likely then. It seems unlikely that the Sensex will climb all the way back above 20,000 at that time. More likely it will retrace 50 or 61% off the bottom it makes in November or early December. January looks bearish to neutral but some recovery is likely going into February. March and April looks very bearish and are likely to send prices lower by another 20-30%. Q2 2011 looks more bullish although 2011 as a whole seems quite bearish overall and this will probably carry over into 2012. A sustained recovery is more likely in 2013 and 2014.
5-day outlook — bearish NIFTY 5900-6000
30-day outlook — bearish-neutral NIFTY 5700-6000
90-day outlook — bearish-neutral NIFTY 5500-5900
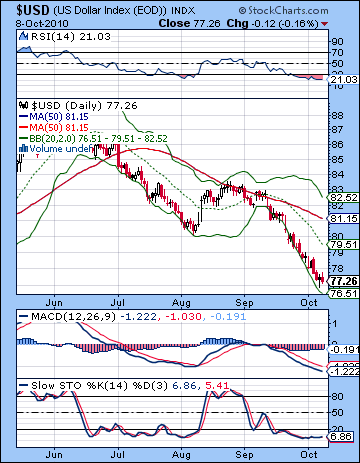 The US Dollar continued to be shunned as it fell further last week. The Dollar Index closed just above 77 as the Euro nudged up against the 1.40 level while the Rupee finished at 44.1. I had been equivocal about the early week period and as it turned out it was just more of the same as the greenback lost ground on four out of five sessions. The rubber band is getting stretched tightly here as bullish sentiment is now only 5%, which is very close to historic lows. By comparison, the low from December 2009 occurred with just 3% bullishness of the Dollar. This is good news for bearish contrarians as it suggests this selloff likely cannot go much further. The technical indicators are oversold on both daily and weekly charts. However, price action is so negative that previous negative divergences on the RSI and Stochastics have been erased. The Dollar is currently in a long term triangle pattern with resistance around 88 from the falling trendline and support near 76 offered from the rising trendline from the 2009 low. Price is very close to this support line so there is some reason to expect a reversal in the not-too-distant future. Last week actually saw some trades very close to this level so it’s conceivable the bottom has already been reached. Alternatively, there may be another test of this trendline in the week upcoming before the Dollar begins to rise. If that support at 76 does not hold, however, then it may fall to its all-time low at 74 quite quickly. Such a move would be extremely bearish for the Dollar, and consequently for the US economy as a whole. The Fed continues to argue for a no-questions-asked stimulus policy which is certainly inflationary and seems intent on devaluing the Dollar as a way of staving off a deflationary spiral.
The Dollar has a reasonable shot at gains this week as the Sun-Mars aspect does not appear favorable for equities. In addition, this aspect may activate the natal Mars in the Euro chart so that adds an increased level of confidence for an up move in the Dollar. The following week looks more mixed, however, so it is possible we may have to wait until November for any rally to gather momentum. A move higher into mid to late November is therefore the most probable scenario. Venus will end its retrograde cycle in hard aspect to the natal Saturn in the Euro chart, so it is possible that could mark an intermediate top in any Dollar rally. Once Jupiter begins to move towards Uranus again in December, the chances increase for the Dollar to fall again. We could see a double bottom formed in January then, although this needn’t be at the same level as the October bottom. Another rally attempt is likely going into March and April that may well continue into June and the Saturn station at 16 Virgo. The rest of 2011 looks bearish to neutral with a good chance of an end of the year rally. The Dollar is likely to recover in 2012 and beyond.
Dollar
5-day outlook — bullish
30-day outlook — neutral-bullish
90-day outlook — neutral
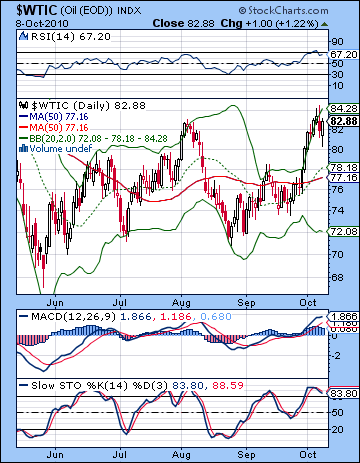 Crude oil extended its recent mini-rally as it closed above $82 for the first time since August. I thought we would see more downside on the Mars-Venus conjunction but Monday saw no downside while the bulls then stepped in and carried the week. As expected, we got higher prices midweek on the Sun-Venus aspect. Then my worst fears were realized on Friday as the Mercury-Saturn conjunction produced a gain just as the previous Sun-Saturn had one week before. The technicals on crude are in a decidedly upbeat mood as the previous high was taken out, if only by intraweek activity. Price will have to push higher on another one or two sessions before a new move can be confirmed. Daily MACD climbed to a point that the negative divergence with respect to the August high was erased — a bullish signal. A bullish crossover is still in effect here, although histograms may have peaked already. Stochastics (83) are again in the overbought area suggesting that this may not be the best time to enter into a long position. RSI (67) is very close to the 70 line and while indicative of a potential top, we should note a series of higher highs in the RSI that supports a genuine bullish trend. If recent previous moves are any indication, however, a correction of some size is likely as price bounced off the top Bollinger band last week. A correction back to the $77-78 level would be a fairly high probability here and would match the 20 and 200 DMA. Below that, support would likely be found around the $72 level which corresponds to the lower Bollinger band and the previous August low.
This week does incline towards the bears as Monday’s Sun-Mars may get begin the week with a decline. A midweek bounce is possible on the Venus aspect but sellers may well prevail towards the end of the week. While I am not expecting any huge selloff here in October, we could still see the $72-74 level tested. If the decline is muted or we only get more sideways moves, the chances for a more serious decline will increase as we move into November. At that time, transiting Saturn will oppose the natal Mercury in the Futures chart while Ketu will be in aspect to the Moon-Saturn conjunction. These have the potential to take prices down sharply over a relatively short time. $72 will almost certainly be broken here, and $60 will be in reach. December should see gains as Jupiter approaches another conjunction with Uranus. Q1 2011 looks quite mixed with declines more focused in the March-April time frame.
5-day outlook — bearish
30-day outlook — bearish-neutral
90-day outlook — neutral
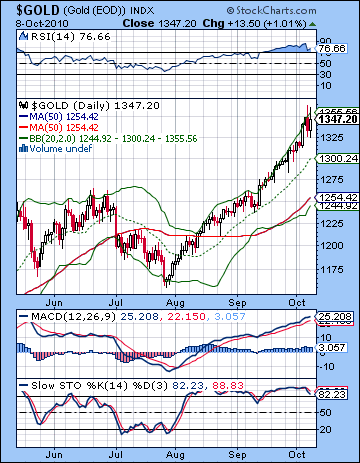 As the US Dollar plumbed new depths, gold extended its ascent last week closing at $1347 on the continuous contract. While I did not rule out further upside, I thought the end of the week would negative enough to wipe out any previous gains. Monday was down as expected, but only marginally. Then we got a big rise on the midweek Sun-Venus aspect. The end of the week was net negative as Thursday’s session saw a major decline on large volume. Friday’s rebound was a bullish engulfing candle so that largely neutralized the previous day’s bearishness. The beginning of the Venus retrograde cycle on Friday is key here as I had speculated that we may see an interim top formed on or near this pattern. Admittedly, this is much later than I had expected given the Sun-Saturn conjunction that only saw gold charge higher. The technicals remain as overstretched here as ever. Gold must consolidate some of these gains soon, or risk a sudden and disorderly decline. It may already be too late to avoid a sudden drop, although if it can find support at the 20 DMA at $1300, then perhaps it can avoid a deeper correction. RSI (76) has come down from its lofty heights but still remains overbought. Stochastics (82) are similarly overbought and MACD shows few signs of exiting from its bullish crossover. Price has moved right up to the resistance level I noted last week at $1350. This is the rising wedge trendline that dates back to 2008. Failure to punch above this line with almost certainly invite a pullback in the near term. Recent price rises have come entirely at the expense of the US Dollar. Gold is riding the QE2 wave that threatens to devalue the US Dollar. When the Dollar finally recovers, it has the potential to bring this gold rally to a shocking halt.
This week is shaping up to be an interesting one for gold. Not only are we in the wake of the Venus retrograde cycle now which could well signal a change in trend, we also have some different planetary aspects. Monday’s Sun-Mars looks bearish for gold and the Venus-Uranus aspect on Tuesday and Wednesday looks generally more positive. The end of the week seems negative again, however, so there is a good chance for a down week here. There is the possibility for a major decline here, perhaps even bigger than what we saw on Thursday. Next week may be more positive especially early in the week on the Sun-Mercury conjunction. The next several weeks look more difficult for gold, however, as there are a couple of problematic hits in the GLD ETF chart. Gold will almost certainly be negatively affected by the end of the Venus retrograde cycle on November 18 and the bearishness may well carry on into early December. So we could be seeing a top here around $1350 and then a retracement back down below $1200. After December 10th, however, gold should stage an important rebound as Jupiter will once again conjoin Uranus in aspect to the natal Sun in the GLD chart. That rally may well culminate on January 4 and the Venus-Jupiter aspect. It seems unlikely that price will match current levels at that time, although we cannot rule out that possibility. Gold may well drift lower in January before rallying again in February. Gold generally looks strong for 2011.
5-day outlook — bearish
30-day outlook — bearish
90-day outlook — bearish

