Summary for week of October 3 – 7
Summary for week of October 3 – 7
- Stocks vulnerable to more declines especially midweek; early week bounce possible
- Euroto weaken in midweek after brief rally attempt; October looks bearish
- Crude mixed this week but outlook still negative for the month
- Gold could rally to $1700 early in the week but declines more likely after
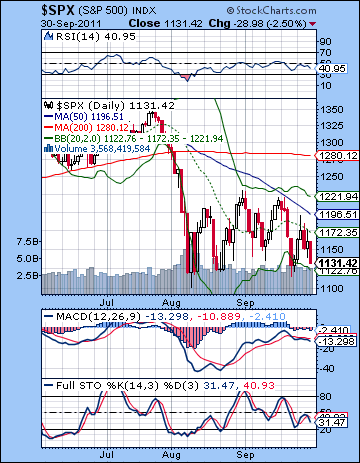 After another turbulent week stocks finished largely unchanged as Eurogeddon was postponed for another week after the Bundestag approved funds for Germany’s latest contribution to the Greek bailout fund. Reflecting perhaps a narrowing of market leadership, the Dow actually gained 1% closing at 10,913 but the broader indexes were flat to slightly lower with the S&P500 finishing at 1131. While the contour of the week roughly followed expectation, the overall outcome was less bearish than forecast. Certainly, the early week gains were very much in keeping with expectations as the Sun-Mercury-Uranus alignment on the New Moon on Tuesday produced two solid positive sessions. I thought there was a chance the SPX would hit 1180 at midweek on this early strength. It actually topped out at 1195ish — just stopping short of the falling trend line resistance. Wednesday’s decline coincided fairly closely with the Mars influence on the Sun-Mercury conjunction. More puzzling, however, was Thursday’s gain, especially since the market had been down in the afternoon. I noted the possibility that the bearish Venus-Saturn conjunction could manifest on either Wednesday or Friday, especially since there was a simultaneous bullish influence on the Mercury-Jupiter aspect late in the week. This Jupiter influence was likely the culprit for the jaw dropping ramp into the close of trading on Thursday. Friday saw the bears back in control as the Venus-Saturn conjunction continued to weigh down sentiment.
If the short term movements have been a little frustrating here, the medium term outlook is still proceeding according to plan as the Saturn-Ketu aspect continues to play out. This combination of bearish planets is serving to undermine confidence in any Eurozone solutions and is likely producing more negative reaction to economic news. While the aspect was exact last week, the market is still stuck in a trading range between 1120 and 1220. For all its apparent bearishness, this aspect has not really inflicted any major damage on the market. It is separating now and hence losing some of its potential energy but that does not mean that markets will be in a position to rise. As I mentioned last week, these passing transits of third planets — Venus last week, Mercury this week, etc — should bring out more of its bearish energy in the first half of October at least. We got a taste of the effects of these third planet alignments with Venus during Friday’s big sell-off. That is the main reason why I continue to have a bearish stance with respect to the market in the near term. As long as Saturn is getting activated by transit in this way, the market is likely to move lower. Rallies may only occur once we get more Jupiter in the picture. The first Jupiter aspect of note occurs in late October so that may provide a rough guide for a possible bounce. I have to say I’m not entirely clear how this move is going to play out. The Jupiter aspects in October and November seem to offer the possibility of a rebound rally, but Saturn is never very far away here. It makes me wonder if the rallies will be weaker than many people expect.
 The bears were victorious on two key fronts last week. First, they successfully defended the falling trend line resistance at 1180-1190. This produced a second lower right shoulder in the ongoing double head and shoulders pattern. This is a bearish pattern that tilts the market in the bears’ favour since prices are still below the 50 DMA and still well below the interim high of 1230. The midweek rejection at the trend line effectively postponed any test of those higher levels of resistance for an indefinite period and opened the door to lower lows in the weeks ahead. The second victory was won on Friday when the 1140 level was taken out on the S&P. This had been tested several times over the past month. The breakdown of this support level meant that the market will very likely fall to at least 1100-1120 in the near term and quite possibly lower. But bulls can still claim that until the lows are taken out, the market is priming for a major bounce. The SPX moved towards the bottom Bollinger band so that may bring in some adventurous buyers next week. But generally the direction is down for the market. MACD is in a bearish crossover, Stochastics are also in a bearish crossover and are heading down to the 20 line. We can even spot a bearish head and shoulders pattern in the RSI chart.
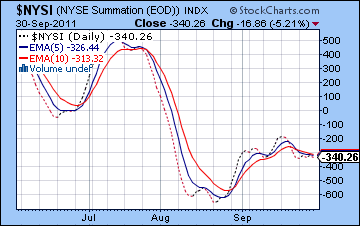
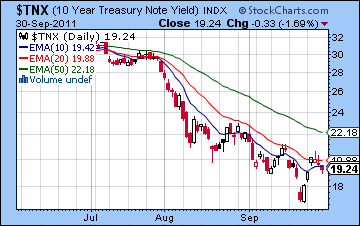
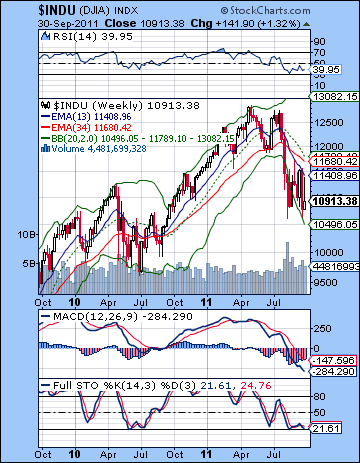 The medium term looks very negative indeed as the 200 DMA is now starting to slope down and thereby joins the 50 and 20 DMA. This is what a bear market looks like. In a bear market, typically the market rallies to resistance levels such as the 20 or 50 DMA but then sells off again as the consensus is too negative for consolidation at higher levels. The weekly Dow chart is reinforcing this notion that we have entered a protracted period of decline as the 13/34 EMA pairing is still in a bearish crossover. Until those reverse, there is no compelling reason to buy stocks in the market. We can see how recent rally attempts stopped at the 13 EMA and turned back down. Further confirmation of the medium term bear market is seen in the Summation Index. This breadth indicator is still negative as the 5 and 10 EMA are above the dashed line. Again, until the moving averages move below the dashed line, the market is unlikely to undertake a significant rally. Treasuries staged an important comeback at the end of the week as the 10-year yield again dipped below 2%. This is in keeping with a growing expectation for another recession as the resulting slowdown is likely to depress inflation rates thus making bonds more attractive. We will have to see just how low yields will fall here on any subsequent stock sell-offs. Bond yields may be close to making a bottom here although the next piercing move down will likely tell the tale. A bullish cross of the 5 and 10 EMA may provide a useful signal in this respect.
The planets this week tilt bearish again although there is some upside potential mixed in for good measure. The main source of bearishness appears to be concentrated around midweek and the Mercury-Saturn conjunction on Wednesday and Thursday. Actually Mercury will be in aspect with malefic Ketu on Wednesday and then move on to its conjunction with Saturn on Thursday so there is a good chance we will see significant downside across both days. Before that, however, I would not be surprised to see the bulls take charge and push prices higher. Monday’s Moon-Jupiter aspect could be bullish although I am uncertain if it will be enough to offset the increasing affliction of Mercury as the week progresses. Tuesday features the entry of Venus into Libra which could also boost sentiment briefly. I would therefore not rule out some significant upside on either Monday or Tuesday. It’s possible we could see two up days in a row, although that is likely pushing it for a market that looks so technically flawed. The late week could see some recovery as the Venus-Neptune aspect is exact on Friday. This makes Friday a better candidate for gains, especially if we have see some significant selling beforehand. The afternoon is more bullish than the morning perhaps due to the Moon-Neptune conjunction. This somewhat increases the likelihood of a positive close on Friday. Putting it all together, the probability of early week gains is a somewhat awkward fit with the current technical picture. Perhaps we gap down to 1120 on Monday morning and rise from there into Tuesday. This may not be a powerful up move, however, so it seems unlikely we could retest the trend line now at 1180. Perhaps 1160 or the 20 DMA at 1172 may be more reasonable targets. Then I would expect hard down into perhaps Thursday and we could test support at 1120 again or even 1100. It’s difficult to know the magnitude of this potential down move but it should be substantial. Then if Friday’s rebound occurs, it may retest broken support — whether its at 1100, 1120 or perhaps 1140.
 Next week (Oct 10-14) will likely see more downside although it looks confined to the second half of the week. Some upside is possible on Monday and Tuesday as Mercury enters Libra. But Thursday’s Sun-Saturn conjunction will coincide with a nasty Mars-Rahu aspect that could produce another major bout of selling. I am expecting lower lows sometime in October and this could well be it. Just how low we go is hard to say. 1000 seems overly ambitious at this juncture, but perhaps somewhere in the 1050-1080 area is more doable. The following week (Oct 17-21) looks more bullish as the Sun enters Libra and comes under the aspect of Jupiter. The late week looks negative again, however, so some of those gains will be erased. The big question is whether the second half of October will produce a meaningful rally. The Jupiter-Pluto aspect is a bullish influence to be sure, but it may be burdened by some very difficult aspects along the way. This may reduce the scope of the rally significantly. As I mentioned above, rallies may be underwhelming here. The alignment of planets in the last week of October look very bearish, especially on 25-26th. This could easily wipe out previous gains made in a rally attempt. So I have to admit a certain ignorance about the prospects for a rebound. Perhaps they will be confined more to the first half of November as Mars forms an alignment with Jupiter and Pluto on the 14-15th. There is a lot of negative planetary patterns in Q4 so I would not be surprised by any the size of any downside moves. It seems quite possible we will see SPX 1000 (10,000 Dow) sometime in October. By December-January, we should be lower than that, perhaps down to 800/8000. Hard to say for sure, however. So it’s a bear market, folks. And we are likely to stay in it for at least another year.
5-day outlook — bearish SPX 1080-1120
30-day outlook — bearish SPX 1000-1050
90-day outlook — bearish SPX 800-950
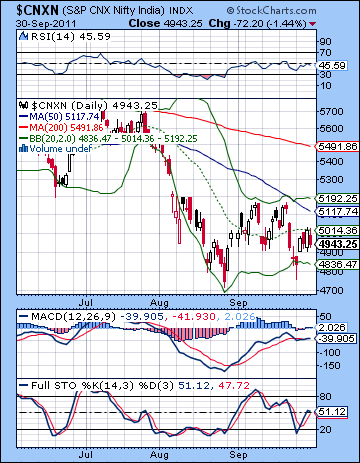 Renewed German commitment to prevent a Greek default buoyed markets last week as investors went bargain hunting near support levels. Despite briefly trading below 16,000 on Monday, the Sensex was 2% higher on the week closing at 16,453 while the Nifty finished at 4943. This bullish outcome was somewhat unexpected given my bearish forecast, although it was in keeping with the overall pattern of a bear market rally. As expected, the early week did see some gains, as Tuesday’s session coincided with the Sun-Mercury-Uranus alignment. Admittedly, Monday’s decline was did not fit neatly into my forecast as I thought the positive influences here would temporarily outweigh the negative of the Saturn-Ketu aspect. That said, the net result of the first two days of the week were positive. Wednesday’s pullback also correlated fairly well with the Mars aspect to Sun-Mercury. While I thought we would see more declines in the second half of the week, I was mistaken in calling for gains Friday.
More generally, I was correct in suggesting that the upside would likely stop near the 20 DMA at 5014. Rallies have been fairly weak recently, even if the Nifty is stubbornly clinging on to support above the 4800 level. So far, the bearish impact of the late September Saturn-Ketu aspect has been fairly muted although it has been reflected more generally in the financial world in the form of more talk about recession and rising credit default swap rates for many private European banks. Both Saturn and Ketu are planets of constraint and renunciation and their combination here tends to focus our collective attention on the shortcomings of the current economic situation. Debt levels (Saturn) are increasingly seen as unsustainable as revenues are likely to take a hit in the coming months as a result of the slowdown. Many commentators are now suggesting that the US may already be in recession. The bear market is about to enter a new and dangerous phase as previous solutions such as government stimulus is no longer political tenable. In other words, the Fed is out of bullets. Stimulus has not created growth but rather just inflation and asset bubbles. The equity bubble created by the easy money from QE1 and QE2 has burst through 2011. The gold bubble was also the result of government stimulus and it is in the process of bursting. Other commodities such as oil, copper and even real estate will follow suit as demand dries up once the easy money disappears. The Eurozone continues to talk up default solutions for Greece but there is mounting skepticism that the problem can solved through more borrowed money. The next round of debt de-leveraging is underway and is likely to continue through 2012 and into 2013. This will result in the falling value of most asset classes as bad debt is flushed from the financial system. For this reason, long term investors should be extremely cautious about buying equities. New buying opportunities will likely emerge in 2013, perhaps after the Nifty has formed a double bottom of 2500.
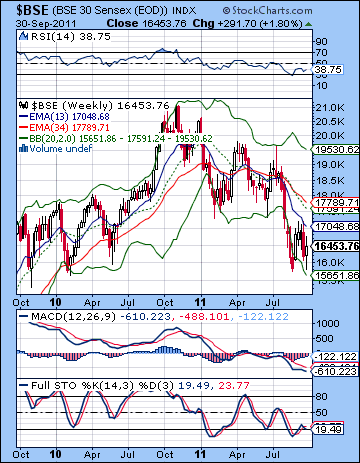 It was another defeat for the bulls on a technical front last week as the Nifty could not clear the 20 DMA at 5014. This was a sad comment on the state of the Indian market and points to lower prices ahead. While it could rise above this resistance level this week, it still has to confront the gap at 5200 in order to get any kind of rally underway. This is a tall order indeed. Even if that were to happen, most investors would likely take the opportunity to sell trapped long positions as the pessimistic bear market psychology takes hold. The moving averages tell the tale as the 200 is above 50 which is above the 20. Worse still, all three are falling. As long as this arrangement exists, there will be no compelling reason to undertake a significant long position. Nonetheless, the bulls are currently camped out near the 4800 level where they are holding on for dear life. If the Nifty closes below the previous low of 4747, then it would like invite a new wave of selling. Monday’s low touched the bottom Bollinger band, so that is an source of solace for the bulls.
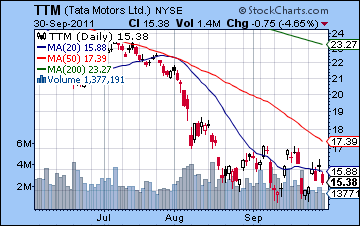
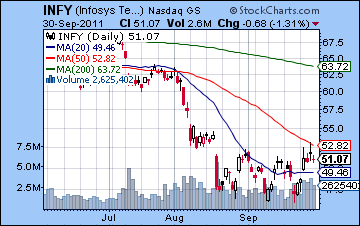
MACD is flat and on the verge of a bearish crossover. When this happens, this will surely seal the fate of the current market and usher in another move lower. Stochastics is also on the verge of a bearish crossover of the red signal line. Perhaps it can delay it while it runs up to the 80 line, but given all the other negatives here, there is little reason for optimism. One could point to the positive divergence on the MACD with respect to the previous low as a possible source of future strength. That’s true, but the weight of the evidence inclines it to the bearish side. Support may be found temporarily at the 4500 level, but that does not look very solid. It could hold for only one or perhaps two tests. 4000 is more reliable support where more buyers would come in to snap up bargains. The weekly BSE chart shows just how far removed this market is from being a "buy". The gap between the 13 and 34 week EMA are widening now. For those seeking to buy into equities for the medium and long term, the 13 week EMA needs to move above the 34 week EMA. The MACD crossover in narrowing suggesting a slowing of the decline but it is not giving a buy signal just yet. Moreover, Stochastics are in another bearish crossover suggesting another move down is imminent. If the market as a whole remained in a precarious condition, last week’s gains showed up in many stocks. Tata Motors (TTM) bounced from its double bottom last week, although it may be in the process of forming a bearish diamond pattern. It has yet to match previous highs and the 50 DMA remains out of reach. If the rally should continue, significant profit taking would likely occur near the 50 DMA. Infosys (INFY) has benefited from the falling Rupee and its recent double bottom as it also rallied last week. It is in somewhat better shape as it tested its 50 DMA late in the week. As it was its first test, it was rejected. A close above this line would likely increase investor confidence and produce an attempt to fill the gap at 56.
 This week offers another opportunity for the bearish Saturn-Ketu energy to manifest through the conjunction with Mercury. This conjunction occurs on Thursday when the market is closed so it is possible that the downside may manifest on Wednesday and/or Friday. Before this aspect, the early week may actually tilt in favour of the bulls as Venus enters Libra on Tuesday. Whether this will be enough to offset the build up of negative energy is unclear. Nonetheless, there is a good chance that either Monday or more likely Tuesday will be positive. I would also not be surprised to see a net positive result across these two days. It is therefore possible that last week’s highs at 5014 could be revisited and it is conceivable that 5100 could be achieved. I would not call this likely, however. The Mercury-Saturn conjunction is looming here and could pack a significant punch, even if it compressed into two trading days. My expectation is that the downside will be greater than any preceding upside. Friday is a more complicated matter. There will be competing influences in play at this time. The Mercury-Saturn conjunction will be close although separating but at the same time, a Venus-Neptune aspect will be forming, especially in the afternoon session. This could produce a bearish negative morning with some moderation of the declines by the afternoon. I would still lean towards a bearish outcome here, although there is a chance for a significant bounce at the close. Overall, the market should finish lower this week, although I think support at 4800 may hold yet again. Much will depend on the extent of any early week gains. If these are small, and Wednesday’s session is very negative as it could be, then there is a possibility that 4747 could even be tested. I don’t think it’s likely, but it’s nonetheless very possible given this Saturn-Ketu aspect.
 Next week (Oct 10-14) will see the Sun encounter the Saturn-Ketu aspect. Another bearish result is therefore probable. Some early week gains are possible here, however, as Mercury enters Libra on Sunday and Venus forms a minor aspect with Uranus. However, these gains may be fleeting as the Sun comes under the aspect of Ketu on Tuesday and Wednesday and conjoins Saturn on Thursday. Friday’s Mars-Rahu aspect makes the end of the week somewhat more bearish. A significant decline is therefore likely on either Thursday or Friday. The following week (Oct 17-21) looks more bullish as Jupiter approaches its aspect with Pluto. This could result in a significant gain. Since it will likely follow a major decline, it may only back test previous support. For example, if we see a preceding decline to 4500, then this aspect only propel a rally back to 4700-4750 which was a previous support level. The last week of October looks quite negative again, however, so that bullish Jupiter influence may be overwhelmed. Mars and Saturn move into aspect with Mercury and Venus at this time, and this multi-planet alignment could produce a sudden decline. A retest of recent lows is therefore possible. I would also not rule out lower lows at this time. Another rally attempt is likely in the first half of November on the Mars-Jupiter-Pluto alignment. While this looks positive, it may not be able to lift prices very far. I would therefore not expect too much of a rebound rally in November — perhaps 10-15%. Weakness may return in December and January as Saturn forms an aspect with Neptune. This is likely to further depress prices and a lower low is quite possible. Nifty 4000 is therefore looking quite likely by January and I would not rule out a gap fill of 3600 either by that time. The best chance for a durable medium term rally will probably not arrive until the second half of January or February.
5-day outlook — bearish NIFTY 4700-4900
30-day outlook — bearish NIFTY 4000-4500
90-day outlook — bearish NIFTY 3600-4000
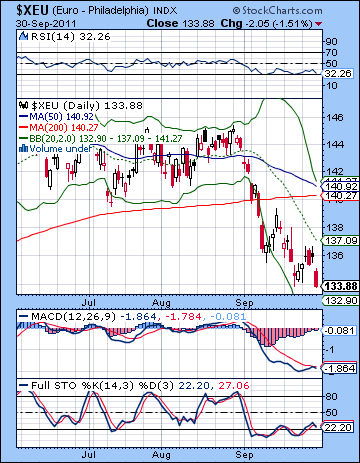 After gamely rallying into midweek, the Euro tumbled once again on Friday as skepticism grew over the sustainability of the European banking sector. The Euro closed down less than 1% below 1.34 while the Dollar Index held steady at 78.5 and the Rupee strengthened to just under 49. This bearish result was mostly in keeping with expectations as I thought the Venus-Saturn conjunction would likely tilt the Euro lower in the second half of the week. Also the early week was bullish as expected as the Sun-Uranus aspect on the Euro’s ascendant boosted the Euro to back close to 1.37. The failure of this rally attempt to even touch the plunging 20 DMA was telling of the Euro’s current weakness. Friday’s close matched the recent low, although it should be seen as a more bearish development since the previous low had been intraday only. The technicals look pretty weak at the moment as Stochastics show another bearish crossover, even at this already depressed level. MACD was showing some signs of a bullish crossover, but that may be on hold for now. RSI is again heading down although it is close to being oversold here. A new low here would likely hasten a move to 1.29-1.30 in very short order. The upside seems very tough, however as we can see a series of lower highs ever since the break of support at 1.40. The chart is pointing to lower levels in the near term. This week’s Mercury-Saturn conjunction is likely to push the Euro lower. Some early week gains looks quite doable, however, as the entry of Venus into Libra is likely to produce a brief moment of optimism. This may occur Monday or Tuesday — possibly both. But the planets look more negative after that as Saturn will again pound the natal Mars in the Euro horoscope, this time with the assistance of Mercury. Some recovery is possible on Friday as Venus forms a supportive aspect with Neptune. Even if there is a gain posted on Monday or Tuesday, the rest of the week definitely threatens to put in a new low here. If this occurs, Friday may be the back test day up to 1.34. Next week also looks problematic as the Sun conjoins Saturn. We could conceivably see 1.29 by this time. Although a rally is likely in the week of Oct 17-21, the end of the month looks very bearish as Mars forms a nasty square aspect to both Mercury and Venus. This is a powerful alignment of planets that can do significant damage. I would not rule out a lower low at this time. Some upside is possible in November, but the trend looks down here until December and perhaps until January. 1.20 is quite possible by that time, although 1.25 may be the more conservative target. If the Euro does only fall to 1.25, then this would create a huge IHS pattern which would suggest a significant rally in 2012. Although I can see some major upside in 2012, I am unsure if it will be a lasting rally.
Dollar
5-day outlook — bullish
30-day outlook — bullish
90-day outlook — bullish
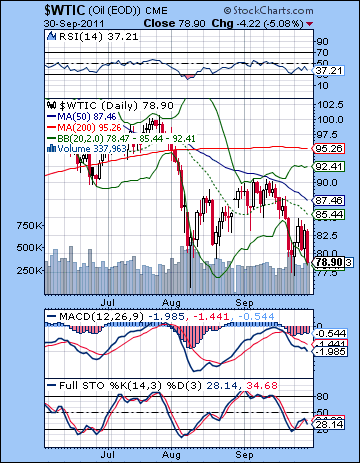 Crude slipped lower last week as a recession and subsequent loss of demand looked more likely. After an early week rally back to $85, crude settled 1% lower just below $79. This bearish outcome was largely in keeping with expectations as I thought the early week Sun-Uranus aspect would lift prices. The reversal lower also arrived on schedule as Wednesday’s decline occurred just as Mars formed an aspect with the Sun and Mercury. The late week also eventually tilted negative as the Venus-Saturn conjunction took hold on Friday. It was a somewhat grim week from a technical perspective as Friday’s close was the lowest since October 2010. MACD is still in a bearish crossover while Stochastics are also showing a bearish crossover, even if it is so close to the oversold line. RSI (37) is moving lower but has some distance to go before becoming oversold. Given the current state of the market, that is practically an invitation to a sell-off. The rally attempt failed to recapture the 20 DMA — a sign of a very bearish market. Now both the 20 and 50 DMA are sloping lower. The 200 DMA has also begun to point downward. While it is possible the lower Bollinger band may offer some support, the absence of any other support makes crude vulnerable to further declines. It may continue to follow its current downward channel and touch the $70-72 area.
This week offers some hope to bulls as the early week strength of Venus could boost prices on Monday or Tuesday. A quick rally back towards $83-85 is therefore possible and would still be keeping with the bearish intermediate term outlook. The midweek Mercury-Saturn conjunction may be less kind, however, so most if not all of those gains may be lost. Friday again could be positive, especially in the afternoon as the Moon approaches a conjunction with Neptune. The mixture of influences this week makes the overall outcome harder to call. The strength of the Mercury-Saturn aspect seems more likely to overpower all the other aspects so I would default towards a bearish outcome. At the same time, I would not at all be surprised to see a positive outcome for the week either. The size of Friday’s potential rally may cast the deciding vote in that regard. Next week looks quite bearish as the Sun conjoins Saturn and Mars is in aspect with Rahu. This will likely produce lower lows, perhaps below $75. A rally is likely between Oct 17-21 but the end of the month looks negative again. Early November could see some recovery but weakness will return by December and it could last into January. Overall, Q4 looks mostly bearish.
5-day outlook — bearish-neutral
30-day outlook — bearish
90-day outlook — bearish
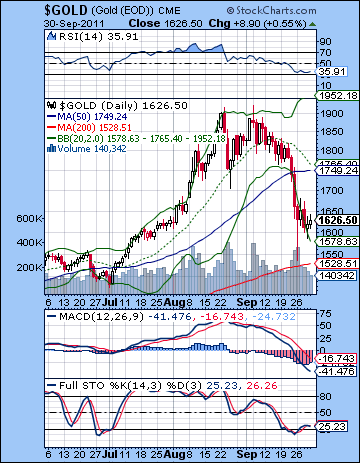 Gold continued to lose steam last week as the growing recession fears did little for the safe haven asset against inflation. Gold closed down 2% at $1636. While I had been bearish last week, my forecast was wide of the mark. I had expected more early week upside on the Sun-Uranus aspect but the resulting rally fell short of the $1700 target. I had also expected more late week selling but gold held firm on Thursday and Friday and even saw a modest rise. Is gold consolidating before another rally attempt? It’s possible. While MACD is still in a nasty looking bearish crossover, the histograms are starting to shrink. RSI is leveling off here just above the oversold line. This could be interpreted either way however — as a pause before the final plunge or a slow bottoming process before heading higher. Stochastics have recently climbed out of the oversold area, but there is a bearish crossover in the works here. Monday’s scary intraday low of $1550 may well foreshadow the next interim low for gold, as this also matches some significant horizontal support dating back to May. Below that, the bottom of the 3-year rising channel offers support closer to $1250-1300. In the event of a relief rally, resistance would likely be near the 50 DMA at $1749. I would be surprised if a rally climbed all the way back to that level as I think sellers would come out in force above $1700.
This week offers some hope for gold as the strengthening of Venus in the early and late week periods could boost prices. Venus enters Libra on Tuesday so that should produce at least one up day. Monday may also tilt bullish although that looks more uncertain. The midweek Saturn influence is likely to be more bearish, however. It is hard to say if any declines on Wednesday or Thursday will be big enough to offset to preceding gains. I would be cautiously bullish here, but not at all surprised if it faltered. Friday looks more positive in any event as Venus aspects Neptune. So a run to $1700 is again in the cards here, and I would not rule out $1725. That said, the Sun is rapidly coming under the affliction of both Ketu and Saturn so that could undermine the upside potential of the other planets. Next week looks more decidedly bearish as the Sun gets a double dose of both Ketu and Saturn. This could send gold prices sharply lower — possibly to test support at $1550. An interim low is possible around the 14th or 17th. While some upside is likely between mid-October and mid-November, it does not look particularly strong. The rally could therefore be fragmented and quite weak. Saturn’s entry into Libra in mid-November looks quite bearish and could mark the beginning of the next major correction. At this point, it could well be a lower low. We should wait to confirm this forecast with technical factors in November and December.
5-day outlook — neutral-bullish
30-day outlook — bearish
90-day outlook — bearish

