- Venus turns retrograde on Friday; declines more likely in early and late week
- Dollar poised to rebound by late week; strength through much of October
- Crude oil declines possible early in the week, some recovery later
- Gold vulnerable to declines on Venus retrograde; October looks bearish
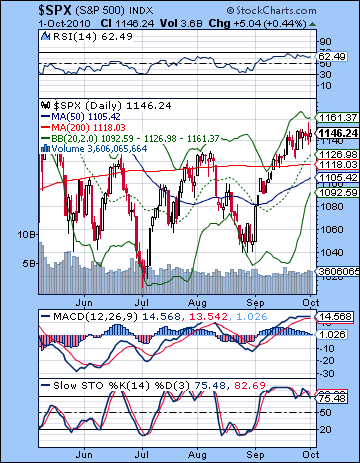 Stocks were mostly unchanged last week as Friday’s positive economic data from China precluded any significant selloff. The Dow edged lower by less than half a percent to close at 10,829 while the S&P500 closed at 1146. This rally is fast becoming the beast that refuses to die. While I had real expectations for a substantial late week pullback on the Sun-Saturn-Ketu alignment, it did not happen. Needless to say, it was a disappointing outcome. The planets have been increasingly unreliable indicators lately as we have not seen any correction in the wake of the Jupiter-Uranus conjunction on September 18, nor did the bearish Saturn-Ketu produce much downside at all last week. While it’s sobering to see my forecasts come up short of the mark, some failed predictions have to be expected in a probabilistic enterprise where indicators are not infallible. So now what? Does the failure of last week’s Saturn-Ketu aspect change my expectation for an October correction? No, although I would admit that I’m wondering to what extent any pullback may either: 1) be limited or 2) protracted into November. I have noted that aspects sometime release their energy only after they reach exactitude. It is possible that this still may be the case with the Saturn-Ketu square that came exact on Monday, September 27. While the market hasn’t declined since then, neither has it gone up. Also its exact aspect may actually have been triggered by Friday’s Sun-Saturn conjunction, thereby starting a new trend. This would broadly be in keeping with expectations, especially concerning slow moving aspects such as these that may take a few days to manifest. More troubling, however, is that Jupiter (3 Pisces) is still very close to Uranus (4 Pisces) and while this bullish combination is diminishing in strength, it is still keeping the bulls in the game as the market refuses to roll over. As long as these planets are close to each other, there is a plausible source for optimism and that could conceivably support prices longer than I had expected. Other medium term influences that deserve mention here is the Venus retrograde cycle that begins on October 8 before the start of trading and continues to November 18. The previous Venus retrograde cycle in March 2009 signaled an important change in the prevailing trend although the start of the cycle marked the bottom. In the present circumstance, where we are at the top of a rising trend, it is quite possible that the Venus retrograde cycle could be a part of the influences that begin a down trend. Along with the Saturn-Ketu aspect, this has been part of the reason for my belief in a fall correction. In addition, the Rahu-Pluto conjunction in mid-November appears to provide further bearish fuel. Overall, there is a greater likelihood for a significant correction in Q4 than, say, a very bullish scenario that calls for more upside that produces a new high for the year.
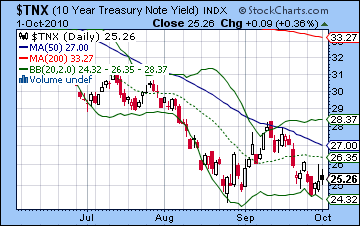
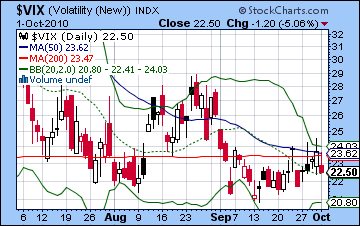
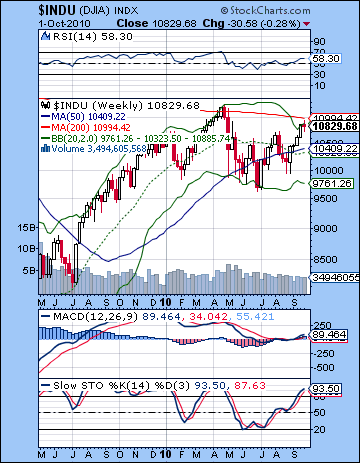 And as the planets still argue for a bearish outlook here in October and Q4, the technical picture increasingly supports the view that a pullback is at hand. Despite repeated attempts last week, the SPX did not close above 1150. This is significant because 1150 is major resistance that dates back to the January high that formed the right shoulder in a larger head and shoulders pattern. The inability for the bulls to take this level out suggests there is a lot of reluctance by new buyers to take on more risk at this juncture. Admittedly, the Dow has managed to close above its January high but it is a narrower slice of the market. A breakout higher should be confirmed by the broader averages and until this happens, the market may give false signals. Also unless the falling trendline from the 2007 high is violated on the upside, bulls will be fighting an uphill battle. The Dow sits very close to this trendline now, while the S&P still trades below it. Bears can take some solace from the fact that the SPX trades well above its 50 DMA. Typically, this line shows a kind of halfway point as rallies above will usually retreat back to the line or below with some frequency. Daily MACD is flat here and on the verge of rolling over. This is also a very bearish indicator. With MACD above the zero line and histograms still (barely) positive, this suggests that the next move is likely to be a correction rather than another significant move higher. RSI (62) has fallen from its recent high and is now in a negative divergence. Stochastics (75) are also looking vulnerable to correction here as it is now below the 80 line and it also in a bearish crossover. The weekly Dow chart shows an increasingly overbought situation in the Stochastics (93). While there is no bearish crossover yet, it may not be long in coming. Current prices are also at the top of the Bollinger band (10,885) which may suggest that further upside is limited and stocks are vulnerable to correction. Meanwhile the $VIX continued to stay close to its 200 DMA around the 22 level and could be poised for a move higher. Its ability to stay at or above its August low while stocks have climbed is a good indication of gradually rising fear in the market. This is another way that we can see that there will be some kind of correction in the weeks ahead. The ten-year bond yield ($TNX) continues to probe new lows here as Fed purchases guarantee there will be demand for treasuries. While this double bottom is potentially bearish, I don’t expect the bullish trend in bonds to change until November at the earliest. Overall, the technical picture inclines somewhat to the bearish view although it should be pointed out that neither does it preclude further upside in the short term. Certainly, a decisive push above 1150 would postpone the correction for at least another week or two and might also lessen the scale of any correction in October.
 This week has the makings of a bearish outcome as we will get our first look at the after effects of the Saturn-Ketu aspect and then of course, Venus turns retrograde on Friday. Actually, Monday’s session could be quite bearish as Mars will conjoin Venus on Sunday. There should be enough affliction left to favor the bears in Monday’s session. A decline of over 1% is a definite possibility here. Tuesday could see a rebound as the Sun aspects Venus while the Moon lends a helpful hand into the midday. Wednesday may also have a generally bullish flavor as the Sun is still in aspect with Venus while the Moon will resonate with the Jupiter-Uranus conjunction. There is a chance that we will see more buying in the morning, however, so I would not rule out a negative close on Wednesday. The end of the week looks more bearish again as the New Moon forms an aspect with truculent Mars and Mercury prepares to conjoin Saturn on Friday with the Venus retrograde. Friday could be quite a significant day. Naturally I would hope to see a major decline here. Still, if the Sun-Saturn conjunction produced a gain, then why would Friday’s Mercury-Saturn conjunction produce a different result? There are a couple of co-factors here that would suggest a worsening array of energies including the start of the Venus retrograde cycle and the closer proximity of Mars to Venus. Obviously, nothing is certain here, but there is an increased likelihood of a major decline as we move towards the end of the week, including some crash-like scenario. Overall, we should be down for the week.
 Next week (Oct 11-15) we will get a sense for how far this correction could go. Monday looks bearish on the Sun-Mars-Pluto pattern with some kind of midweek recovery possible. The end of the week tilts towards the bears, however, on the Mercury-Mars aspect. This looks like another down week. The following week (Oct 18-22) is likely to start with a strong bounce on the Sun-Mercury conjunction. Some midweek declines are perhaps more likely but buying may return towards week’s end. After that, the planets look more bullish going into the first week of November. I think the snap-back rally should be significant but it may be quite short-lived, perhaps just a week or two. I would expect more downside to manifest in November. I had previously wondered if the November low would be lower than anything we see in October. I would say that a lower November low is looking more likely, especially if October’s low is still above 1070. I can see a sharp decline around December 8 so that could conceivably mark an interim low. This will probably be below 1000 on the SPX. After mid-December there is a good chance for a rally into early January on the Jupiter-Uranus conjunction. Q1 2011 is looking mixed in January and February, but another major decline looks likely for March. It should take the market to lower lows.
5-day outlook — bearish SPX 1100-1140
30-day outlook — bearish SPX 1080-1130
90-day outlook — bearish-neutral SPX 1050-1150
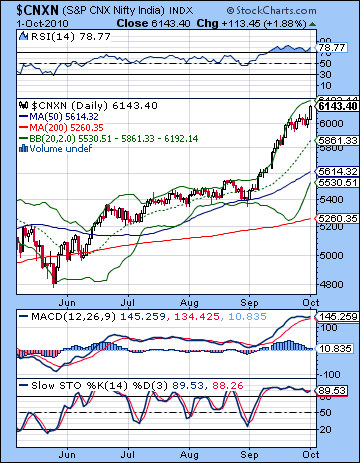 Equities extended their rally for another week as liquidity from foreign investors continued to flow. The Sensex gained 2% to close at 20,445 with the Nifty finishing at 6143. It was a worse case scenario for my bearish view as prices continued to march upwards despite the Saturn-Ketu aspect which was exact on Monday and was apparently "triggered" on Friday by the Sun’s conjunction. While I noted the unpleasant possibility that we could see higher prices through the week with a reversal or peak on Friday, I expected more downside to manifest. As if to add insult to injury, Friday turned out to be the most positive day of the week as prices were largely flat before then. While disappointing, it is important to note that the bullish outcome here still affords an outlet for Saturn’s energy next week. As I have mentioned previously, some aspects release their energy, for good or ill, after there exact geometric angle. This may be the case here with Saturn and Ketu, especially in light of the fact that both are slow moving. The Sun’s conjunction on Friday could have signified a culmination of the lead-in to the Saturn aspect which may now manifest in a down trend. That said, I would note that bullish Jupiter (3 Pisces) is still in a close conjunction with helpful Uranus (4 Pisces) and while separating now, they remain a source of bullish energy. My mistake was in overestimating the role of Saturn to take prices lower. Astrological interpretation is a probabilistic enterprise at the best of times, although lately is has fallen short of even that lower standard. The best way forward is to blend the astrological probabilities with technical and fundamental analysis in order to arrive at a more comprehensive picture. Clearly, the fundamental picture is largely positive as the domestic economy is robust, although with significant amount of inflation. The technical outlook is also quite bullish as I have previously noted. When there is a divergence between astrological and technical indicators, one has to be extra careful in forecasting. I have mistakenly overweighted the astrological signals here, although I would note that the deteriorating technical situation offers more evidence for an overall bearish outlook. So what now? I still think we will see some kind of pullback in October and there is a chance it will be significant. However, I am inclined to believe that more of the decline may not take place until November with Rahu conjoins Pluto. While there is still some bearish fuel left in the Saturn-Ketu aspect for October, it may only have two weeks of negative market direction. Unless we get some massive crash quickly — which seems quite unlikely for India — we may have to wait until late November for a deeper more meaningful correction to take place. Nonetheless, I am still firm in my expectation for a bearish Q4 and a bearish Q1 2011.
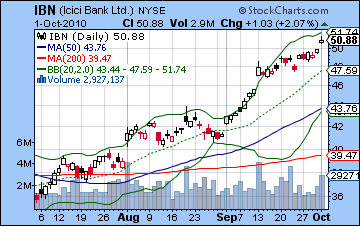
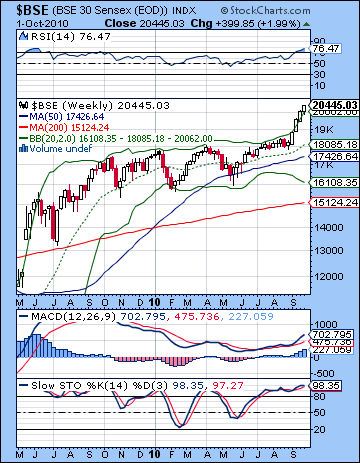 While this relentless push higher is good news for the bulls, the market seems ripe for a correction. The longer it goes up without correcting actually increases the chance of a severe downdraft. We’re fast approaching that situation now as the Sensex is almost in a parabolic run-up at this point. Numerous technical indicators are overbought. Stochastics (89) have been overbought for three weeks now and what’s more important is that their levels are slowly eroding thus showing a negative divergence with price. This is an unsustainable condition that must resolve with a fall in prices. Daily MACD is flat and is also showing a negative divergence. Histograms are shrinking although still over the zero line while MACD is well above zero. This is definitely not a chart that encourages the taking of any new long positions and indeed it leans strongly towards the bears. Of course, technical indicators can show apparently bearish signals for a while before prices ultimately catch up. Time is on the side of the bears, however. RSI (78) is still hugely overbought and is in a negative divergence with respect to its peak two weeks ago. Friday’s close was very near the upper Bollinger band. The more probable direction here therefore is down. The middle Bollinger band is the usual first-stop in any correction but with the widening of the bands through September, it is possible that the middle band (20 DMA) may not offer that much support. The 50 DMA (5600) is another level that could attract buyers as this represents a kind of reasonable estimation of value. When prices go far above the 50 DMA as they are now, corrections usually will return prices back to that line or below. But with all three moving averages still rising here, it’s a strongly trending market that will likely have many investors waiting to buy the dips. This is one important reason why any pullback we get in October may not break below 5600-5700. This is the approximate level of the top of the rising channel dating back to 2009. This was previously resistance and now will offer significant support in the event of a correction. Certainly a violation below this line would be a very significant development and would reveal an unusual amount of weakness. While October looks generally weak, it seems too tall an order for the bears to break below this 5700 level here. It may have to wait until November. The BSE weekly chart is also running up against the top Bollinger band here suggesting a pullback may be in the offing. The last time this occurred was May and June 2009 as the sharp rise was followed by a steep 15% correction into July. ICICI Bank (IBN) showed further strength last week, however, Friday’s gain came on a so-called "island reversal" candlestick which can be a bearish signal if confirmed with lower prices in subsequent sessions.
 This week will be another opportunity for seeing the after effects of Saturn’s aspect with Ketu. These two planets are both malefics therefore there will likely be some boost in negative energy that could undermine the perennial influence of Jupiter. Another potentially negative pattern this week is the conjunction of Venus and Mars. This conjunction is exact on Monday and therefore may weaken sentiment in the first day of the week. Due to the slow velocity of Venus, the close influence of Mars will last through much of the week. Between Mars and Saturn, the astrological influences appear to favour the bears this week. The midweek period looks somewhat more positive, however, as the Sun will aspect Venus. This is more likely to manifest Tuesday afternoon or into Wednesday. The late week period looks more negative again as Venus turns retrograde on Friday just as Mercury conjoins Saturn. The Venus retrograde cycle (8 October – 18 November) is an influence that can mark a shift in the prevailing trends. The previous Venus retrograde cycle occurred in early March 2009 and marked the bottom of a correction and the start of the huge rebound rally. It is therefore quite possible that this cycle could mark the end of this summer rally. Astrologically then, the week looks negative, with sizable declines possible.
Next week (Oct 11-15) also looks bearish with a Sun-Mars aspect early in the week. Some midweek bounce is possible but the late week also seems more negative on the Mercury-Mars aspect. The following week (Oct 18-22) is likely to be begin very positively as the Sun and Mercury conjoin while in aspect with Jupiter. The rest of the week looks more mixed, however, so I would not rule out a lower low here. Some improvement in sentiment is more likely at the end of October and into early November. Another significant move down may begin in the first week of November, probably near the Mars-Ketu aspect on the 3rd. Interestingly, this aspect comes the day after the US midterm elections. Mid-November looks particularly bearish as Rahu conjoins Pluto and both Mercury and Mars will come under the aspect of Saturn. This is likely to mark another significant move lower that could extend into late November or perhaps even early December. At this point, I expect this low to be lower than anything we see in October. Stocks are likely to rise after mid-December and into early January on the next and final Jupiter-Uranus conjunction in the current series. At this point, Q1 2011 looks mostly bearish, although the bulk of it may not manifest until March. 2011 as a whole also seems bearish for Indian markets, with the May-July period looking especially negative.
5-day outlook — bearish NIFTY 6000-6100
30-day outlook — bearish NIFTY 5500-5800
90-day outlook — bearish NIFTY 5300-5800
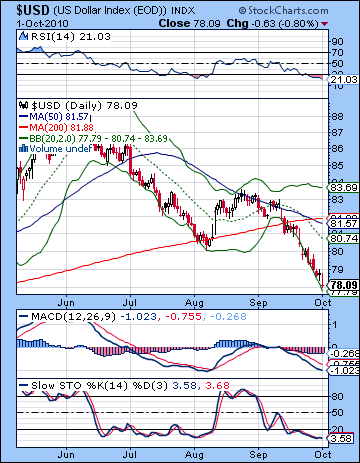 The Dollar continued its downward spiral last week investors grappled with its gloomy long term prospects. The USDX barely finished above 78 as the Euro surged over 1.37. The Rupee similarly soared to 44.3 as portfolios reduced their exposure to the currency used by the profligate US government. The Dollar has fallen on tough times here and has entered a dangerous pattern of making new lows below its 200 DMA. I had been cautiously optimistic last week although I allowed for the possibility of further downside. Alas, the Dollar bears carried the week yet again. The technical indicators are (still) very oversold here on both daily and weekly charts. Daily MACD is still in a strong bearish crossover although it remains in a positive divergence with respect to the previous August low. Stochastics (3) are extremely oversold and roughly parallel the levels they reached in August. This week’s action saw a "death cross" of the 50 and 200 DMA, a very bearish signal for the intermediate outlook. While the 200 DMA is still rising, both the 20 and 50 DMA are falling. Price is coming into an area of support from this falling channel off the June high, so a bounce around 77-78 is somewhat more likely. I don’t expect the 74 support level to be tested here, although it is possible in December.
This week has a better chance of a gain for the Dollar as the start of the Venus retrograde cycle late in the week may shift the financial terrain. I’m less certain about the early week however as the Venus-Mars conjunction occurs over a somewhat unreliable spot in the USDX chart. But October should be significantly better than September (how can it be any worse?) and I am still expecting some kind of rally to occur through mid-October. A possible top may happen around October 27 but this is unlikely to rise much further than the 200 DMA (81-82). This may roughly correspond to 1.28-1.30 on the EUR/USD. November and early December look more astrologically bearish although we will have to revisit this question from a technical point of view once we’ve had the rebound rally. Late December is likely to be bullish as is most of January. I would not rule out another run above this 81-82 level at that time. 2011 looks generally bearish for the Dollar although there looks like a strong rally in November and December. The Dollar may stage a significant comeback in the second half of 2012 and into 2013.
Dollar
5-day outlook — neutral-bullish
30-day outlook — bullish
90-day outlook — neutral
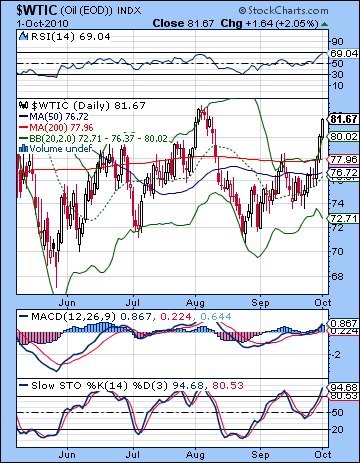 As the Dollar sank further, crude oil made strong gains to close above $81 for the first time since early August. While I had leaned towards a bearish outcome on the Saturn-Ketu aspect, I did have some reservations about the downside potential given the relative absence of clear astro signals in the Futures chart. The technicals improved somewhat as prices moved above the 50 and 200 DMA around $77-78. This was definitely a bullish development although price has moved up to a resistance level that coincides with the August high. Also, we can see that price has moved above the top Bollinger band. This may indicate that some consolidation is in order here or alternatively a breakout higher is in the offing. Given the RSI (69) is pushing up against the 70 line, crude looks more susceptible to pullbacks here. Stochastics (94) is also looking overbought although it has not yet crossed over so there is a possibility of further upside. Despite the gains, MACD is still showing a significant negative divergence with respect to the August high and this adds some evidence to the notion that the current rally may not have the legs to go much higher. I would expect sellers to come out of the woodwork around $82, although we cannot rule out a quick run to the April high of $86. While the technical picture for crude looks to be in a holding pattern, bulls can take comfort in the fact that price has broken out above the summer triangle pattern and this may well entail further upside. Overall, there is a definitely possibility for significant short term gains on this break out but the medium term indications seem to argue against a sustainable rally.
This week’s astrology again tilts towards the bears as Saturn (14 Virgo) moves into opposition against the natal Sun in the Futures chart (15 Pisces). As noted previously, this is a general bearish indication that suggests a correction is likely in October. The Venus-Mars conjunction on Monday is another negative influence that may spark a selloff of some significance. The midweek Sun-Venus aspect will likely coincide with a rebound, however, so it is unclear how much lower we could move overall this week. The late week is perhaps the most critical time as the Venus retrograde cycle begins on Friday, just as Mercury conjoins Saturn. While the Mercury-Saturn combination is usually bearish, it is somewhat less likely it could coincide with a decline here due to its aspect with the natal Sun. Last Friday’s Sun-Saturn conjunction was a clue that similar combinations may be bullish in the short term and therefore we cannot rule out the possibility for an end of the week rally. Prices look generally weaker going into next week, however, and a general down trend is likely to continue into late October, perhaps as late as the 25th.
5-day outlook — bearish-neutral
30-day outlook — bearish
90-day outlook — bearish-neutral
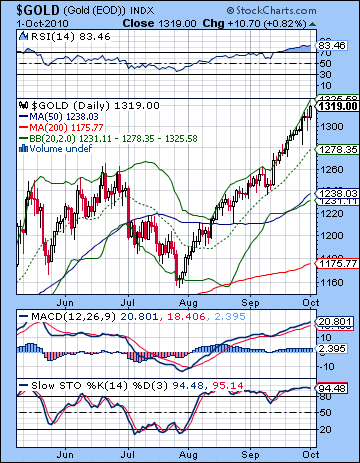 Dollar woes continued to provide a lift for gold as the rally continued unabated for another week. Futures closed Friday at $1319 up about 1.5% for the week. While gold and other commodities have benefited from the Dollar selloff, it’s also worth nothing that the gains have not included any additional speculation. Gold’s rise closely mirrors the Dollar decline. This may temper some of the optimism of gold bulls who see the current rally as the inevitable wave of the future. As soon as the Dollar finds its footing, gold will fall. In any event, the gain put the boots to my expectations that we could see a reversal on the Sun-Saturn conjunction. Saturn is normally a bearish influence but it did pan out here. It may well be that the start of the Venus retrograde cycle on October 8 will create the condition for a convincing reversal in the direction of gold. The technical picture remains steadfastly bullish as the moving averages are rising as price continues to hug the upper Bollinger band line. RSI (83) is reaching stratospheric levels however so one might well wonder how far this rally can go before a nasty correction and consolidation phase takes root. The fact that the current peak in the RSI is higher than the May peak is bullish as it suggests that the up trend is for real in the medium term. MACD is less positive, however, and remains in a negative divergence with the May high. The weekly chart reveals similarly overbought features along with negative divergences in most indicators. This increases the chances for a correction in the short and medium term, although it does not necessarily point to a major breakdown. Price is coming up to resistance at $1340-1350 from the rising wedge that dates back to 2008. Support from this wedge is about $1230, which also roughly coincides with the middle Bollinger band on the weekly chart and 20 WMA. A decline below this level could produce a larger wave of selling so it merits further attention. As long as gold stays above $1230, then the rally will continue into the medium term.
This week’s Mars-Venus conjunction offers another plausibly negative influence on gold. Venus is the planet of spending and luxury, and its combination with Mars here will increase selling pressure. The conjunction is exact on Monday so that could translate into a down day. Some rebound is likely into midweek on the Sun-Venus aspect, but the late week period may be more important for defining the October trend. Friday’s Mercury-Saturn conjunction and the simultaneous reversal in direction by Venus could coincide with either a top or a large down move. I would tend to favour a large down move as a more likely outcome. The Venus retrograde cycle will last from October 8 to November 18. While it is uncertain if this will coincide with a correction in gold, it is a bearish influence that could at least change the dynamic in the current rally. Instead of a slow, steady rise that has moved inversely with the Dollar, it increases the likelihood that this relationship may change in some way and increase volatility and price swings in both directions. Overall, I still expect a correction in October and November. December and January look quite bullish as Jupiter will again conjoin Uranus. February and March look bearish again and there is a reasonable chance that we will see lower lows in gold at some point in the first half of 2011.
5-day outlook — bearish
30-day outlook — bearish
90-day outlook — bearish

