- Early week gains likely in stocks followed by declines; Q4 looks bearish
- Dollar vulnerable to declines into Tuesday but recovery possible later; Dollar rally into October
- Crude oil gains early but losses more likely into late September
- Further gains in gold possible early this week; mixed picture afterwards
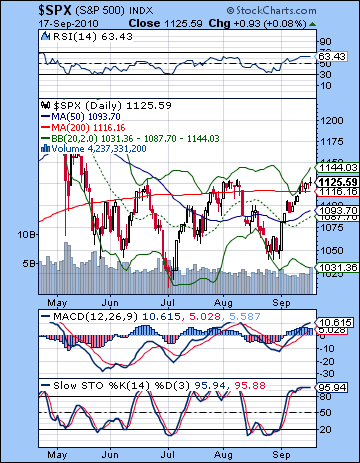 Stocks drifted higher again last week on positive economic data coming out of China and some encouraging earnings from the technology sector. The Dow gained more than 1% before closing at 10,606 while the S&P finished at 1125. Given my bearish view on the week, this rise was a little disconcerting although it wasn’t completely out of left field. I had been somewhat equivocal on the early week period in particular as I noted a potentially positive aspect between Mars and Jupiter at that time. Indeed, Monday saw the best gain of the week as this aspect tapped into the significant reservoir of bullish energy provided by the ongoing conjunction of Jupiter and Uranus. I had noted that we could see that key resistance level of 1130 on the S&P tested at some point in the week and we did get there intraday on Friday. My bigger error lay in the late week period as I had more bearishness on the Mercury-Venus-Saturn alignment. I thought the stronger Saturn focus might undermine the optimism but in the end the stronger Saturn influence only served to neutralize the bullishness of Jupiter and we ended mostly flat. All in all, it was another discouraging week for bears although bulls may well wonder if they will ever punch above that 1130 resistance level from the previous highs. In that sense, the market is still caught in this well-defined trading range between 1040 and 1130, albeit at the upper end. From a planetary perspective, we can see how this September rally is closely associated with the Jupiter-Uranus conjunction that becomes exact today — Saturday, September 18. I have noted that this would be a source of bullish influence in the markets that would likely prevent any significant correction from occurring and could well lift prices into mid-September. While I have been generally bearish, this up trend was definitely within the realm of possibility. What is important to note here is that this conjunction is now complete as Jupiter begins to move away from Uranus. As a rule, energies begin to unwind when planets begin to separate from each other. In this case, the gradual separation of Jupiter from Uranus will mark the the diminishing influence of Jupiter and hence, the erosion of optimism and bullish sentiment. At the same time, it is important to note that Jupiter will still be very close to Uranus — less than one degree apart until the end of September — and hence there should still be some residual positive influence on the markets. However, there is now the likelihood that bearish Saturn is growing in influence as it approaches its aspect with the Moon’s Nodes, Rahu and Ketu, that comes exact on September 27. So there is a good astrological rationale for believing that a change in the trend is at hand as Saturn gradually supplants Jupiter in the sky in the coming days. And yet there are many dimensions of the future contours of the market that remain unclear to me. Once we get past this nasty Saturn-Ketu aspect, will the market continue to fall through October despite a potentially positive influence from Venus on October 7? And after doing more research this week, I think there is a chance that we could still be in a bearish trend into November as Rahu conjoins Pluto. I have previously alluded to the possibility of another decline into mid-November, but was uncertain whether or not it would be lower than anything we might see in October. I’m starting to think that the market will be at a lower level in November than in October. But more on that later.
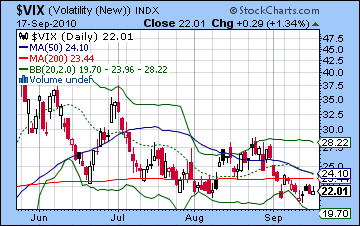
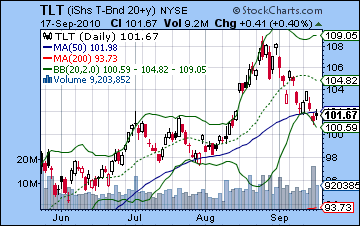
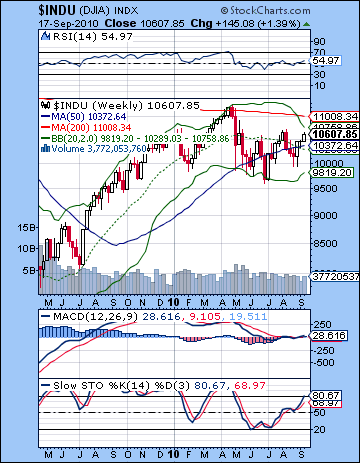 Technicals are quite mixed here as bulls have pushed prices up to a strong resistance level of 1130 on the S&P. While the bulls are in nominal control here, they must push prices above this level if there expect to retain control. Otherwise, the market will sell-off as the bears take the reins and attempt to challenge support back towards 1040. Bulls can point to a nice inverted head and shoulders pattern with the early July low as the head, and if 1130 should break, then many bulls will expect a run up towards 1250. All three moving averages are rising and MACD and RSI remain firmly in bullish territory. Some commentators have noted that more upside may be indicated since the RSI has yet to hit the overbought level at 70. This might be seen as the cautious bear approach: wait for the 70 level to be hit on the RSI and then look for a decline. This might translate into about 1150 on the S&P. I’m not sure how reliable such indicators are for marking turning points with such precision but it is certainly a view to keep in mind. Stochastics (95) are very overbought now and suggest a reversal lower in the near future. Given that prices are bumping up against the top Bollinger band, a pullback to at least the middle band (20 DMA) around 1090 would be a reasonably high probability. The weekly Dow chart shows that prices are fast approaching the top Bollinger band line. This is a sign of a possible top in the market, especially since we see a significant narrowing in the bands. More interesting is that Stochastics (80) are now in the overbought area and increases the possibility of a pullback or full blown correction. Admittedly, previous corrections occurred only with the Stochastics at a higher level around 90, but it’s noteworthy nonetheless. Meanwhile, bonds continue to struggle here as TLT lost ground on the week and, like stocks, sits perilously perched at a support level on the April trendline. A break below 101 would be quite dangerous for bonds and this could accelerate a move back into equities. It seems unlikely that the Fed would welcome such a situation, especially in light of growing Dollar weakness. Another possible clue that a correction is just around the corner is that the $VIX may be forming a bottom. This week it closed off its lows at 22 just a little below its 200 DMA. Stochastics on this chart are also very oversold so there is some reason to expect a reversal higher. From a technical perspective, a move above 1130 would force a lot of short covering and we could get to 1150 quite quickly. While it would embolden bulls, it needn’t spell doom for the overall bearish view of the market for Q4. The longer term technical influence is still the head and shoulders that dates back to the January high of 1150 (LS) and the April top of 1220 (head). In a sense, a rise back to that 1150 would complete that bearish pattern and would still allow for a decline to proceed apace. So a rise above 1130 would then pit the more recent bullish IHS against the longer term bearish HS. Since I’m still a bear for Q4 I think the bearish view will be borne out, but it is important to note how contentious this 1130 to 1150 area might be. While a close above 1130 would be seriously weaken the bearish case, it’s only a rise above 1150 that would drive a stake through its heart.
 This week looks quite eventful as we will have our first glimpse of the market in the wake of the Jupiter-Uranus conjunction. Now that it’s separating, can the bulls retain control and if so, for how long? We get a critical test on Monday and Tuesday as the Sun will move into aspect with Jupiter and Uranus. On the face of it, this is a very bullish influence although now that Jupiter is weakening, it is not inconceivable that this combination will fail to rally the markets. Another potential source of weakness is the aspect between Venus and Ketu that is exact on Tuesday. What makes this situation particularly interesting is that Ben Bernanke will update his view of the US economy on Tuesday. If he outlines some concrete stimulus plans that the market likes, it could send stocks sharply higher. If he does not provide any new measures, then there is a chance the market could sell-off. And don’t forget that since last week was options expiration, the following week tends to have a bearish bias. So it’s sort of a make-or-break situation this week, with a new direction possible. Actually, I could see a mixed week here with gains prevailing up to Bernanke’s speech followed by profit taking as the week goes on. That would be my more conservative bearish position. The late week period appears to tilt towards the bears as Mars moves into aspect with Saturn by Friday’s close. Thursday may well be more negative, however, as the Moon will complete a larger alignment with Saturn and the Moon’s Nodes, Rahu and Ketu. In any event, Thursday and Friday look net negative, and the market could well sell-off in a big way. I don’t think a crash is not really in the cards this week, but there is the potential for some sizable downside once we get the Fed shenanigans out of the way. So a bullish view this week would see the Jupiter-Uranus operating more or less on full power with a powerful rise into Tuesday that could take the S&P to 1150. Wednesday might be the reversal day with stocks fading by Friday, perhaps ending near current levels — 1120-1130. A bearish scenario would see a decline Monday on bad housing data followed by a possible gain Tuesday on Bernanke’s appearance. Then it would be mostly downhill from there, perhaps starting as early as Tuesday afternoon. Tuesday’s Fed rally may only attempt to reclaim 1130 after Monday’s decline, but then we close around 1090-1100 by Friday. Some medium term astrological indicators make me think the bearish scenario is more likely, but the short term signals lean more bullish. So it’s something of a toss-up. I would gently lean more towards the bullish scenario, if for no other reason than respecting the strength of the current Jupiter-Uranus trend. That said, there is a reasonable chance that this could be an important interim top in the market.
 Next week (Sep 27-Oct 1) looks more solidly bearish owing to the lack of any clearly positive aspects. We finally will see the effects of the Saturn-Ketu aspect which is exact on Monday. This is a very bearish pairing that could introduce a measure of fear into the market that we have not seen since June. Aside from the aspect itself, there are no short term aspects to act as trigger so it’s possible some we could see some rebound. But the end of the week looks very bearish as the Sun conjoins Saturn. Thursday looks very dangerous as the Moon joins the alignment while Mercury also forms a minor aspect with Mars. On paper, Thursday September 30 looks very negative so there higher than normal chance of a crash then. That said, I am not expecting a crash, but a sizable decline of greater than 5% during this week is quite possible. If this sell-off comes to pass, it will be an unusual replay of what happened at the end of June as stocks sold off right at the end of Q2. Normally, end of quarter window dressing is thought of as bullish. It may be that fund managers attempt to lock in whatever gains they had in Q3 as the resulting selling pushes the market lower. The following week (Oct 4-8) also seems mostly negative as Mars conjoins Venus, Mercury conjoins Saturn and Venus turns retrograde. I am uncertain when we might break below that crucial 1040 support level, but this would be the last reasonable chance to do so. After this time, the market seems less negative. It may still fall into the following week, but the planetary patterns look somewhat less negative. Look for a big rise on the Sun-Mercury conjunction on either Friday, Oct 15 or Monday, Oct 18. After that, the market should rally into early November. Then another leg down is likely into mid-November as Mercury and Mars fall under Saturn’s aspect and Pluto conjoins Rahu. We could see a possible interim low near Nov 18. As I said above, there is a real chance this could be lower than anything we see in October. December is very much a mixed bag with both positive and negative influences evident. With January looking quite iffy at this point, I expect the market to make another significant interim low in February or March 2011. At this point, I think it could even be lower than any low we see in Q4. But that is still an open question that I hope to revisit in coming newsletters.
5-day outlook — bearish-neutral SPX 1090-1120
30-day outlook — bearish SPX 950-1000
90-day outlook — bearish SPX 900-1000
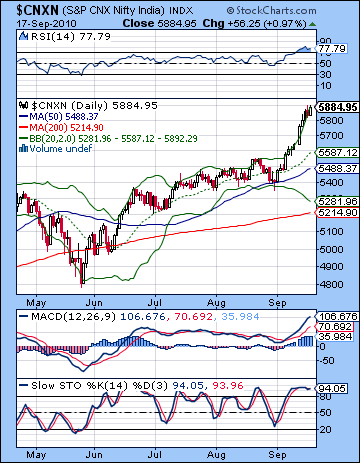 Stocks surged last week on heavy inflows from FII as India continued to outperform most other emerging economies. The Sensex rose over 4% to close at 19,594 while the Nifty finished the week at 5884. Despite last week’s bearish forecast, Jupiter continued to lift sentiment ahead of its conjunction with Uranus on 18 September. While I have noted the approach of this bullish pairing for several weeks, I did fully expect it to overshadow all other influences in the way that it has. At the same time, it’s worth pointing out that my bullish suspicions about the early week period were confirmed in spades as the Mars-Jupiter aspect did drive up the Nifty more than 100 points in Monday’s session alone. My error came on overestimating the bearish energy available for the rest of the week. Significantly, we did get a down day on Thursday, which is what I did expect given the Moon-Rahu conjunction and the various aspects to bearish Saturn. But as has been the case recently, the pullback was mild and bulls came back on Friday to take prices higher once again. Jupiter has been indefatigable in the face of all comers lately, as August failed to produce any significant correction in the face of numerous Saturn aspects while the extent of the early September rally has greatly exceeded my expectations. So when does this rally end and what kind of correction should we expect? Certainly, the technicals took a very bullish turn last week as we saw an upside breakout of the rising channel. This would suggest that corrections will tend to have limited downside as we are still very much in a medium term up trend. Astrologically, however, there is growing evidence to suggest that a turn lower may be in the offing. Just how much lower is more of an open question at this point, but lower nonetheless. Much of the rally has come from Jupiter’s bullish power through its conjunction with risk-loving Uranus. As of Saturday, 18 September, this conjunction is complete. After this date, Jupiter’s strength will tend to diminish although it will still have lingering bullish effects. My expectation, however, is that this bullish influence will gradually fade with the passing of time. At the same time, the planet of bearishness, Saturn, is poised to increase its power. That is because it will form an aspect with disruptive Ketu on 27 September. With Jupiter’s influence receding and Saturn’s increasing, the stars are increasing the likelihood of a significant correction as we go forward. This does not preclude some more short term upside but it does suggest that any upside will be limited. It also means that the downside risk exceeds the upside potential. The strength of the recent rally is so powerful, however, that our downside expectations may be tempered somewhat. The medium term uptrend may take more than one pullback to break it down decisively. While Q4 still looks bearish overall, I now believe the correction may require two phases to reverse the uptrend that dates from 2009. The negative Rahu-Pluto conjunction in November therefore may well mark the second down leg that creates the technical conditions necessary to convert the bull market (higher highs and higher lows) into a bear market (lower highs and lower lows). While the astrology looks bearish, the technicals still look bullish, so greater caution is required when there is a divergence. When technicals agree with astrological influences, then we can have greater confidence in expectations.
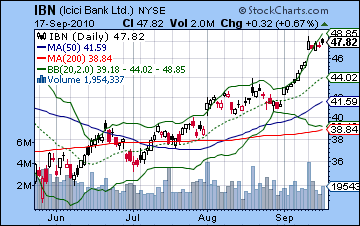
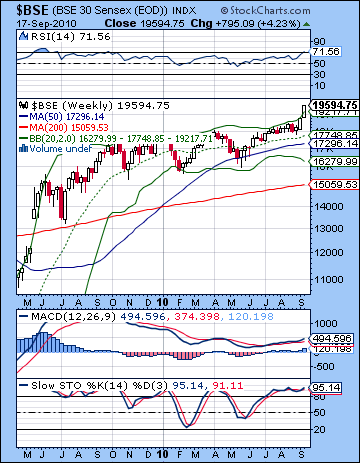 The bulls went to town last week as foreign money poured into the Indian market looking for growth opportunities. Much of this FII is dependent on high levels of liquidity. If the US Federal Reserve acts to choke off liquidity in order to protect the US Dollar, Indian markets will feel the pinch. I believe that such a move is quite possible in the near term and becomes more likely over the medium term as the Dollar will have to be defended in order to ensure a market for the burgeoning US government debt. From a technical perspective, however, the bulls have few worries as we saw a major new high that broke above the rising channel from 2009. This is a significant development that should be the focus of any potential pullbacks that may shake out weak bulls. In the event of a pullback, it will be critical for the breakout level of 5600 to hold. If prices should close below 5600 then it would increase the likelihood for a deeper correction and indicate a possible end to this rally. Prices have surged above the upper Bollinger band line here, a bullish indication. The main moving averages are all rising and we see that the middle Bollinger band (20 DMA) at 5587 is roughly equal to the 5600 breakout level. Certainly, the current sharply upward sloping channel is unsustainable so we should expect some kind of correction over the next few sessions. But if the Nifty stays above 5800 or so, then the rally can resume without difficulty and approach the 6000 level. In between 5600 and 5800 is more of a middle sized correction that would not seriously jeopardize the medium term rally but it may set the stage for further declines down the road. Momentum indicators look painfully overbought here as RSI stands at 77 while Stochastics (94) is well into the overbought zone. MACD is now at a level that has voided the negative divergence with respect to the previous high although the histograms appear to be topping out as the last three sessions did not show any increase. The weekly Sensex chart also looks overbought here as price has closed above the upper Bollinger band while RSI is now over 70. The last time the weekly RSI was over 70 was in May 2009 at the time of the post-budget euphoria. The possible difference this time is that MACD is in a negative divergence whereas back in 2009 it was not. Also MACD was rising sharply then, whereas now it is mostly flat, although we can note a slight upturn with last week’s gain. The chart of ICICI Bank (IBN) illustrates the current technical situation quite well. It broke to a new 2010 high last week at 47 on Monday’s gap up. Volume was strong thus increasing the chances that the rally will be sustainable. However, bulls will have to ensure that prices do not fall back below the breakout level of 45-46, or last week’s gain may begin to resemble a blow-off top. So while the gap at 46-47 may well be filled on any small pullback, it is more important that prices do not slip back below that level. If they do, it may well presume a more significant correction in the weeks ahead.
 This week looks bearish overall although we could see significant price moves in both directions. The early week period holds the potential for more upside as the Sun tests the strength of Jupiter as it aspects the Jupiter-Uranus conjunction on Monday and Tuesday. This is usually a bullish combination that has the potential to take prices higher by 1-2% and could mark an interim top to the market. In the current situation, some of that upside might be called into question because Jupiter may be weakening now that it’s past Uranus. Also I would note that there is a close aspect between Venus and Ketu around the same time and this is a bearish influence. So there are some contradictory astrological indications here that prevent me from making a clear call. I would not rule out either a major gain or decline in the early week period, although I would lean towards a positive outcome through Tuesday just out of caution and respect for the recent rally. But once the possibility of an early week gain is out of the way, the picture looks more bearish as Mars approaches Saturn towards the end of the week. Depending on how high we might go by Tuesday, the close Friday could actually be fairly close to current levels. But if the early week turns out to be bearish, then we are likely moving lower. A bullish scenario would see an overall gain through Tuesday that takes the Nifty towards 6000 followed by profit taking by Friday to close around somewhere around 5800-5900. A more bearish scenario would see a decline Monday on the Venus-Ketu aspect followed by a rise Tuesday and then a drift lower by Friday towards 5700-5800. I think the chances of a more bullish scenario are somewhat greater, especially if we get strength early on.
Next week (Sep 27-Oct 1) looks more clearly bearish as Saturn exactly aspects Ketu on Monday and then the Sun conjoins Saturn on Thursday, the 30th. Both of these combinations are negative and have the potential to take the market significantly lower. We could still see some up days here, especially on Tuesday or Wednesday as the Moon transits Taurus. Thursday and Friday look more bearish,however, as the Sun conjoins Saturn while Mercury enters Virgo. I would not be surprised to see a big move down here, most likely testing that uptrend support line of 5600. Whether we break below it at this point remains to be seen. The following week (Oct 4-8) also looks bearish as Mercury conjoins Saturn on Friday while Venus turns retrograde on Saturday. The end of the week looks more negative so in case there is a rebound in the early week, the late week period is likely to make lower lows. A reversal higher is likely sometime in mid-October, possibly around the Sun-Mercury conjunction on 18 October. This uptrend may last only a week or two (at the latest until early November) after which there will likely be another significant move lower. This November low is likely to be a lower than anything we see in October. We should see a powerful rally in late November and into early December as Jupiter turns direct while in aspect to both Mercury and Mars. December looks mixed although I note a potentially bearish pattern around the 10th-14th and then a return to the bullish pairing of Jupiter and Uranus in the second half of the month. Overall, there is a good chance that the lows in Q4 will challenge the lows of the year at 4800. Markets look unsettled going through the first half 2011 although we could see a significant low made in June or July. The second half of 2011 looks more bullish.
5-day outlook — bearish-neutral NIFTY 5800-5900
30-day outlook — bearish NIFTY 5400-5600
90-day outlook — bearish-neutral NIFTY 5500-5800
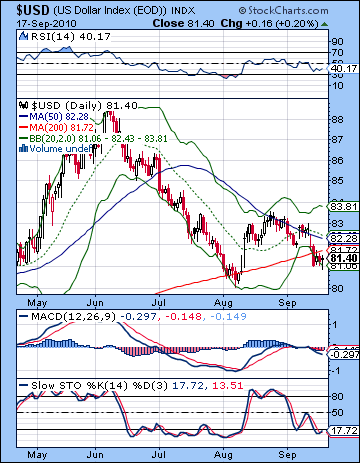 The Dollar lost more ground last week as investors took on more risk early in the week and reduced Dollar cash positions. After hitting a low of 81 on the USDX, the Dollar rebounded a bit by Friday to close at 81.4. The Euro pushed against resistance at 1.31 and finished at 1.30 while the Rupee was carried higher on a wave of euphoria to close at 45.8. This result was not unexpected as I had seen mixed influences last week with a clear bearish pallor over the early week period. The Dollar plunged Monday and Tuesday so that fit nicely against the Mars-Jupiter aspect. While the greenback is flirting with technical disaster here, it still sits just below its 200 DMA and above the lower Bollinger band line. Actually, Friday’s candle was an inverted hammer and that often accompanies a reversal higher. It still requires confirmation but it nonetheless increases the possibility that we’ve seen a key interim low. Stochastics (13) are again in oversold territory and suggest that buyers are more likely to push up prices in the near term. There is significant resistance at the 82-83 level where the 20 and 50 DMA congregate. A move above this level would hasten a push towards the upper Bollinger band near 84. While I remain bullish on the Dollar we have not quite got a double bottom here which may be a more favorable technical condition. Nonetheless, there is some evidence to suggest that the Dollar is ready to move higher in the near term.
This week promises to be very eventful in the currency markets. The Sun-Jupiter-Uranus alignment sets up very tightly on the USDX horoscope so that could affect sentiment significantly. While this pattern should be bullish for the Dollar due to contacts with the USDX horoscope, it suggests a situation which should be positive for stocks. Barring some unusual circumstance where the Dollar and stocks move in tandem, these two views are somewhat contradictory. So there is a certain amount of uncertainty here, although what is less uncertain is the size of the move which should be large. One balance, I favor more downside for the Dollar on Monday and Tuesday, perhaps even to the extent to forming that double bottom near 80. Nonetheless, we should see some recovery by midweek and continuing into next week. The Sun-Saturn conjunction on Sep 30 occurs in a very positive spot in the USDX horoscope, so I am inclined to think there will be a strong flight to safety around this time. This will correlate with a significant stock sell-off. The Dollar should continue to strengthen through most of October. There could be a possible top in the dollar in the second half of October, possibly around the 26th. After that, it looks increasingly vulnerable to declines. We could get another significant low in the first week of December. Another interim high is possible in the first week of January. The Dollar may weaken again after that through part of February before gaining ground in March. All of these moves are likely to have a close inverse correlation with the stock market.
Dollar
5-day outlook — bearish-neutral
30-day outlook — bullish
90-day outlook — neutral
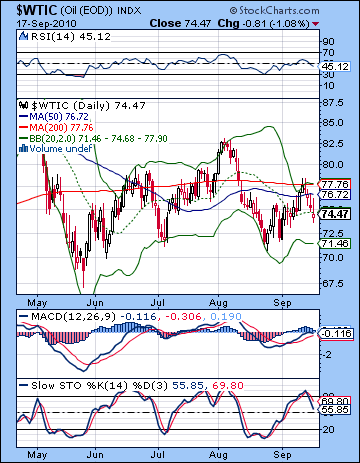 Crude oil slumped last week on oversupply concerns closing below $75 on the continuous contract. This was not a surprising result as I had not been optimistic in last week’s forecast. I thought we would see a rise on Monday’s Mars-Jupiter aspect and that came through on schedule as crude briefly traded above its 200 DMA at $78. Once that Jupiter influence had dissolved, however, prices moved lower on all trading days. This fit nicely with our expectation for a bearish end to the week as Saturn’s influence was highlighted through its aspects with Mercury and Venus. Crude oil has not kept pace with the equity markets lately and this may in fact be a signal of across the weakness that is to come as speculative positions begin to be unwound. The technicals look pretty bearish right now as crude could not even manage one close above its 200 DMA last week. The 200 DMA now sloping downward, and the 20 and 50 DMA are flat. RSI (45) is now in bearish territory while MACD appears to be rolling over and MACD histograms are also diminishing in size. Stochastics (55) have headed below the 80 line and may be on a one-way ticket to the oversold area below the 20 line. This suggests that there may be more downside in the near future. I thought prices might get high enough to $78-80 to form a level head and shoulders pattern with the June high as the LS. Last week’s high was fairly close but there is still a chance for $80 next week. A move down to the bottom Bollinger band below $72 should be seen as having a high probability, and this is where crude may find some support. More support may occur in the $68-70 range, however, and if we get a deeper pullback as I think we might, then that may be a battleground.
This week looks like we could see significant moves in both directions. The early week could well see gains as the Sun-Jupiter-Uranus pattern generally inclines towards bullishness. There is a higher likelihood of gains on Monday and Tuesday when this aspect is at its closest. At the same time, there are some negative influences in play here that could upset the apple cart. Venus is in aspect with Ketu on Monday and Tuesday, while Mars moves into aspect with Saturn at the end of the week. So while I expect some early week gains, it would not surprise me to see losses either. In either scenario, there is a greater likelihood for losses as the week progresses. Sentiment will turn increasingly bearish next week as the Sun conjoins Saturn in a very vulnerable place in the Futures chart. This is sort of a double whammy for crude that greatly increases the likelihood for declines in the coming weeks. We could see an end to this correction in mid-October, followed by a rebound but November looks fairly weak also so prices may then only move sideways at best until mid-November.
5-day outlook — neutral
30-day outlook — bearish
90-day outlook — bearish
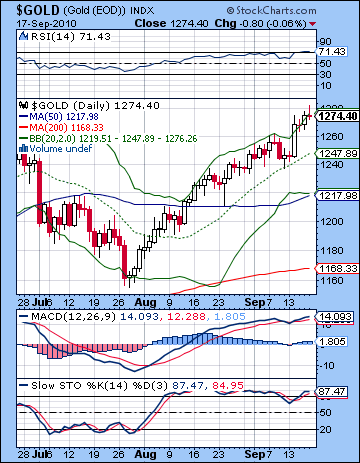 Gold continued its upward ascent last week as currency worries pushed prices to new all-time highs near $1280. While I expected we would see some gains last week, I thought they might be confined to the early week period. Certainly, Monday’s gain was the largest and this coincided closely with the Mars-Jupiter aspect. But prices generally rose throughout the week with Friday’s session ending flat after some intraday bullishness. The absence of any pullback on Friday was puzzling given the Sun’s entry into Virgo that day. I expected this would weaken the Sun, and hence, gold demand. I don’t think this nullifies my basic thesis that the Sun’s transit of Virgo will generally be bearish for gold, since there were plausible factors that kept prices higher, most obviously the ongoing Jupiter-Uranus aspect. Technicals look overstretched here as gold as RSI (71) is in overbought territory and Stochastics (87) are also well above the 80 line. Of course, in a strongly trending market, these indicators can remain overbought for an extended period, as we have seen through August. However, the RSI is hitting new highs so that increases the probability of some profit taking in the near term. A pullback to the middle Bollinger band at $1247 would be a purely technical correction and would not instill any anxiety in gold bulls. If prices fall below that level, then the 50 DMA at $1217 would be the next level of support. This would be a deeper correction, but still within the overall notion of a bull market in gold. A still deeper correction to the 200 DMA at $1170 is also not incompatible with a bullish view on gold, and I think the odds are good that we will see these levels in the coming weeks.
This week looks bullish in the early week as the Sun aspects the Jupiter-Uranus conjunction. Tuesday is perhaps more bullish than Monday but the pair of days generally look favorable. I would not rule out a big move higher perhaps near $1300. The rest of the week looks more bearish although if the early week rise is large, we could end up near current levels or even higher. Nonetheless, there are bearish influences gathering in the background here that could assert themselves very soon. The Sun’s transit of Virgo lasts until mid-October and will likely coincide with a correction in gold. Then Venus is retrograde from October 8 to November 19 and that may also be a source of weakness. These two influences, combined with two clear afflictions in the GLD ETF horoscope makes me fairly bearish about the price gold through Q4. While Jupiter’s close proximity to Uranus during this time may be enough to prevent a large scale correction, there are enough negative influences to make significant upside a fairly unlikely prospect.
5-day outlook — neutral-bullish
30-day outlook — bearish
90-day outlook — bearish-neutral

