Summary for week of September 26 – 30
Summary for week of September 26 – 30
- Stocks to stay under pressure, especially in second half of the week
- Euro may rally early but prone to more downside later
- Crude may recover briefly but more selling looks likely by Thursday
- Gold may bounce early but more declines likely after Tuesday; $1550 possible in October
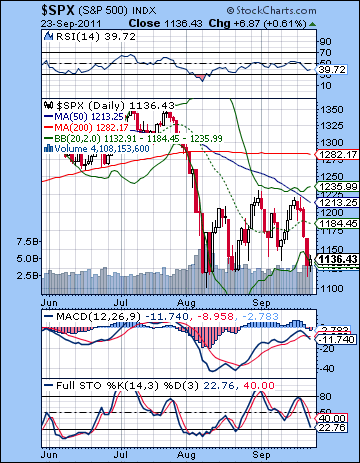 Wall Street’s game of musical chairs came to a crashing halt last week as the Fed did not come through with the additional liquidity that many bulls were hoping for. The reaction to Wednesday’s FOMC announcement of Operation Twist was swift and decisive as the Dow was down more than 6% on the week closing at 10,771 while the S&P500 finished at 1136. This bearish outcome was very much in keeping with expectations although if anything I underestimated the force of the late week down draft. Of course, the Saturn-Ketu aspect was exact in the late week period so that offered a generally bearish tone to the proceedings but it was likely the Mars-Uranus aspect that acted as a trigger for the huge sell-off. I wish I had been more categorical in my forecast last week. As expected, Monday was negative on the Mercury-Saturn-Ketu alignment and Tuesday saw some intraday relief but the gains did not hold. This was perhaps a warning of what was to come. I thought we would see more upside midweek but the Saturn-Ketu influence was simply too strong.
Bernanke’s reluctance to further damage the Fed’s balance sheet was a clear reflection of Saturn’s overarching influence here. Saturn’s preference for austerity and constraint carried the day as the Fed only had enough stomach to announce the somewhat cautious Operation Twist in which short term bonds are exchanged for long term notes as a means of keeping long term rates low. A strong Saturn and fairly weak Jupiter was a bad combination for all those bullish investors who have become overly reliant — or do I mean addicted? — to all that free stimulus money in the form of QE1 and QE2. Without a fresh hit of QE3 largesse from Bernanke, the bulls collectively threw in the towel on this bear flag rally attempt and we hastily revisited the lows of August 8. We seem to have entered a new version of 2008 as another round of asset de-leveraging is in progress. Everything except the Dollar and US treasuries is being sold off as the combined effects of the European debt contagion and a probable second recession in the US is making the outlook quite bleak indeed. With a second slowdown looking more likely, those inflation hedges all of sudden look less attractive as gold, oil and most other commodities quickly plunged. Arguably, the Fed and its stimulus programs was the source of much of the inflation over the past two years, so without QE3 coming down the pipe anytime soon, the inflation outlook looks far less ominous. Given that bond yields have now tumbled to historic lows, the worry now is deflation as all those bad debts are weighing down on economic activity. How very Saturnian it all is. The Saturn-Ketu aspect has corresponded quite closely with this major shift in sentiment and policy. As it begins to separate, we need to be mindful of possible attempts at market recovery. I am expecting there will be a significant reservoir of Saturn energy left over in the coming days weeks to take the market lower.
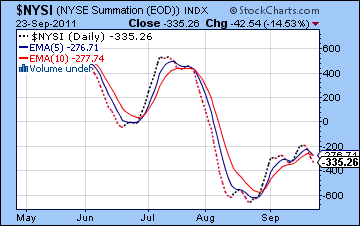 From a technical perspective, it was a huge win for the bears last week. The key support level of 1140 was taken out by Thursday’s rout as we retested the August 8 low. I had mentioned some significant resistance at 1220 and 1230 near the 50 DMA and that was pretty much as far as the SPX got on Tuesday. Now that the support of 1140 is gone, the bear flag is now over and done with. It did not reach 1260 but instead formed an even more bearish head and shoulders pattern (1215-1230-1220) which precipitated last week’s waterfall. But since the low of 1102 is still holding here, could the bulls somehow pull off a stunning recovery? It seems very unlikely given the intensity of the downdraft and the indicators. MACD on the daily chart now shows a bearish crossover. This had been in a bullish crossover for the past few weeks but now that sell signal is flashing quite brightly and indicates that more downside is likely to come. The NYSE Summation Index now has a bearish crossover of the moving averages. Again, this had been bullish since late August but it now showing a clear sell signal as the index has moved below both the 5 and 10 EMA. The medium term outlook has been bearish for several weeks but now the short term outlook is also bearish. The moving averages are all pointing down and the 20 is below the 50 which is below the 200. Not good.
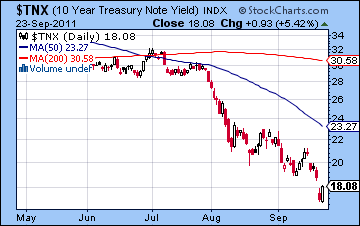
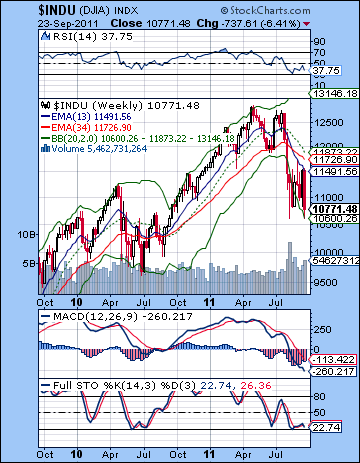 On the bulls’ side, the SPX did close the week near the bottom Bollinger band so perhaps it may attempt some kind of rally this week. Perhaps it will rally to close the gap at 1160 or go for the 20 DMA at 1184. This latter number also coincides fairly closely with the falling trendline from the July high. Alternatively, the rally attempt may be so anemic that it fails to cross back above 1140 in a back test of the bear flag support line. It tried and failed to do this in Friday’s session. While the NASDAQ continues to fare better than the other indexes, the small cap Russell 2000 actually broke below its August 8 low. This is a sign of broader weakness. The Dow actually matched its August 8 low on Thursday and may be attempting to rally off a bullish double bottom pattern. The weekly Dow chart shows a bearish picture as the 13 and 34 week EMA are in a deepening crossover. On the plus side, Thursday’s low appears to have found support from the bottom Bollinger band. In this new deflationary environment, treasuries are the asset of choice as the 10-year yield plunged to 1.75%. Fears of a slowdown are the driving force here, although one wonders at what point the yield will find equilibrium and stop falling. 1.4% is a possible long term target for the 10-year, although I suspect it won’t get down that low before it reverses. Friday’s candlestick was a bullish engulfing after Thursday’s gap down, so there is the greater likelihood of a retracement higher this week. That suggests that a rally in stocks is more likely in the short term. Shorting treasuries is very tempting here and with good reason.
The planets this week suggest the possibility of some early week gains with negativity to return for the second half. Monday’s Sun-Mercury-Uranus alignment tends to be positive for stocks as it boosts risk taking behaviour. Pinning down just when this alignment will manifest is tricky because Mercury is approaching its conjunction with the Sun on Tuesday and Wednesday. The New Moon occurs on Tuesday just as Mercury sidles up to the Sun, so that is a plausible candidate for the high of the week. So there is a reasonable chance for at least one up day on Monday, with a possibility of a second day’s gain on Tuesday. I would note, however, that both Sun and Mercury are forming an aspect with Mars for midweek so this could seriously upset the apple cart. Monday has the best chance at a gain. One possible scenario might be a rise on Tuesday’s open just a couple of hours after the New Moon and then the sellers will return. Combining these patterns with the technical picture, we could rally up to the gap at 1160 or even to the trend line at 1180 and then reverse lower. Those levels would therefore be attractive shorting opportunities, especially on Tuesday. The odds of declines increase on Wednesday and Thursday as the Mars influence is closer and Venus approaches its conjunction with Saturn. Saturn is still in a very tight and dangerous aspect with Ketu here, and I am expecting the Venus conjunction to release more bearish energy in the second half of the week. But we should be open to the possibility that there is no relief rally at all this week as the Saturn-Ketu aspect may sabotage the so-called positive early week aspects also. Thursday has the closest Venus aspect so that is the most likely day for the largest decline. That said, I would not be surprised to see it register big declines on either Wednesday or Friday. Friday’s Mercury-Jupiter aspect would tend to reduce the likelihood of declines on that day somewhat. There is a reasonable chance that we will break support at 1102 this week, although I can’t say how low we may go. The technicals strongly favour more downside so it seems more likely to come on this nasty alignment of planets. And they are quite nasty and capable of delivering some major downside. A more bullish scenario here would be a significant relief rally early in the week and then a late week decline that only goes to 1100.. In any event, I do think the week will be bearish overall with a possible close Friday between 1080 and 1100.
 Next week (Oct 3-7) also looks bearish as Mercury approaches its conjunction with bearish Saturn on Thursday,. Before then, Venus enters Libra on Tuesday so that may provide some lift for markets in the first half of the week. A major snapback rally looks pretty unlikely here so I would slightly favour lower lows although I would also note that Friday looks bullish on the Venus-Neptune aspect. In other words, this week could be less bearish than the previous one. The following week (Oct 10-14) also has some bearish potential as the Sun conjoins Saturn on Thursday the 13th. This could be an interim low of some importance although that is hard to say with any certainty. It is a bearish pairing to be sure but whether or not it breaks below previous lows is harder to judge. How low we go is even harder to say, although the usual range is very much in play — from 1000 to 1050 on the S&P500. This equates to about 9500-10,000 on the Dow. A significant bounce is likely to begin either on Friday the 14th or Monday the 17th as the inner planets transit the sign of Libra opposite bullish Jupiter. This may be a short lived rally, however, as the late October alignment involving Mars looks quite negative. The New Moon of Oct 26th may be close to an interim high. A decent sized retracement higher is possible here, perhaps back to a broken support level of 1102, 1120 or 1140. November is harder to call right now. The rally could resume in November but with less force. I honestly don’t know as there is a mixture of stronger Jupiter aspects in play here alongside a strong Saturn also. If we do rally through November back to 1150-1200 perhaps, then I would expect weakness to return in December and January. I generally think there is a major downside risk here that should not be ignored, but I am uncertain what the chart will ultimately look like. A lower low seems to be the most likely scenario by early 2012, perhaps somewhere between 800 and 1000 (8000-10,000 on the Dow).
5-day outlook — bearish SPX 1080-1100
30-day outlook — bearish SPX 1050-1100
90-day outlook — bearish-neutral SPX 1050-1150
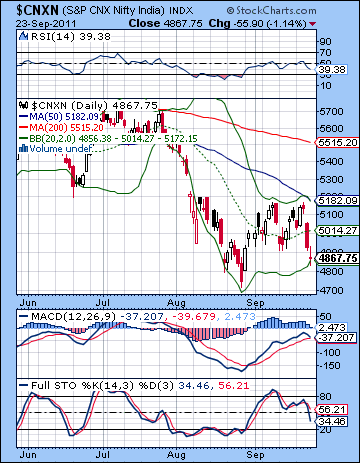 Stocks tumbled last week as the market digested the deflationary implications of the Fed’s Operation Twist and the approaching economic slowdown. The Sensex declined more than 4% closing at 16,162 while the Nifty finished at 4867. The week unfolded more or less according to plan as the Saturn-Ketu aspect delivered major downside to equity markets around the world. Monday was lower as expected on Mercury’s alignment with Saturn-Ketu. Then we got the anticipated bounce as Mercury broke free from Saturn’s influence on Tuesday and early Wednesday as the Nifty tested resistance at the 5200 level once again. Then Saturn took the reins and it was downhill after that. The late week Mars-Uranus provided the spark for the decline on Thursday and Friday in the wake of the Fed’s announcement. While we didn’t quite get down to 4800, the Nifty did come close as our bearish forecast largely played out.
Saturn is definitely ruling the roost here as its aspect with Ketu has indeed reaffirmed the deflation and recession theme in the minds of most investors. As I have frequently noted here for many weeks, this Saturn influence was likely to make this late September period quite negative. The fact that the aspect occurred in the same week as the crucial Fed announcement made an expansionary QE3 type of stimulus plan unlikely. This view has proven to be correct, as Bernanke did not have the stomach (or the political capital) to make the Fed’s balance sheets any worse. As a compromise, he opted for Operation Twist which swapped short term treasuries for longer term notes in an attempt to hold down rates in order to spur the economy. Needless to say, this lack of fresh Jupiterian liquidity was disappointing to many investors who were seeking another trip to the Fed’s punch bowl. Alas, there is no free lunch. Without this safety net beneath them, the markets quickly sold off. But now that the Saturn-Ketu aspect is separating and losing power, we need to clarify the extent of further downside risk to stocks. As I see it, there is an absence of any strong bullish aspects makes a significant rally unlikely in the near term. Short bear market rallies are still to be expected, but Saturn should remain strong enough over the next two weeks to keep stocks under pressure. Saturn will get likely get more bearish energy from the passing conjunctions of the inner planets which will extend the current state of depressed sentiment. A more significant rally is due after mid-October, but one should be cautious about taking long positions. This is very much a bear market so the best strategy is to sell any long positions into rallies near technical resistance levels. These can also be shorted by more risk oriented investors. We are likely to remain in this bear market through 2012 and into 2013. For this reason, any long positions should be chosen carefully and traded nimbly. Longer term buy-and-hold type investors may find attractive buying opportunities once the market has bottomed — probably in early 2013. We may well revisit the 2008 low of 2500 on the Nifty.
 While the technical picture worsened last week, there are significant signs of life for the bulls. Obviously, the inability to clear resistance at 5200 again was a huge sign of continuing weakness. There is a triple whammy of major horizontal resistance, the upper Bollinger band, and the 50 DMA. Bulls are lacking in confidence and can not muster up the strength to fill that large gap above 5200. For the moment, resistance levels are excellent shorting opportunities. The other potentially disastrous development for the bulls is that the MACD on the daily Nifty chart is about to form a bearish crossover. This can be extremely negative for the market as this occurred in July. At the same time, it’s not a signal for an immediate drop as there are often counter trend rallies to delay the inevitable drop. While a crossover points to lower prices ahead, it may eventually form a positive divergence and set the stage for a more lasting rally.
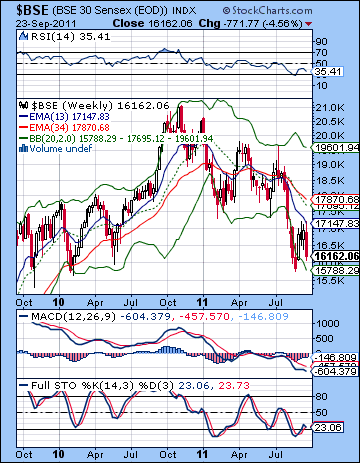
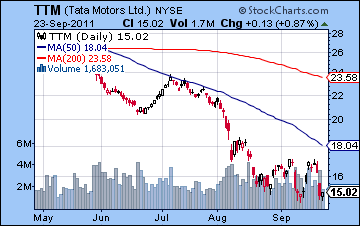
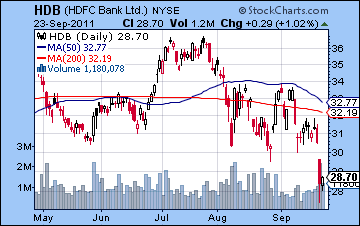
On the plus side, however, we could be seeing the beginning of a bullish inverse head and shoulders pattern. Friday’s low could be seen as the right shoulder and it roughly matches the low of Aug 21. If completed, this pattern would have an upside target of 5500 near the 200 DMA. I don’t quite see it happening here, but it is important to be open to the possibilities. If we bounce early next week as I am expecting, then it may take on more importance. A new low below 4800 would invalidate the pattern. The other marginally positive feature is that the 20 DMA is not declining but has been moving sideways. Although it is still bearishly aligned with respect to the 50 and 200 DMAs, it has at least stopped declining for now. Stochastics look pretty bearish though as it is falling towards the 20 line. The weekly BSE chart offers more hope to the bulls. Stochastics is attempting to climb above the 20 line here, although it is on the verge of a bearish crossover. Price is moving along the bottom Bollinger band and may be making a run towards the middle 20 WMA. Perhaps most importantly, we can see how the market has found some significant support around the 15.5-16K level which dates back to late 2009. It will take considerable more effort by the bears to break this support. The daily MACD crossover may be just what is required to break this support (4800 on the Nifty) but it will likely continue to bring in buyers and persuade sellers and shorts to relinquish control. Support is also key in the Tata Motors chart (NY: TTM). Despite a losing week, Tata formed a bullish double bottom pattern on Friday. This may persuade buyers to come in and try to push it back to the 50 DMA. It’s still a very bearish chart but a short term long is a tempting play. In keeping with the negative outlook on banks, HDFC Bank (HDB) suffered a bad week here including a gap down on Thursday. This is a significant break of recent support, although its piercing low matched the 2010 low. Its outlook is nonetheless more uncertain.
 This week features positive and negative influences although we are still very much in the grip of the bearish Saturn-Ketu aspect. Generally, I think the first half of the week could be more bullish with the bears in charge of the second half. On Monday, there is a Sun-Uranus aspect that could encourage risk taking and drive up prices. On Tuesday, we will have the combined effects of Mercury’s conjunction with the Sun just as the New Moon occurs. New Moons tend to be bullish for markets so I would lean toward more upside for these two days. At the same time, there may be tension building due to the approach of the Sun-Mercury pairing into alignment with malefic Mars. This is not a good aspect at all and could erase previous gains quickly. Just when this manifests is a little unclear. The alignment is exact late on Wednesday after the close so it could impact stocks negatively on Wednesday. In addition, Venus is approaching its conjunction with Saturn on Thursday. With the aspect from Ketu still in play, this could be quite negative. Friday looks harder to call, although I tend to think that most of the negativity would be out of the way by that time. A gain is possible. The early week gains could be sizable so we could make another run at 5200 and that rock hard resistance level. I suspect it won’t get that far and it may stop short at the 20 DMA near 5014 before reversing lower again. Where we close the week is hard to say. The bearish aspects here definitely have some serious downside potential so I would not rule out a break down of 4800 by Friday. This may be more likely if the early week rally fizzles quickly.
 Next week (Oct 3 -7) looks like it has more downside possible on the Mercury conjunction to Saturn. Mercury forms an aspect with Ketu on Wednesday and conjoins Saturn on Thursday so both days are candidates for possible declines. At the same time, we should see at least one up day since Venus enters Libra. Perhaps Tuesday would be more likely. Friday also tilts bullish due to the Venus-Neptune aspect. The following week (Oct 10-14) we get another dose of Saturn through the Sun’s conjunction on the 13th. This should make rallies difficult and could easily lead to lower lows. Perhaps the Nifty gets down to 4500 here in the first half of October. Jupiter’s aspect to Pluto should create a more bullish environment for the second half of October so some kind of rally is likely. The last week of October looks quite bearish, however, so some of those gains will be erased. November will likely bring more upside as Jupiter looks like it will strengthen ahead of its aspects with Uranus and Neptune. It is possible the rally will continue into December although I am uncertain of that. I suspect it that the rally will struggle through November. These look like lower highs, perhaps somewhere between 4800 and 5200. It is hard to say how high they will be since we do not yet know what the lows of the current correction are. December looks more bearish so we should see more downside at that time. This looks like another major corrective move lower than should carry into January and perhaps February of 2012. I am expecting lower lows in early 2012. If we manage to stay above 4500 in October, then this next down leg in the bear market would likely test 4000 on the Nifty. A major rally — perhaps fueled by QE3 — is likely to begin in Q1 2012.
5-day outlook — bearish NIFTY 4600-4800
30-day outlook — bearish NIFTY 4500-4800
90-day outlook — bearish-neutral NIFTY 4500-5000
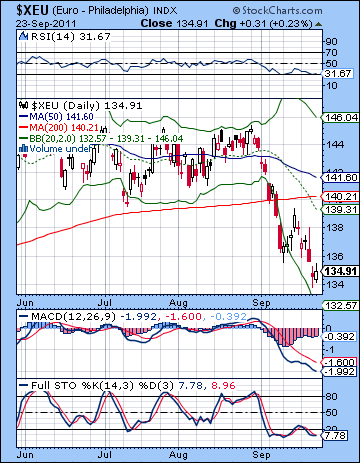 As Operation Twist dampened inflationary expectations last week, money continued to leave risky assets and flow into the US Dollar. This was bad news for the Euro as it lost another 2% closing below 1.35. The Dollar Index rose to 78.5 while the Rupee weakened to 49.42. This decline was in keeping with expectations as I thought the Saturn-Ketu aspect would likely cause more damage to the Euro. It seems the Euro is in a tug of war between economies realities (all bad) and political promises to backstop Greece and bailout any bank in trouble. The political promises still carry some weight at the moment as they have prevented from falling into the abyss so far. If the fundamentals of the Euro are stressed, the technicals remain bleak and continue to point to lower levels down the road. The previous week’s back test of the support line at 1.39 was attempted again last week. Quite tellingly, it could not quite make the same level as bulls gave up the fight on Wednesday before Bernanke’s speech. The Euro is close to being oversold here as RSI (31) is forming a double bottom with previous readings. It may find some some support here at 1.34 which dates back to early 2011. But the next rally attempt may not be able clear last week’s high and so the Euro could be subject to steeper declines, perhaps down to 1.29. This was the January 2011 low. I think this is quite possible from a technical point of view in the near term. A meaningful rally would require the 50 DMA to stabilize and turn higher. It may be a while before conditions are bullish enough for that to happen.
This week may begin positively as the Sun-Mercury-Uranus alignment lines up right on the ascendant of the Euro. It should be a positive placement that could correlate with a major gain. I would not be surprised to see a 2 or 3 cents gain spread across two trading days here. At the same time, Saturn is very strong right now and its affliction to the Mars in the Euro horoscope is onerous and will weigh upon the prospects of any possible upside. The second half of the week looks at least equally negative as the Venus-Saturn conjunction lines up right on the natal Mars in the Euro horoscope. It’s a very nasty pattern that is likely to erase the previous gains and could well test recent lows. Overall, I would expect more downside to prevail here, if not this week, then into next week. It looks like more of the same as we move into early October. October 12-13 could be a possible low or at least the beginning of a significant move higher. 1.29 is possible by this time. Then there should be a rally near the late-October Jupiter-Pluto aspect that carries into November. Perhaps the Euro can recapture 1.40. By mid-November things may start to fall apart again and December looks very bearish indeed. This next down move in late 2011 and early 2012 could see the Euro make new lows and approach the 1.20 level. We shall see how it all unfolds.
Dollar
5-day outlook — bullish
30-day outlook — bullish
90-day outlook — bullish
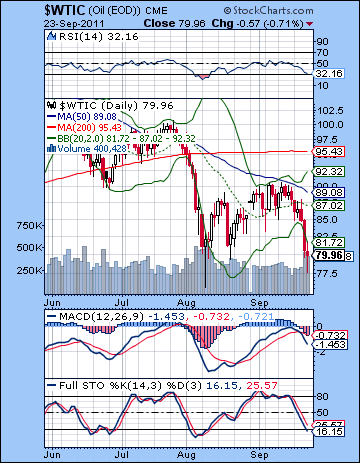 As Bernanke decided to postpone the Weimar trajectory (aka QE3) for the moment, crude oil got slammed last week as it closed at $80. It declined almost 10% on the week as most commodities lost their appeal as inflation hedges. This negative result was in keeping with our forecast as I thought $85 was quite doable with further declines also possible. Monday was negative as expected, as was the brief rebound we saw Tuesday. The downward pressure thereafter was a little surprising but given the Saturn-Ketu aspect, I was not shocked by the outcome. The technical outlook looks bearish as we got another MACD crossover on the daily. To make matters worse, it occurred just at the zero line thus stopping any upward momentum dead in its tracks. While we have some bullish divergence in this chart, it is hard to know how much weight to give it. RSI (32) and Stochastics (16) are close to oversold so it may take some significant new bad news to force more selling. Alternatively, it may require a rally that pushes up those values again before another down move is made. Crude is below the bottom Bollinger band so some kind of bounce is likely here. Resistance is probably near $85 which was where it was before the Fed announcement. Support seems quite clear around $80 as it matches previous lows. It may not be able to withstand another test. A close below support at $80 would be bearish and would point the way to lower prices going forward.
This week should begin fairly positively for crude as the Sun-Uranus aspect on Monday should increase risk appetite. In addition, the New Moon on Tuesday features a close Sun-Mercury conjunction which could well produce a second up day. Sentiment could change quickly by Wednesday however as the Mars aspect is likely to take charge. The Venus-Saturn conjunction on Thursday may also create a bearish outcome. I am therefore expecting more downside as the bearish aspects appear stronger than the bullish ones. Early October could see a mix of influences although I still expect Saturn to prevail here and prevent any major rallies from occurring. Lower lows are therefore more likely. However, I should note that I do not see a strong confirmation of a down trend in the natal chart so that should give condition our expectations somewhat. I would therefore not be hugely disappointed if we did not break below $70-75. A Jupiter-fueled rally is likely in the second half of October at the latest and this should carry over into November. This should be a significant retracement from the September high. The rally may run out of gas by mid-November when Saturn enters Libra. December and January look like another major move lower. I would expect lower lows at this time, although that is uncertain.
5-day outlook — bearish
30-day outlook — bearish-neutral
90-day outlook — bearish-neutral
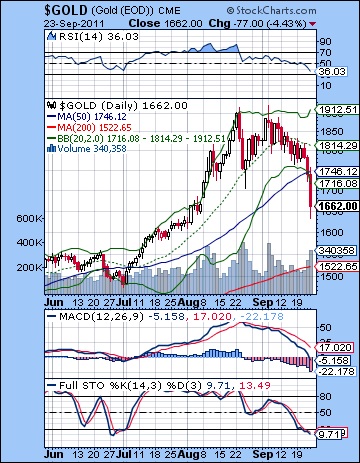 Safe haven no more. Ben Bernanke’s Operation Twist was like a bad dream for gold bugs as it failed to deliver more inflationary QE3 stimulus. As a result, commodities such as gold and silver sold off massively losing almost 10% on the week. This bearish outcome was in keeping with expectations as I thought the late week could produce major declines on the Mars-Uranus aspect. We even got a brief up day on Tuesday which was also within our game plan. I underestimated the intensity of the decline, however, as I thought $1700 was possible. Gold has fallen hard here and has closed the gap above $1650 that marked its parabolic breakout. There is more talk now of the gold rally being finished and I tend to agree. At least for now. Gold is vulnerable to further declines down to its rising trendline at $1550 or so. Stochastics have fallen below the 80 line and are pointing to further downside. Interestingly, MACD has yet to make a bearish crossover although it is rolling over. RSI (53) has further to fall also suggesting that $1500-1550 may arrive sooner rather than later. The 200 DMA at $1522 may also serve as support in the event the correction continues. Resistance may be provided by the 50 DMA now at $1746 in the event of any snapback rallies.
This week could see gold rally early in the week on the Sun-Uranus aspect. Tuesday’s Sun-Mercury conjunction is also a bullish-looking aspect for gold. So there’s a good chance we could see some upside that takes gold back above $1700. But the late week looks nasty again as Mars will spoil the party. And with a debilitated Venus still in Virgo conjoining Saturn, it seems that gold could well see another precipitous fall Wednesday or Thursday. I would expect to see new lows this week, perhaps breaking below $1600. Next week looks somewhat more bullish as Venus enters the more favourable sign of Libra. While we still have a Mercury-Saturn conjunction to contend with on Wednesday and Thursday, I do think we could easily finish higher. The Sun-Saturn conjunction on Oct 12-13 could mark a significant low or at least the last low before a reversal higher. While some recovery looks likely in October and into November, I’m not convinced it will be a powerful rally. It may only retrace 50% of its decline (to $1700?) before topping out sometime in November. Another move lower is likely to continue into December and January. If we touch $1500 in October, then it is possible that gold could correct all the way down to $1250-1300 by February. This is the next strong support level as it represents the bottom of the long rising channel. In that sense, the long term rally in gold will still be valid and there could be a good medium term buying opportunity then. Even here, I would be cautious about gold. I don’t foresee any sky high valuations (e.g. $5000) in the near future. I hope to have a better idea of the medium term outlook for gold in the coming weeks. At the moment, it’s not quite as clear as I would like. I can see a major correction coming at the end of 2012 that could defeat a buy-and-hold approach undertaken in early 2012.
5-day outlook — bearish
30-day outlook — bearish
90-day outlook — bearish

