- Stocks rising early in the week with weakness more likely towards Friday
- Dollar weaker on Tuesday but may recover later; Euro poised to rise to 1.30 before resuming its decline
- Crude oil gains likely on Venus-Jupiter into midweek; weakness later in the week
- Gold stronger early but then prone to declines as week progresses; pullback likely to gather strength after mid-September
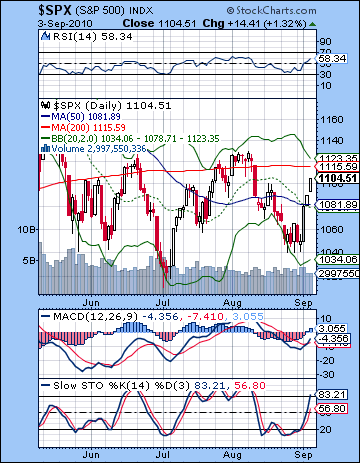 Stocks gained more than 3% last week as Friday’s better than expected jobs numbers put the finishing touches on a very bullish week. After bouncing off the 9950 support level early in the week, the Dow closed right at the 200 DMA at 10,447 while the S&P fell a little short of that level and finished at 1104. Well, it seems that even my more bullish scenario underestimated the forces of optimism out there. I had expected some upward push midweek on the entry of Venus into the upscale neighborhood of Libra. As it happened, the big move up occurred on Wednesday — the very day that Venus left Virgo behind and pushed into sidereal Libra. For the record, the transit of Venus through unfriendly Virgo coincided with a 7% decline from Aug 1 to Sep 1. It was a stunning reminder of the power of these planetary entries into new signs. The enhanced Venus energy convincingly reversed the market after early week uncertainty had taken prices to test support yet again. Once 1040 held firm, the bulls took control for the rest of the week as the market rose on consecutive days. I also erred in thinking that Friday’s Sun-Mercury-Rahu pattern might take prices lower, even if temporarily. It was somewhat discouraging to see this kind of bullishness so early in the month although it was not entirely unexpected. The proximity of the Jupiter-Uranus conjunction here certainly provided some support to the bulls and I thought we could test key resistance levels at 1100 and even 1130 sometime in September. But what about the supposedly bearish Mercury retrograde period that began on August 20 and will last until September 12? While that appears to have had a hand in the push down towards 1040 last week, its bearishness may well be overwhelmed at the moment by various bullish influences. This was always a possibility as I didn’t fully expect any big move down in early September in the middle of Jupiter-Uranus conjunction. Looking at the key medium term influences in play here, we have: 1) the Jupiter-Uranus conjunction (bullish) which is exact on September 18 and 2) Venus in Libra (bullish) which extends into October, although this will likely fade fairly quickly, 3) retrograde Mercury until September 12 (bearish) and 4) Mars in Libra (bearish) until October and finally, 5) Saturn’s square aspect with Rahu/Ketu that is exact on September 27. Some of last week’s gains are probably associated with Jupiter-Uranus and Venus in Libra and there is some reason to expect they will likely continue to dominate the scene into at least this week. In the most bullish scenario, we could have rising prices until the conjunction itself on September 18 (or Monday the 20th). I’m a little skeptical the up trend could last this long but I know I often have a bearish bias. After that, I still believe that Saturn will take over and take prices significantly lower towards the end of September and into October. Just where we end up is an open question as it partially depends on how high we go here in September. A 15% decline seems quite doable given the various influences in play, although if we climb back up to 1130, then that would only take the S&P down to 980 or so. This would be somewhat disappointing but at least salvage some intrinsic element of the bearish scenario. We could still end up closer to 900 in October although it may not be prudent to actually expect that deep a selloff.
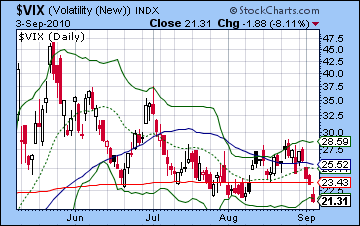
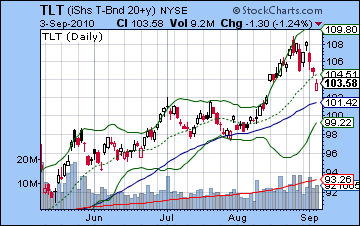
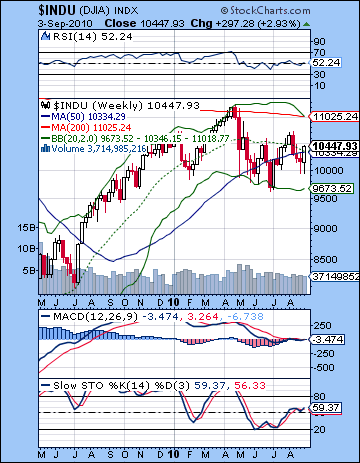 The bulls assumed significant technical advantage last week. Not only did the bears fail to break below the stubborn 1040 level for the third time, but Wednesday’s rally decisively broke above the falling August trend line as prices move higher. Friday’s close took the S&P to another obvious battleground: the more important falling trendline off the April high. If prices rise above this level, then the bear case will suffer a critical, although probably not mortal wound. This line is falling at a rate of about 5 points a week, but one major up day next week will violate it. That will then leave the 200 DMA at 1115 as resistance, and then the more important previous high of 1130. If 1130 is taken out, then the bears will definitely be in big trouble and the prospect of a major autumn decline will largely be off the radar for many investors. What are the chances that this rally could go higher than 1130? I don’t think it’s likely, but I certainly would not rule it out, even if I think that we’re ultimately headed lower regardless of where the current bounce ends up. Given the default towards bearishness that prevails out there at the moment, a breakout above 1130 may be just what is needed to precipitate a severe correction. Volume was semi-decent last week, suggesting that a couple more good economic numbers and the bulls would be further encouraged to take it to 1130 or more. The 20 and 50 day moving averages are still moving lower suggesting that the bounce has yet not graduated into a full blown trend. Prices ended up approaching the upper Bollinger band (1123) and since that is fairly close to the 1130 resistance level, we may see prices stall once they come a bit closer. Predictably, the SPX chart shows a bullish crossover in the MACD. What is interesting to note here is that even if prices match the previous August high or go higher, it is unlikely that MACD will follow. That will set up a negative divergence and will indicate an imminent move lower. Stochastics (83) have moved all the back to the oversold level so that offers some hope to bears. Not that this is an immediate indication of a reversal lower, but it does offer some plausible rationale for a larger reversal scenario in the days to come. The weekly Dow chart shows that prices have once again bounced up to the middle Bollinger band (20 WMA). Previous bounces more or less came to a halt near this resistance, so we will have to see how much further it can go. Weekly MACD is still hugging the zero line and is running quite flat as if to await the next move. We can also point to some intermarket levels that may suggest that a reversal is not far off. The Euro-Dollar pairing is rapidly coming up to kiss the rising trendline goodbye around 1.29-1.30 so that could again head south. Euro weakness strongly correlates with equity weakness here so that offers some plausible evidence that money may flow back into the Dollar in the near term. Bonds have been retracing lower since their heady advances and is also fast approaching its supporting trendline from the April high. They appear to be filling a large gap here and could conceivably reverse very soon. Of course, there is no guarantee that these trendlines will all hold, but they nonetheless offer the possibility that these various asset classes could move in syncopation. Meanwhile, the VIX got clobbered last week and is now barely clinging to previous support levels near 21. Any further move lower would be a technical setback and might indicate a move back to recent lows around 15. So while last week’s bounce handed bears some key defeats, the bulls have a formidable task ahead of them if they are to take prices substantially higher beyond the current trading range of 1040-1130.
 This week features two important short term influences. After Monday’s closing for Labor Day, Venus will be in minor aspect with both Jupiter and Uranus on Tuesday and perhaps into Wednesday. This trio of planets is usually quite bullish so I would be surprised to see much downside at the outset. We may only get one up day out of this pattern and this is more likely to be Tuesday rather than Wednesday, but there is a good chance that we will be net positive across both days. But the bullishness may stop there, as the other new influence this week is Mars. On Monday, Mars enters Libra to join Venus where it will stay until mid-October. Admittedly, this is more of a background influence but it is nonetheless bearish. It’s conceivable that Monday’s global markets could reflect some of that pessimism here although I don’t fully expect it. What’s more puzzling is how to reconcile the probability of a gain on Tuesday and perhaps Wednesday with the technical picture. If it moves higher, then it is unlikely to reverse before it gets to 1120 at least on the S&P. Perhaps it will be a big up day on Tuesday that goes all the way to 1120 or more. Thursday and Friday look more bearish, however, as Mars aspects Neptune and then Mercury backs into a tense pattern with Saturn. The probability of a bearish outcome for both of these days is increased by virtue of the Moon’s difficult situation: on Thursday is conjoins Saturn, while Friday it is hemmed in between Saturn and Mars. While the end of the week looks bearish, I still think there is a chance we could finish at current levels or higher, especially if the early week Venus influence pans out the way I think it could. So it seems unlikely that we will move above 1130 this week and it is also unlikely that we will move much below 1100. A more bullish scenario would be a rise into Wednesday of 1120-1130 intraday with a somewhat lower close nearer to 1120. Then some selling into Friday that sees the S&P back to 1105-1115. A more bearish scenario would be a rise to 1115-1120 Tuesday, followed by down days afterwards, with a Friday close somewhere around 1090-1100. I would lean towards the bullish scenario here, if only because the Jupiter-Uranus appears to be gaining in strength and will continue to do so for another week or two.
 Next week (Sep 13-17) looks more mixed with a possible bearish beginning to the week on Monday’s Mercury-Saturn aspect. Mercury will be just coming out of its retrograde cycle so it will be moving more slowly than usual. That may increase the degree of affliction with Saturn. At the same time, however, there is a positive Mars-Jupiter aspect that may offset that negativity to some extent early in the week. A gain is likely on either Tuesday or Wednesday and then there is a late week Venus-Saturn aspect that may dampen the animal spirits somewhat, especially on Thursday as the Moon conjoins Rahu. While Jupiter and Uranus will be within spitting distance by this time, I’m not certain they will exert a direct influence on the market and take it much higher. In fact, I think it is somewhat more likely the market ends lower during this week. The following week (Sep 20-24) looks much more bearish. The early week sees the Sun aspect Jupiter so that could generate a day or two of gains, but Venus and Mars come under the aspect of Ketu by week’s end so that is likely to undermine any further rally attempt. After that, we buckle up for Saturn’s square aspect to Rahu and Ketu. With the Sun poised to join the fray in its conjunction with Saturn on September 30, this alignment is very unstable and could produce very sizable declines of crash-like proportions. The first week of October also looks difficult as Mercury prepares to conjoin Saturn on October 7 just as Venus is about turn retrograde. I have previously written that this could be a significant bottom and there is still some justification for that view. However, a more bearish scenario would see the decline extend into the third week of October. I don’t think this is likely, but it is conceivable if there is a radical shift towards a more negative expression of energy over the course of September. Some kind of sharp bounce is likely to begin in the second half of October and continue into early November, say until the 6th. The market may drift sideways or lower into early December. The period immediately after Christmas looks very bearish.
5-day outlook — neutral-bullish SPX 1090-1120
30-day outlook — bearish SPX 980-1020
90-day outlook — bearish SPX 950-1050
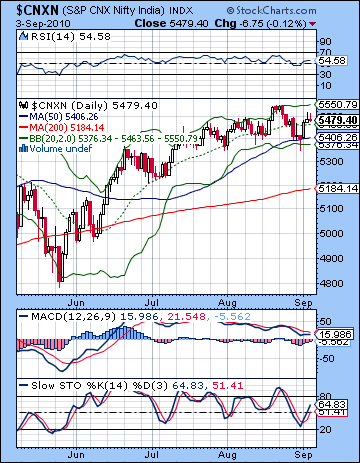 Stocks in Mumbai added 1% last week as improved global economic prospects reduced anxiety over a possible double dip recession in the US. After some early weakness, the Sensex closed at 18,221 while the Nifty finished Friday at 5479. While the overall outcome was not wildly unexpected, Wednesday’s solid gain arrived a little later than expected as I had expected more gains in the early going. While I noted the probable bullish effects of the entry of Venus into the sign of Libra on Wednesday, I thought they might manifest earlier due to more favourable aspect patterns in the NSE chart. As it happened, Wednesday’s rise coincided exactly with the sign enhancement of Venus. The lack of any late week selloff was also disappointing as the influence of Rahu on the Sun-Mercury conjunction only produced the smallest of declines on Friday. Stocks continue to trade in a narrow range here, although a little below their recent highs. So far, the bearish effects of the Mercury retrograde cycle appear to be exercising their influence over the Indian market as stocks have largely been in retreat since its start on 20 August. Whether equities continue to retrace for the balance of its cycle until 13 September remains to be seen, but it does seem to be pulling down sentiment somewhat. It likely would have taken stocks lower last week if not for the bullish effects of the oncoming Jupiter-Uranus conjunction and the entry of Venus into Libra. Both of these are more medium term influences that act to support prices, albeit perhaps in a less focused way than a typical fast moving aspect. Venus remains in Libra until November but that is unlikely to affect the ultimate trend in a significant way. The ingress day (Wednesday) was perhaps an exception to the rule in this respect, as stocks received a one-time boost from this enhancement of the energy of Venus. Its other probable manifestation is through occasional aspects which are likely to bring about bigger single day rises than would otherwise be the case. The Jupiter-Uranus conjunction is exact on 18 September so there will be a repository of bullish strength there until that date. At the same time, it is important to realize that this conjunction is unlikely to take prices higher all by itself. It is more likely to act as a buttress against undue pessimism and prevent prices from falling too quickly. One it separates and Saturn begins to strengthen again, the probability of price declines will increase. The key aspect is the square between Saturn and Rahu/Ketu that is exact on 27 September. These two planets have difficult energies on their own and when combined it greatly increases the likelihood of a significant decline. For this reason, the second half of September and early October remain the most likely period where we will see falling prices that break out of the current trading range. The power of the Saturn-Ketu aspect will be bolstered by the transits of the Sun and then Mercury immediately after the exact aspect and opens the door to the possibility of decline greater than 10-15%.
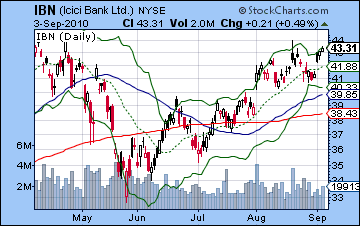
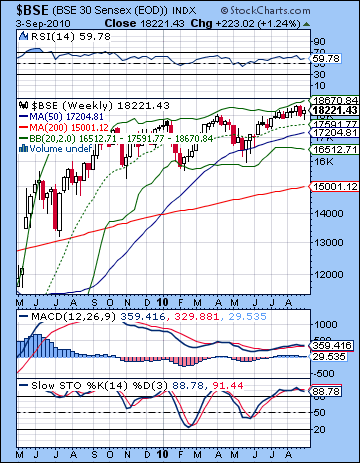 Despite the gain, there was not much change in the technical situation of the market. The early week pullback to the bottom Bollinger band was a predictable testing of support but Tuesday’s hammer candle suggested that the bulls would take the baton. Tuesday’s low also matched the 50 DMA and suggested the bulls will have control of the market for the moment. The recovery was quick and impressive but it’s worth noting that Thursday’s and Friday’s candles were inverted hammers and therefore do not strongly indicate a continuation of this current up move. That said, there is still a little more room on the upside to the upper Bollinger band (5550) and it would not take much for the market to reach that level. Volume was rather mediocre here and Wednesday’s rise came on just 14k on the Sensex. Meanwhile both momentum and oscillating indicators do not offer clear support for a continuation of this rally to higher prices. We still have a bearish crossover in daily MACD on the Nifty chart and a negative divergence is evident with respect to previous occurrences of the 5479 level in early August. RSI (54) is also in a negative divergence with respect to the July low. Stochastics (64) are on the upswing here and still have a little ways to go (perhaps even just one up day) before reaching the 80 overbought level. Once there, stocks may be more susceptible to profit taking and declines. We can also spot a negative divergence of recent troughs in the Stochastics indicator with respect to the July low. The lower low on the indicator is a signal that prices will soon take out the July low. No matter how vulnerable some of these indicators may appear, all three key moving averages are still rising and last week’s low did not take out the late July low. This strongly suggests a bullish orientation to the market for now. Of course, the bears did succeed in breaking below the immediately preceding low of 13 August but that was a relatively easy task. The weekly BSE chart is actually improving somewhat at this point as we can discern a bullish crossover in the MACD although there is still a negative divergence with respect to the April high. The chart of ICICI Bank (IBN) perhaps illustrates the technical overhang of this market. While the recent rally has been quite strong with gains occurring on decent volume, it has yet to take out its April highs. Until it violates the rising trend line off the July lows, prices will likely stay firm. A breakdown of this trendline would require a drop of more than 3%. As far as the Nifty goes, bulls will try to match previous highs at 5550 and then take it higher. Bears have to try to break support of the 50 DMA (5406) and the bottom Bollinger band (5376). More specifically, I think there have been several touches of the 5350 line so bears will start to turn the tables if and when they can get a close below that level.
 This week features two potential market movers. On Monday, Mars enters Libra where it will join Venus. Since Mars is considered a malefic planet, there is a potential for a down or flat day here. That said, these planetary ingresses are somewhat less reliable than simple aspects so it could conceivable go either way. And with US markets rising Friday on better than expected job data, it seems fairly unlikely that stocks could fall. Nonetheless, the Mars effect here may reduce the upside. Mars will continue its transit of Libra well into October and therefore we should expect greater weakness in the consumer sector and tourism. Another reason why Mars may not produce a negative day on Monday is because Venus will be quite close to a minor aspect with Uranus and Jupiter. The aspect will actually be exact with Uranus on Tuesday and Jupiter on Wednesday so those two days look most positive. I would not rule out all three days being positive, and it seems quite likely that the early part of the week will be net positive. Perhaps there is another run towards 5550 here. But from Wednesday onwards, the risk of a pullback increases. Transiting Saturn will form a tight minor aspect with the Moon in the NSE chart chart and this will be echoed by transiting Mercury by Friday. These influences seem likely to move prices lower and may be enough to wipe out any gains made early in the week. While both Thursday and Friday look fairly bearish, Friday may well be the worse of the two days as the Moon is hemmed in between Mars and Saturn. Bearish days have generally disappointed on the downside recently, so let’s see what kind of action we see here. I’m not expecting anything much, but at the same time, I would not be surprised by a 1% or greater move. Overall, there is a good chance we finish close to current levels.
Next week (Sep 13-17) looks more bearish as Mercury will reverse its direction early in the morning and sit in close aspect to pessimistic Saturn for much of the Monday trading session. Some midweek recovery is likely as the transiting Sun aspects several favourable points in the NSE chart, but more weakness is likely by Friday. Overall, I would think that prices will move lower here, perhaps testing support at the lower Bollinger band. The following week (Sep 20-24) also looks bearish. The Sun-Jupiter aspect on the 21st may offer some upward movement, but given the generally tense patterns in the sky, it may only serve to magnify the downward move. I am expecting a significant move down here, perhaps 5% on the week or more. Not only will Saturn aspect Ketu around this time, but Mars will in be aspect with Ketu also, especially around the 24th and the 27th. These could be the most volatile days. After that, I expect the market to stay in the down trend into early October and the start of the Venus retrograde cycle on 7 October. As a conservative target we should at least be able to manage 4900-5000 which would maintain the integrity of the rising channel dating back to 2009. Beyond that, it is hard to be confident given the extent of the recent bullishness. The trend should switch back to positive in October, perhaps as early as the 8th or as late as the 24th depending on the strength of the various factors. If the downtrend remains in place until later in October, then we could break as low as 4500. We should have a reversal higher starting in October and extending into early November as Jupiter approaches its direct station. Markets look ill-defined and choppy for most of November and December. I will have to revisit the charts in the future to see if any patterns stand out.
5-day outlook — neutral NIFTY — 5400-5500
30-day outlook — bearish NIFTY — 4900-5100
90-day outlook — bearish NIFTY — 5000-5400
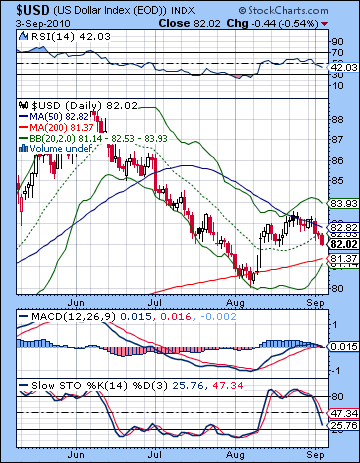 A bad week for the greenback last week as the renewed appetite for risk sent investors in search of returns in the equity markets The USDX closed near 82 while the Euro climbed back towards 1.29. The Rupee similarly reaped the benefits the optimistic mood and closed near 46.5. This was a disappointment although not entirely a shocking one as I noted the absence of any clearly positive aspects in the Dollar chart. If only I had put two and two together there. I did note that Monday looked pretty good and we did see the Dollar rise. I also noted that the midweek had some dubious Rahu aspects in play and they generally didn’t augur well. Wednesday saw a big down day. So the real misread concerned the late week period which I thought would be positive but ended with further selling. Technically, the Dollar looks like it might sink a little further before finding support. It closed below the 20 DMA on Friday and may wind up touching the 200 DMA once again before rebounding. The 20 DMA is still rising though and is on the verge of a bullish crossover with the 50 DMA so that may bring in more buyers in the coming weeks. Stochastics (25) are sinking quickly to the oversold area so at least that bodes fairly well for a reversal soon enough. But MACD is on the verge of a bearish crossover here and is heading lower so that is looking more troubled. The Euro seems destined to do the "kiss-n-fall" as it climbs back towards its rising trendline off the June low. At present, this is about 1.295-1.30 and would follow a classic pattern whereby prices find resistance where there was once support. A break above this resistance line would be very bearish for the Dollar and would likely translate into a major new leg in the equities rally. It deserves to be watched carefully.
This week does not look especially promising for the Dollar, at least in the early going as the Venus-Jupiter aspect is likely to embolden risk takers and bump up the Euro into Tuesday at least. There is still some potentially positive transits here but they may not get going until perhaps Wednesday and after. The Sun sits high in the USDX chart on Wednesday so that is generally a positive indication. Thursday also looks positive as Venus forms a minor aspect to the ascendant. These fast moving aspects may be enough to offset any early week losses. And then there are still the heavyweights Jupiter and Uranus now honing in on the natal Sun in this chart so there should be plenty more upside here in the next couple of weeks. We could see 1.27 in the EUR/USD by next week and 1.24 the following week. An interim high or sudden up move is quite possible on September 20 when the Sun, Jupiter and Uranus all align with the natal Sun in the USDX chart. Another significant high may occur on September 29 when the Sun conjoins Saturn at the top of the natal chart. This should represent a heightened profile for the Dollar for some reason, presumably as a safe haven as stock markets are plunging. It is conceivable that the Dollar itself may eventually begin to fall in a stock decline, but it seems a bit too early for the Dollar to be abandoned as safe haven. After peaking sometime in late September or more likely, in October, the Dollar will decline significantly in November and December.
Dollar
5-day outlook — neutral-bullish
30-day outlook — bullish
90-day outlook — neutral
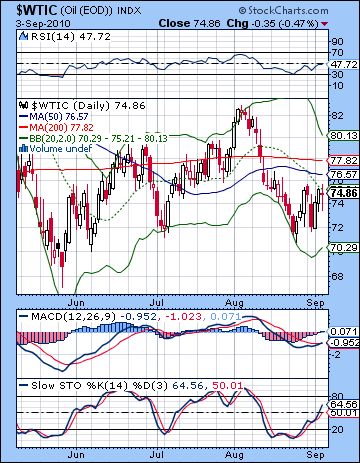 Poor demand prospects sent crude tumbling further last week as it closed below $75 in volatile trading. This outcome was expected as I had leaned towards a negative result here, albeit within a generally mixed context. The entry of Venus into Libra did crude a big favour as prices reversed higher on Wednesday and the rally continued into Thursday. I thought some of this energy might manifest a little earlier but bears pushed prices lower into Tuesday. As expected, however, the end of the week saw the bears take control on the Sun-Mercury conjunction. Nonetheless, prices largely bounced off their intraday lows and we ended up with a doji candlestick. Crude continues to exhibit signs of technical weakness here as prices failed to climb above the 20, 50 and 200 DMA. All three are still falling and unless prices can jump over one of these levels of resistance, there is a greater likelihood for further price erosion. MACD is still below the zero line, but has turned higher and we see the beginnings of a bullish crossover. We can see a positive MACD divergence with respect to the May low but a negative divergence with the July low. Stochastics (64) are moving higher towards the overbought area and we may soon see increased selling pressure as investors look for reasons to exit their positions. Resistance is focused in the $75-77 area and then perhaps a firmer level sits on the falling trendline off the April high. This is currently around $81. A break above that level would likely reinvigorate the bulls to challenge the early August high. Support is still clustered around the previous low of $72.
This week looks quite mixed as the early week bullishness on the Venus-Jupiter aspect may be offset by some difficult patterns forming later on in the Crude Futures chart. After Monday’s closing, Tuesday’s session may be positive as Venus reciprocates Jupiter’s favor and this aspects natal Rahu in the key natal chart. Wednesday could also be positive although this outcome seems both less certain and with a smaller increase likely. Thursday looks more negative as the Moon conjoins Saturn and Mars opposes its position in the natal chart. Friday also leans towards the bears as the Moon is hemmed in between Mars and Saturn. Friday may be less negative than Thursday, however. Overall, there is a reasonable chance for further gains here even if the end of the week is negative. But it all hinges on Tuesday. If for some reason Tuesday is negative, then that would severely weaken the prospects for gains this week. But I am expecting the bulls to prevail there. Next week will likely begin on weakness on the Mercury-Saturn transit and then a midweek rally attempt and down again at the end of the week which may tilt the week towards the bears overall. The end of September seems quite bearish as Saturn opposes the natal Sun in the Futures chart. This is a bearish setup in addition to the bearish transit effects of the Saturn-Ketu square. We could see a significant bottom in the crude oil market sometime in October, probably after the start of the Venus retrograde cycle on October 7.
5-day outlook — neutral-bullish
30-day outlook — bearish
90-day outlook –bearish
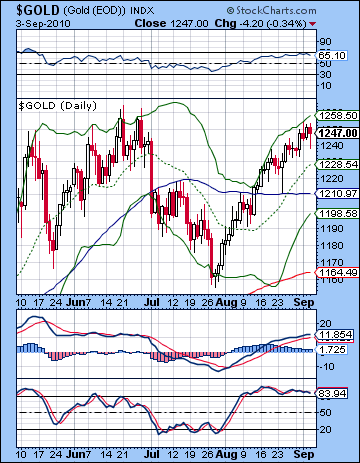 As the Dollar fell out of favor, gold extended its advance and rose another 1% on the week to close just under $1250 on the continuous contract. This was not an unexpected development as we thought that the entry of Venus into Libra would boost gold’s appeal. The late week Sun-Mercury conjunction turned out to be a non-event, though, as prices fell only moderately and largely recovered by the close. Gold seems unstoppable here as it moves relentlessly towards its previous high of $1270. The technical situation seems a little overdone at the moment, however. Price is pushing up against the upper Bollinger band ($1258) suggesting that some pullback may be in the offing. MACD is showing signs of possibly rolling over as histograms are narrowing here. RSI (65) bounced off the 70 overbought line twice last week and it may be time for gold to take a breather. Stochastics (83) are overbought here and are showing a negative divergence with respect to previous highs. Resistance is going to be pretty strong above $1250 so the gold bulls (and bugs) will have their work cut out for them to take it above that level. A break below this steeply rising trendline ($1240) could prompt a quick retracement down to the 20 DMA ($1228) or perhaps even the 50 DMA at $1218. The 50 DMA offered support on Aug 24 and I would not be surprised to see it act as support again in the near term. Gold is still in a strong bullish up trend, however, as the 200 DMA is rising. When we finally get a decent pullback, the 200 DMA ($1164) will be a critical support level.
This week gold may push higher at least in the early going. Tuesday’s Venus-Jupiter aspect is likely to benefit gold, particularly as it will resonate with the GLD ETF natal chart. The good vibes could continue into Wednesday although that is less certain. Mars’ entry into Libra this week is likely to be a negative influence on gold which may begin to assert itself towards the end of the week. There is a chance for a positive week here, although Friday’s session has the potential to take prices lower which could radically alter the outcome. My therefore outlook is neutral this week. Next week will see the Sun enter Virgo where it loses some strength so that may the necessary prerequisite for gold to significantly come off its highs. The following week also looks bearish as the Saturn-Ketu square is likely to shake up financial markets. While it is possible that gold could be the beneficiary from such turbulence, I don’t think this is the likely outcome as natal afflictions in the GLD chart appear to be growing stronger as we move further into September and October. September 29-30 may be particularly difficult for gold as the Sun conjoins Saturn on those days. I think a retracement to $1170 is quite likely by October and it may well be deeper than that. An October low seems the most likely scenario at this point. As the Dollar weakens after that, gold should rally again in the final two months of the year.
5-day outlook — neutral
30-day outlook — bearish
90-day outlook — bearish

