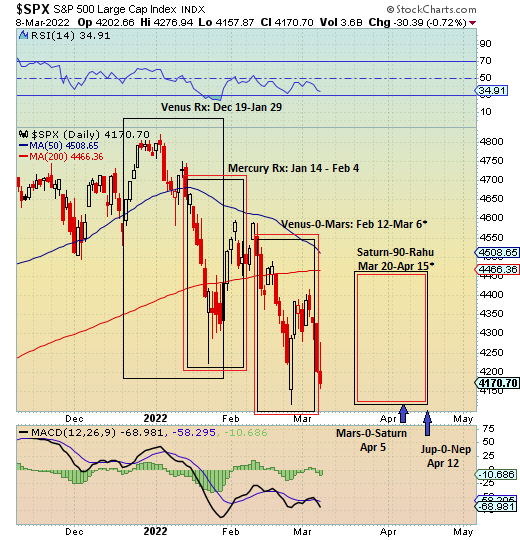
The current decline in the S&P 500 reflects some of the difficult alignments we have seen in the past two months. The period of overlapping retrograde cycles of Mercury and Venus (January 14-January 29) closely coincided with the initial pullback in January. Retrograde periods aren’t that bearish in themselves, but the simultaneous retrograde cycles of Mercury and Venus is quite a rare occurrence and may have served to amplify their respective underlying negative influences.
The second leg lower that started in mid-February appeared to start just as Venus was approaching its conjunction with Mars. Normally, this conjunction between benefic Venus and malefic Mars results in just a day or two of declines or sideways trading. But due to the slow velocity of Venus after resuming its forward motion on January 29, the conjunction has lasted for several weeks. But we should note that the conjunction start and stop dates are approximate.
I have somewhat arbitrarily taken a one degree separation on February 12 as the start of the conjunction box on the chart and used the exact conjunction from March 6 as the culmination of the Venus-Mars conjunction. The fact that stocks have continued to fall early this week suggests that the bearish Mars influence may not yet be done, even though these planets are now separating. Indeed, the conjunction will remain within a very close range of one degree until March 12.
There is a potentially significant alignment upcoming in late March and early April as Saturn squares Rahu (North Lunar Node). As both Saturn and Rahu are considered malefics, there is some possibility for market turbulence here. As before, the alignment dates of March 20-April 15 are quite approximate and should only be seen as a general guide for when influences are likely to manifest.
Actually, the Saturn-Rahu square will be part of a much larger alignment as Mars will conjoin Saturn on April 5, and Neptune and Jupiter will align with Saturn around April 12. The presence of Jupiter in the mix suggests the availability of some bullish energy which could coincide with gains. And yet on balance, the picture suggest caution.
N.B. The positioning of the box is not a projection of price, but rather a means to highlight specific time periods.

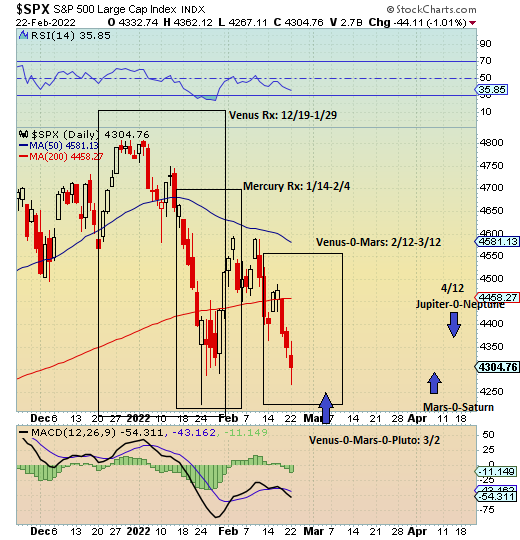
This chart reflects the bearish influence of the overlapping Venus and Mercury retrograde periods from Jan 14 until Jan 29.
Recent weakness has fit well with the ongoing Venus-Mars conjunction as bearish Mars tends to undermine the bullish bias of Venus, the planet of value.
Let’s see how long this unusually long Venus-Mars conjunction depresses stocks. Gradually, Venus is catching up to Mars and will eventually separate from the conjunction on March 5, although it will remain within a close one degree conjunction until March 12 (shown here). The speed of Venus is due to exactly match that of Mars this Thursday at 44 arc minutes and 33 seconds per day.
Other significant alignments worth watching at the Venus-Mars-Pluto triple conjunction on March 2, the Mars-Saturn conjunction on April 5 and the Jupiter-Neptune conjunction on April 12.

We can see that the January correction occurred during the simultaneous retrograde cycles of Venus (Dec 19-Jan 29) and Mercury (Jan 14-Feb 4). Other factors no doubt played a role in the pullback, including the Papa Katari (scissors) Yoga as the Sun and Mercury were in-between malefics Saturn and Pluto.
Looking ahead, the protracted conjunction of Venus and Mars is likely to see some significant movement in the markets. Since Venus is coming off its retrograde cycle, it is moving slower than usual and thus set ups a long conjunction with malefic Mars. Using one-degree orbs, the Venus-Mars conjunction lasts from Feb 12 until March 12.
Other potential noteworthy alignments including the Mars-Saturn conjunction on April 4 and the Jupiter-Neptune conjunction on April 12.


