

 (21 June 2025) US stocks finished slightly lower this week as the Israel-Iran war weighed on sentiment. Despite the geopolitical uncertainty, markets are still within striking distance of the February highs as the powerful post-tariff rally remains intact.
As previously noted, the current planetary alignments lean a bit bearish for the next few weeks. While the Jupiter-Saturn square was bullish leading up to the exact 90-degree alignment on June 15, my study showed a weak but persistent negative correlation in the days and weeks following. A similar effect was seen with the Jupiter-Neptune square (exact June 19) as average returns were slightly negative in the month following the exact alignment.
Since both average effects were fairly small, we should be cautious about making any forecast for the coming weeks. But when we add the likely bearish impact of the Sun-Saturn alignment in the NYSE minor progressed chart, the evidence appears to be accumulating on the bear side.
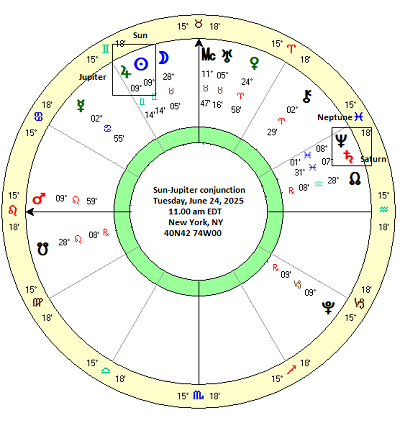
Next week will mark the annual conjunction of the Sun and Jupiter which occurs on Tuesday, June 24. As a natural benefic, Jupiter is a bullish planet whose alignments are said to coincide with gains. Its conjunction with the Sun would therefore seem to be a reasonably high probability of bringing some upside. But what does the evidence say?
Sun-0-Jupiter results
Looking at the past 60 Sun-Jupiter conjunctions (1959-2024), we can see there is a slight bullish bias in the data. Taking the long 60-day window around the conjunction (first column, “-30d 30d”), the average gain was 1.89% with a median of 1.75%. Based on the average annual return of 6.3% for the Dow Jones Industrials from 1959 to 2024, this compares favorably with an expected return of 1.07%. The 60-day period near the Sun-Jupiter conjunction was almost twice as bullish as chance would predict. However, we should note that the odds of a positive result (63%) was very close with the long-term average which is about 62% based on this Motley Fool study. And given the wide range of outcomes (Standard Deviation was a whopping 6%!), we should not put too much faith on this average return.
Breaking it down into separate intervals of 30 days before the conjunction (“-30d 0d”) and 30 days after the conjunction (“0d 30d”), we can see that both are equally bullish (1.00% and 0.91%) and easily exceed the expected value of 0.54%.
Shorter intervals had less of a bullish bias, however, as the 40-day window (“-20 20d”) had an average gain of 0.82% which was very close to the expected value for that interval at 0.71%. The before and after intervals showed little difference and were very close to what chance would predict.
The 20-day window (“-10d 10d”) was slightly more bullish (0.55%) than chance would predict (0.35%) with little difference between the 10 days before or 10 days after the exact conjunction.
The 10-day window (“-5d 5d”) was actually slightly negative (-0.18%) with the 5-day interval (“0d 5d”) following the conjunction being somewhat more bearish at -0.25% with only 45% of cases being positive. That is a very unexpected result.
These results suggest that the bullish reputation of the Sun-Jupiter conjunction is largely undeserved. While we can detect some positive bias in the long 60-day and 40-day intervals, these are so small and and so variable as to be barely worth mentioning. Perhaps more significant is the fact that the period immediately before and after the conjunction was actually a bit bearish. This is relevant to the current circumstance since Thursday’s close was 5 days before the exact conjunction. Rather than a bullish influence, we may therefore have entered an additionally bearish window of influence that extends to June 29 — 5 days after the conjunction.
A Sun-Jupiter conjunction bullish pivot?
While the original bullish hypothesis wasn’t confirmed, what about the possibility that the conjunction might act as a trend reversal pivot? If prices had been trending lower up until the conjunction, then it is possible that they might undergo a bullish reversal in the days after the conjunction. I tested for this possibility across several different intervals but found little evidence to support it. The best evidence was perhaps found with the long 60-day window. Selecting declines of greater than -1% in the 30 days leading up to the conjunction, prices reversed higher in 79% of cases (15 of 19 cases) for an average gain of 2.58% 30 days after the conjunction.
While this looks significant at first blush, much of the apparent reversal may be attributed to simple mean reversion. If stocks have been falling for a month before any given date, what are the chances that they will bounce the following month? Pretty good actually, although we can still take note of the potentially bullish effects of Sun-Jupiter here. If nothing else, the Sun-Jupiter conjunction could act as a useful marker for short positions that may be worth covering in anticipation for a reversal. Shorter time intervals showed smaller reversal effects, however. The 20-day window (“-10d 10d”) that fulfilled the -1% criteria had a bullish reversal 68% of the time (13 of 19) for an average gain of 0.91% in the 10 days after the conjunction.
This 20-day window is the most relevant to the current situation since the DJIA formed a high on June 11 of 42,865 and closed today, June 20 (9 days later) at 42,206. Stocks are therefore currently in a short term down trend. Assuming the Dow still satisfies this >1% decline threshold on Tuesday, June 24 and trades below 42,437 then there is a 68% chance that it will reverse higher during the 10 days that follow (July 3). But given the modest size of the average gain (0.91%) it is not a very compelling reason to buy stocks on June 24. Obviously, it we see some upside early next week, then the 1% threshold will not be satisfied and any bullish reversal scenario will be negated.
The bearish reversal tested
It is also worth considering the opposite scenario whereby an up trend into the Sun-Jupiter conjunction marks an interim top and stocks decline thereafter. This is arguably the commonly held view by most financial astrologers since the most positive part of the conjunction is believed to occur in the days leading up to the exact zero degree alignment. As the Sun separates from Jupiter afterwards, positive outcomes are said to become less likely.
However, the data doesn’t show a strong bearish reversal effect. To be sure, there is a marked reduction in bullishness although this could be partially explained by normal mean reversion. Taking the longest 60-day window (“-30d 30d”) in which prices rose by more than 1% in the preceding 30 days, the average gain was 3.99% across 32 cases. However, the reversal effects were small as the average gain after the exact conjunction was still positive at 0.99% with 53% of cases producing a positive result. Clearly, this cannot be considered a bearish reversal by any stretch of the imagination. That said, we may still note the probability that up trends are more likely to weaken in the days following the conjunction.
And we should note that it is unclear if this up trend weakness/bearish reversal scenario will apply to our current circumstance. Measured from June 24, the 30 day interval begins on May 25. However, this was a weekend, so we can take either the closing prices for May 23 or May 27. The close on May 27 was 42,343. If stocks happen to rise to 42,766 or above (42343 + 1%) by Tuesday, June 24, then our study would apply with only a 53% chance of gains in the subsequent 30 days (to July 23).
The 40-day and 20-day windows showed similar results. The 10-day window (“-5d 5d”) was perhaps the best representative of this bearish reversal hypothesis with an average of -0.26% and only 44% of the 18 cases being positive. This bearish reversal scenario will be in effect if we see some upside in the early week such that the DJIA closes above 42,592 (the June 18 close is 5 days before conjunction = 42,171 + 1%).
Conclusions
Regardless of how the market trades on Monday and Tuesday, the effect is of this Sun-Jupiter conjunction is quite small either way. But this data suggests that if stocks move lower early in the week, there is a slight chance for a reversal higher in subsequent days. That said, the overall effect across all 60 cases of the Sun-Jupiter conjunction for the 10-day window is slightly bearish, all things being equal. Indeed, if stocks rise on Monday and Tuesday, then the probability for a decline in subsequent days increases given the bearish tendencies of both the large 60-case batch and the smaller 18-case batch in the days following the exact conjunction date.
These seemingly contradictory indications highlight the limited impact of this alignment. In any event, this investigation suggests that the conventional bullish view of this conjunction is not strongly supported by the evidence. There is a very modest bullish effect in the longer 60-day and 40-day time windows, but this effect disappears in the 5 days before and after the exact conjunction.
And as noted previously, other alignments such as the double square of Jupiter-Saturn and Jupiter-Neptune are likely to exert a greater influence. In both cases, the evidence suggests stocks are more likely to decline in late June and early July. Similarly, the minor progressed alignment of the Sun and Saturn in the NYSE horoscope also argues for further downside in the near term.
