

 (5 July 2025) US stocks closed at new all-time highs this week with the successful passing of Trump’s massive budget bill. The powerful rebound since April’s tariff lows has caught many investors off-guard who were convinced they were witnessing a transitory bear market rally. Over time, their initial skepticism has morphed into a latecomer FOMO trade which has seen stocks push above their February highs.
Sentiment has decisively shifted as markets are now acknowledging the financial tailwinds from Trump’s lower taxes and scaled-back tariff regime which could take equities higher into next year. At the same time, stock prices are overbought by some measures and may be ripe for some kind of consolidation and pullback in the short term.
Astrologically, we have yet to see any of the negative impact from the aftermath of the double Jupiter square in June. However, the absence of any meaningful pullback is not all that surprising given the fairly modest bearish effects from previous Jupiter-Saturn and Jupiter-Neptune squares.
Heliocentric Venus-0-Saturn
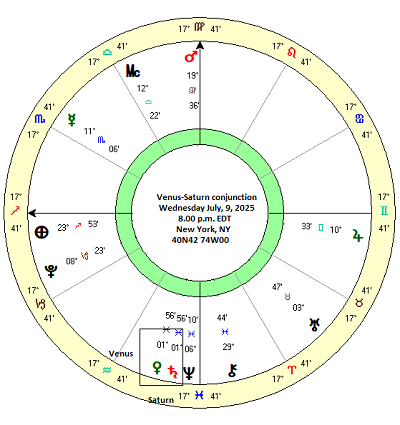
Looking ahead to next week, we note a Venus-Saturn conjunction occurring on Wednesday evening, July 9 in the heliocentric chart. Heliocentric alignments use planetary positions as seen from the Sun rather than the usual geocentric positions as reckoned from our vantage point here on Earth. While less studied than geocentric placements, heliocentric alignments offer an new opportunity to study the relationship between planetary positions and human behavior.
Based on conventional geocentric ideas, one would think that the Venus-Saturn conjunction would be negative for sentiment since Saturn is a bearish planet. However, it is an open question whether the geocentric planetary characteristics are directly applicable to the heliocentric system. This limited study will attempt to address that question.
The heliocentric conjunction of Venus and Saturn occurs about once every 8 months. In this study, I analyzed every Venus-Saturn conjunction from 2000 to 2024. This yielded a dataset of 40 cases. Due to the relatively fast velocity of Venus (1.6 degrees per day), I recorded the closing prices of the Dow Jones Industrial Average at 10 days before the conjunction, 8 days before, 6 days before and so on. The resulting table of 11 price intervals was then used to measure the comparative effect before and after the conjunction (“0d”).
Results
The results are mixed. The first column on the left side of the table (“-10d 10d”) shows the price change across a 20-day window that straddles the conjunction. This produced a positive average outcome of 0.93% which was three times the expected result of 0.32% based on a 6% average annual return for the period of 2000-2024. Could it be that the Venus-Saturn conjunction is actually bullish? While the data is highly skewed as seen in the 3.74% standard deviation, even the more reliable median figure of 0.77% is higher than the expected value. Since medians tend to better represent the typical outcome than the average in widely distributed data, this is more evidence that this period may have a modest bullish bias.
But a closer look at the data shows an interesting difference between the period before the conjunction and after the conjunction. The second column on the left (“-10d 0d”) displays the outcome of the 10-day period leading up to the conjunction. It is slightly negative at -0.13%, although the average is still positive at 0.24%. But the 10-day period after the conjunction are more positive as the average is 0.69% and the median is 0.86%.
This difference is repeated in the smaller intervals with the period leading up to the conjunction being bearish and the period afterwards being bullish. The 8-day and 6-day period leading up to the conjunction are more strongly bearish with medians of -0.42% and -0.30%, respectively. For both intervals, the matching period after the conjunction was positive. The most bearish window was the 8-day window (“-4d 4d”) which was -0.39% and which followed the pattern of being more bearish before the conjunction.
A conjunction pivot? The bearish reversal
Given the difference in the before and after markets effects, it is worthwhile to investigate if there is any evidence to support the notion that the conjunction could bring a reversal in the prevailing trend. While there is some evidence of both bullish and bearish reversals, the effects are small. Taking the bearish reversal hypothesis first since it may apply to this week upcoming after last week’s rally, I included conjunctions which rose more than 1% in the preceding 10-day interval. This produced an average gain of 3.25% and median gain of 2.72% for the 11 cases included in the sample. If the pivot effect was strong, we would expect to see strongly negative numbers in the 10 days that followed. However, only the median showed a paltry negative result of -0.17% while the average was still positive at 0.28%. However, only 5 of the 11 cases were positive. So while the aftermath of the conjunction was decidedly weaker than the lead up, it was not robustly bearish. Nonetheless, it does argue for at least a diminishing of bullish energy in the period after the exact conjunction. In other words, it is not a reason to go short but maybe to just trim long positions.
The bullish reversal
For the bullish reversal, I only included cases that saw a decline of more than 1% in the 10 days preceding the conjunction. This produced an average and median decline of about 2% across 11 cases. This reversal effect was stronger as 9 of the 11 cases were positive and had an average gain of 1.53% and a median gain of 1.32%. While this reversal effect was stronger than the bearish reversal scenario, we should keep in mind that the market defaults to positive outcomes anyway. For any random 20-day period, the market is positive about 57% of the time. But the cases reviewed here were 81% positive and thus there is some limited evidence for a bullish reversal effect. In other words, if stocks have been falling ahead of the heliocentric Venus-Saturn conjunction, there is some reason to cover shorts and go long. Obviously, given these tiny samples and small effect sizes, this is certainly not a reliable trading strategy.
Conclusions
The market effects of the heliocentric Venus-Saturn conjunction are very much a mixed bag. Somewhat surprisingly, it actually has a modest bullish effect across the longer 20-day interval. However, this analysis suggests there is a small bearish bias in the days leading up to the conjunction, with gains becoming more likely in the days afterwards. Whether or not this information will be relevant next week and the July 9 conjunction remains to be seen, however. But it does slightly increase the probability of some downside risk on Monday, Tuesday and Wednesday.
