

 (31 August 2025) Markets ended the week mostly unchanged as Nvidia earnings came in more or less in line with expectations. Despite relatively weak seasonality, the month of August was positive as the near-vertical rally prepares to enter its fifth month following April’s panic low.
The bull market’s wall of worry may become steeper in September, however, as investors are back from holidays and trading volumes return to normal. In last week’s post, I investigated whether the upcoming eclipse period (September 7-21) might coincide with a rise in volatility. Based on an analysis of previous eclipses from 2000 to 2025, the downside potential looked quite modest as most eclipses are simply not bearish in their effects. The total lunar eclipse is a noteworthy exception, however, as our study suggested below-average returns for a 10-day period after the eclipse. A total lunar eclipse will occur September 7.
Another factor deserves special mention is the role of any additional planets in the overall eclipse configuration. Does it change market outcomes if an eclipse is aligned with a planet like Mars, Jupiter or Saturn? This scenario is worth considering since Saturn will be almost exactly opposite the solar eclipse on September 21. Since Saturn is a malefic planet, deductive reasoning would suggest worse market performance around the time of an eclipse. But does the evidence support this view?
Solar eclipse opposite Saturn
As it happens, this Saturn + solar eclipse combination is quite rare. Using a tight orb of 5 degrees or less, Saturn has only been opposite a solar eclipse three times in the past 120 years: June 9, 1899, March 27, 1922, and February 26, 1979. .In two of the three alignments (1922, 1979), stocks fell 2-4% in the 10 days preceding the eclipse and then rebounded higher thereafter. In both alignments, stocks made their lows within 2-3 days of the eclipse. By contrast, stocks in the 1899 solar eclipse were mostly flat both before and after the eclipse.
Obviously, three cases isn’t enough to make for any kind of confident prediction about what will happen around September 21. But it provides some anecdotal evidence that the Saturn influence can make eclipses somewhat more bearish than they otherwise would be.
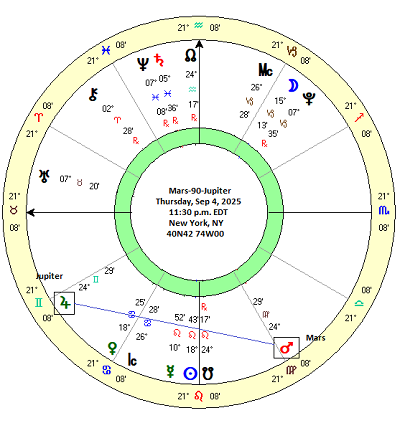
Week of September 1: Mars square Jupiter
Turning our attention to this week, one alignment worth watching is the 90-degree square aspect of Mars and Jupiter. On Thursday, September 4, Mars will complete its first 90 degree alignment from Jupiter during its two-plus year synodic cycle. Astrologers believe that the square aspect is often significant as the combined energies of two planets are more likely to manifest in some way.
There are some varying views about the effects of the Mars-Jupiter combination, however. Many financial astrologers take a mostly negative view since Mars is a natural malefic and the square aspect is regarded as generally tense. I have some affinity with this view. And yet, any Mars-Jupiter combination can also symbolize impulse buying as the impetuous side of Mars can produce sudden actions which articulate with the confident nature of Jupiter. It is therefore also conceivable that stock prices could rise with this pairing. Nonetheless, the square aspect is often seen as more problematic than the conjunction or the trine.
Results
To address this question, I compiled a dataset of 57 previous Mars-Jupiter squares between 1970 and 2024. (See table below) I included both the 90 degree and 270 degree squares. In order to determine how this alignment might correlate with stock prices, I recorded the closing price of the S&P 500 across 15 intervals in 3-day increments. The first recorded price was 21 days before the exact square, which corresponded to an approximately 10 degree orb. While this was somewhat wider than the usual 5-7 degree orb for the square aspect, it was a good starting point from which to track any potential effect on price. I then recorded prices until 21 days after the exact square thus creating a balanced time window of 42 days.
The second table shows the percentage change in prices across various intervals. The first column (“-21d 21d”) is the longest 42-day window. The second column is the price change from 21 days before the square until the day of the exact square (“-21d 0d”). The third column is the change in prices from the day of the exact square until 21 days afterwards (“0d 21d”). This division of the window into before and after intervals tests the widely held assumption that aspects manifest more strongly in the days that precede the exact alignment. Other columns show price changes across shorter intervals to see if there an effect occurs closer to the time of the exact alignment.
As the chart shows, there is very little effect from the Mars-Jupiter square. The summary statistics (on page 3 of the table) are quite unremarkable as none ever reached statistical significance using the standard p = 0.05 threshold, although a couple of intervals come close. Interestingly, the ones that approach significance are actually bullish and suggest this alignment is positive in its effects across the longer time windows. As a baseline, the benchmark expected value was calculated using an 8.1% average annual return for the period of 1970 to 2024.
Tracking the effects of the Mars-Jupiter square
From another perspective, we can also track the effect of the alignment across time. The chart below tracks the cumulative price change from the start of the period (-21d) through to the exact square (0d) and then as the square separates 21 days afterwards. The resulting chart shows the average and median lines follow the rising expected value line fairly closely, although they begin to separate from it towards the latter intervals as the bullish effects become more manifest.
Disaggregation: Mars-90-Jupiter
I also checked to see if there was a difference between the 90 degree squares and the 270 degree squares since this week’s Mars-Jupiter square is a 90-degree alignment. While it is possible that the 90 degree squares were somewhat more bullish than the 270 degree square, there really wasn’t much difference. The averages in both charts were both generally above the expected line, although the average in the 90 degree chart was somewhat higher. The 42-day average change was 2.43% for the 90 degree squares compared with 1.72% for both the 90 and 270 degree squares. Not a big difference. Both were well above the expected value of 0.93%.
Conclusion and implications for this week
This study suggests that the Mars-Jupiter square isn’t bearish on average and may, in fact, be somewhat bullish. Since none of the results achieved statistical significance, we should be extra cautious about making any inferences, however. Nonetheless, Thursday’s Mars-Jupiter alignment at least keeps the bullish scenario alive this week, even if it doesn’t provide solid evidence for it. The very limited effects of this alignment suggests we should keep an open mind about stocks this week.
An additional caveat is that the bullish effects become stronger across longer time windows, such as 36, 39 or 42 days. Given the exact square date of September 4, the first data point (“-21d”) equates to Aug 14 while the last data point (“21d”) corresponds with September 25. Therefore, even if there is some near-term downside, the bullish influence of the Mars-Jupiter square could still emerge somewhat later, such as after the eclipse period.
