

 (26 October 2025) US stocks reached new all-time highs last week as the latest round of inflation data was within consensus expectations. The current CPI number more or less assures a Fed rate cut at the FOMC meeting this Wednesday. Bitcoin also rallied although gold and silver sold off sharply as the parabolic precious metals rally finally took a breather.
The upside was not too surprising in light of the rare double Grand Trine alignments discussed last week. While the early week Mercury-Mars conjunction failed to deliver on its modest downside potential, the gains came as the historically bullish Mercury-Jupiter-Saturn alignment approached its closest aspect. The somewhat less bullish Mars-Jupiter-Saturn Grand Trine will form its closest alignment this Tuesday and Wednesday just in time for the FOMC meeting.
Based on our study from last week, the Mercury-Jupiter-Saturn Grand Trine tends to have bullish after effects that can last 30 days or more after its closest alignment. While the Mars-Jupiter-Saturn Grand Trine is more neutral in its after effects, the combined effects of these alignments nonetheless raises the possibility that the current rally could extend well into November.
Jupiter-120-Saturn
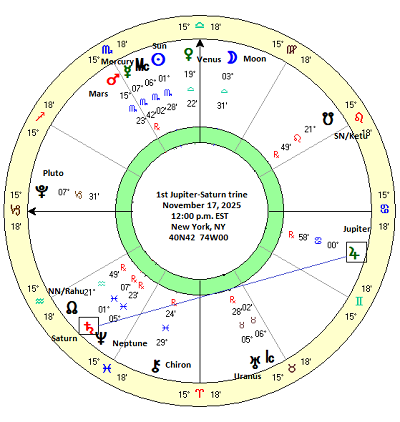
But these triangular alignments invite further analysis to its more essential aspect, namely the Jupiter-Saturn trine. The 120-degree angle between Jupiter and Saturn has been slowly forming over the past several weeks and will reach near-exact on November 17. At that time, the Jupiter-Saturn trine aspect will be just 9 minutes of arc away from forming an exact 120-degree angle. After Nov 17, the trine aspect will begin to separate although it will remain close well into December.
Aspects involving Jupiter and Saturn deserve special attention since these planets symbolize opposite ends of the sentiment spectrum. As the planet of optimism and expansion, astrologers believe that Jupiter aspects tend to coincide with bullish market moves. By contrast, Saturn is seen as the most bearish planet whereby its alignments are associated with negative sentiment and declines in the stock market.
But what happens when they aspect each other? This is a question with no clear consensus among financial astrologers. Jupiter-Saturn aspects can sometimes be seen as basically constructive as Saturn’s penchant for limits can create a kind of measured expansion. But other times Saturn can take the dominant role and end up dampening Jupiter’s optimism and enthusiasm for the future.
Another element is the size of the angle of the aspect itself. “Hard” aspects like the 90-degree square and the 180-degree opposition are usually seen as more bearish whereas the soft aspects like the 60-degree sextile and 120-degree trine may have a more bullish reputation. And yet the crashes of 1987 and 2008 both took place against a backdrop of Jupiter-Saturn trines. This is not to say that the alignment was exact at the time of the largest declines, however. But Jupiter and Saturn did form a series of trine aspects throughout 1987 and 1988 and again in 2007 and 2008 which may have partially formed the underlining astrological signature which facilitated the sell-offs.
It is important to note that the Jupiter-Saturn trine aspect occurs in clusters. Due to the retrograde cycles of both Jupiter and Saturn, an initial trine aspect is only the first in a series of trine aspects that can extend over a 10 to 20-month period depending on length of their retrograde cycles. Typically, Jupiter and Saturn form three trine aspects before moving on, although they can also form a series or four or even five trines over the longer 20-month period as was the case in 2007-2008.
But even if the Jupiter-Saturn trine broadly has previously coincided with some nasty market outcomes, there were many occasions when the market rose during its 120-degree and 240-degree alignments. Given the range of possible outcomes, it makes sense to undertake a more systematic study of previous the market effects of trine aspects in order to gain a better understanding of the actual probabilities. Only by analyzing previous historical evidence can we make accurate assessment of current market probabilities.
Method
To answer that question, I compiled a dataset of the 43 Jupiter-Saturn trines that have occurred from 1906 to 2014. Using the Trading View data of the Dow Jones Industrial Average, closing prices were recorded at five-day intervals before and after the exact trine aspect. Somewhat arbitrarily, the first price was recorded 30 days before the trine aspect and the last price 30 days after. This roughly approximates an 8° maximum orb when Jupiter is traveling at its fastest speed and Saturn is retrograde. When Jupiter is moving more slowly, this will cover a smaller aspect orb over the 60-day window. The table below shows the closing DJIA prices across all the intervals. It also shows the direction of Jupiter and Saturn at the time of the aspect (D = direct; R = retrograde) as well as the specific numbered aspect in the series. The table also indicates if the trine aspect is 120 degrees (counterclockwise) or 240 degrees. Both the 120 and 240 degree aspects are known as “trine” aspects although it is worth testing them separately to see if they may produce different outcomes.
Results
The summary statistics table below provides an overview of the results. The first column on the left (“-30d 30d”) shows the average and median price changes across the entire 60-day window starting at 30 days prior to the aspect to 30 days after. The 43 cases produced an average rise of 0.62% against an expected value of 0.81% based on an average annual return of 4.9% for the years 1906-2014. If the average result is a bit below the expected value, the median result (1.52%) is above the expected value. This lack of confirmation between the average and median suggests a neutral effect of the trine aspect across the 60-day window.
The second column (“-30d 0d”) measures the price change in the 30 days leading up to the exact trine. This was slightly negative for both the average (-0.19%) and median (-0.09%) compared with the expected value of 0.40%. However, this result was not significant using the 95% threshold of p<0.05. But the third column (“0d 30d”) shows the price change in the 30 days after the trine aspect and it is more positive, as the average was 0.80% and the median was 1.66%. Here again, however, the results were nowhere near significant.
In fact, none of the results reached statistical significance. However, we can note that the above pattern was repeated in other intervals as negative outcomes tended to occur before the aspect while the period after the aspect tended to be more positive. While interesting, this ‘bearish before’ effect was quite weak and was not strong enough to be seriously considered as a reliably predictive factor. This is also shown in the cumulative price tracking chart below. The left-hand side of the chart is more bearish whereas the right-hand side after the 0d midpoint is more bullish.
Disaggregation 1: Jupiter-120-Saturn only
But what happens if we separate the cases into smaller batches? Since the upcoming Jupiter-Saturn trine on November 17 is a 120-degree aspect, it is worth investigating whether there are different effects specific to the 120 aspect compared with the 240 degree aspect. Therefore, I compiled a batch of 22 cases of trine aspects in which Jupiter was 120 degrees away from Saturn by standard counterclockwise reckoning. The cumulative trend chart below suggests a quite mixed effect. While the average and median lines are choppy and move above and below the straight, upward-sloping expected line, the overall impression seems fairly neutral. Perhaps this batch of 120-degree aspects is slightly more bearish than the undifferentiated trine chart above, but the difference is relatively minor.
>Disaggregation 2: 1st Jupiter-Saturn trine only
As noted above, one of the unique characteristics of Jupiter-Saturn aspects is that there are multiple instances of the aspect over a period of time. Since both planets have multi-month periods of retrograde motion, an initial trine aspect is repeated several times over a 10-20 month period. Thus, the trine aspects appear in clusters of 3,4 or 5 over an extended period of time. The upcoming Jupiter-Saturn trine will be the first such aspect since 2014. As such, it will be the first in a series of aspects that will extend into 2026 and 2027. It is therefore worth analyzing the specific effects of the first Jupiter-Saturn trine as opposed to any of the others. For analytical purposes, this batch included both 120 and 240 degree aspects.
The summary statistics table below shows that there indeed is a stronger effect here. In fact, the 30-day interval before the aspect (second column: “-30d 0d”) reached statistical significance (p = 0.022) as both the average and median were well below the expected values. Other intervals were also negative although less so as none reached significance. Moreover, the period after the trine aspect was more bullish as two intervals almost reached significance (denoted by the No* with an asterisk) including the 15 days after the alignment (“0d 15d”) and the 10 days after the alignment (“0d 10d”).
This bearish-before/bullish-after pattern is more clearly shown in the cumulative trend tracking chart below. Average declines exceeded -2% in the intervals leading up to the exact trine. The low points for both the average and medians occur during the 10 days leading up to the exact 120-degree alignment.
Interestingly, more of these cumulative results reach statistical significance as the summary statistics table below shows. Nonetheless, 9 out of a total of 12 cases were negative at the “-5d” and “-10d” points before the exact trine. Despite the clear bearish tendency in this “first trine” batch, declines are by no means a certainty.
Disaggregation 3: 1st Jupiter-Saturn trine only AND 120-degree trine only
Narrowing down the sample further, I was curious to see the effect of taking the 1st trine only and the 120-degree trine only. This more closely approximates the upcoming alignment as it will be the first in a series of trines and it will form a 120-degree trine aspect. Unfortunately, the resulting batch is tiny — just 6 cases. Nonetheless, the chart is very bearish. Actually, it is more bearish than the n=12 combined first trine chart as the day of the exact trine (“0d”) has an average of -3.42% and a median of -4.15%, which is more negative than the n=12 combined first trine batch above. 5 of the 6 cases were negative at 5 days before the aspect (“-5d”), and at 0 days (“0d”). This is a stronger bearish bias for this combination of parameters.
Disaggregation 4: 1st Jupiter-Saturn trine only and Saturn retrograde
It’s also possible to consider the effect of planetary direction. On November 17, both Jupiter and Saturn will be retrograde. This doesn’t always happen with Jupiter-Saturn trine aspect and thus is worthy of further examination. For its part, Jupiter will have only turned retrograde on November 11, while Saturn has been retrograde since July. Therefore, for part of the applying phase of the aspect, Jupiter will actually have been in normal direct motion. In order to bracket Jupiter’s changing direction, I isolated those cases in which Saturn was retrograde during the first Jupiter-Saturn trine in the series. These conditions produced a sample of just 6 cases. The chart of the cumulative price trend is shown below. Basically, it is a reiteration of the prevailing theme with the 1st trine. It’s bearish during the lead-in to the exact aspect and then becomes more bullish.
Conclusions
While the sample sizes are very small, there is some evidence here for a bearish bias in this 120-degree Jupiter-Saturn alignment. The fact that some of the measured intervals actually reach statistical significance despite the small sample size is especially noteworthy. But does this mean that stocks will decline in November around the time of the aspect? It’s certainly possible although we should be cautious about inferring too much from such a limited dataset. Nonetheless, the time leading up to the November 17 aspect would seem to be more vulnerable to declines than the period afterwards.
Another thing worth considering is that the November 17 trine is not quite exact. While very close, it falls 9 minutes of arc short of exact. Will it make a difference to the results? It’s hard to say. I noted three other near exact trines in the closing price table (labeled “nr exact”), including two which were first trines in their respective series. One followed the bearish script (11 Sep 1953) while the other (26 Dec 1992) was more neutral. Nonetheless, the November 17 alignment is so close that I think it makes sense to treat it the same as the other cases.
Implications for this week
Since the Jupiter-Saturn trine will be within range for the whole month of November, it is not immediately clear what effect, if any, it will have on markets this week. While we have now entered the active 30-day window that precedes the closest alignment on Nov 17, this doesn’t necessarily mean that stocks will decline this week. And yet with the FOMC meeting this Wednesday Oct 29, it is tempting to consider the possibility of a trend change after that date. FOMC meetings can be market movers as the ‘sell the news’ dynamic often kicks in in the days after the interest rate decision.
Whatever happens this week, evidence suggests the first Jupiter-Saturn trine will increase downside risk over the next few weeks.
If you would like to receive these weekly posts as emails, you may subscribe to my free Empirical Astrology newsletter on Substack.
Disclaimer: Not intended as investment advice. For educational purposes only.
