

 (22 February 2026) US stocks ended the week higher as markets rallied after Friday’s Supreme Court decision struck down Trump’s tariff policy. Even with the prospect of an imminent US attack on Iran, stocks are hovering just below their recent highs.
The bullish outcome was not hugely surprising given the positive influence of the recent Saturn ingress into Aries, the conjunction of Mercury and the North Lunar Node, and the approaching Saturn-Neptune conjunction. Our backtest of these three alignments showed a bullish bias, albeit with limited confidence. At the same time, the presence of some bearish influences made a bullish outcome far from certain last week given the Jupiter-105-Saturn alignment and the Mercury Rx-Venus conjunction.
The potentially negative influence of these two alignment were discussed in last Wednesday’s post. Our study of the “hidden” Jupiter-Saturn alignment of 105 degrees (exact Feb 19) showed it has a bearish bias, especially during its second of three total transits in its alignment. Due to the retrograde motions of both planets, Jupiter-Saturn alignments typically have three exact alignments in each transit series. Our research suggests that the second of these alignments is more bearish than the other two. However, we should quickly add that none of the intervals tested reached statistical significance, in large part due to the small sample size (n=6). The updated cumulative trend chart is found below.
The progress of the current alignment is seen in the red line. After peaking last week, it may well be trending lower and thus following the average and median lines lower. This alignment appears to coincide with a high in stocks and then turns lower as it separates. If that happens here, then stocks would likely move lower this week upcoming. The average and median in the chart diverges after 10 days (“10d”) which would equate to March 1. The median then turns higher while the average falls even further. The small number of cases argues against putting much faith in either line but it nonetheless highlights the possibility of some down days over the next 10-15 days.
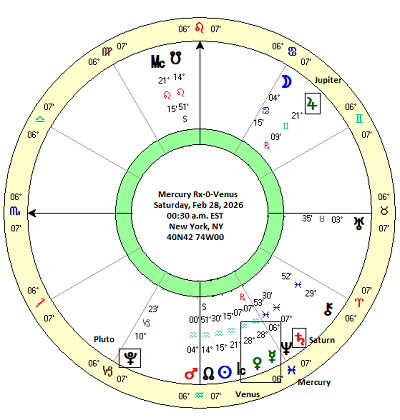
Mercury Rx-0-Venus
Another potentially bearish alignment this week is the conjunction of Mercury and Venus on Saturday, February 28. This conjunction will occur two days after Mercury turns retrograde on Thursday, February 26 at 1:47 a.m EST. While many astrologers believe that Mercury retrograde is bearish, my previous study suggests that it barely moves the needle with a decline of just -0.20% during the 8-day approach to the retrograde station. It may also be slightly bearish across other intervals but the results did not reach statistical significance despite a large sample size of n=141. Therefore, it may not by itself be a reliable indicator of market weakness. A more useful alignment in this respect is the conjunction of retrograde Mercury with Venus.
I conducted a backtest study of Mercury Rx-0-Venus last year and found that it was less bullish than one would have expected since both are considered benefic planets. Specifically, I discovered that besides the planets themselves, what mattered more was the direction each planet was traveling. If both planets were moving forward, there was a mildly positive correlation with stock prices. But if Mercury is retrograde (Rx), then the picture changes. Mercury Rx-Venus conjunctions are actually somewhat bearish during the approach to the conjunction. The summary statistics table below shows a bearish bias across several intervals. The first column shows the price change for a 30-day window that begins 15 days before the conjunction and ends 15 days after. The average decline was just 0.24% for 19 cases and did not come anywhere near the 0.05 significance threshold. Moreover, the median was actually quite positive (0.98%) and suggests this long 30-day window is quite mixed and has no clear bias.
A more distinct picture emerges when we examine the shorter intervals. The second column shows the 15-day approach to the conjunction (“-15d 0d”) and it had an average decline of -1.35%. Here the median largely agrees and posted a negative return of -1.09%. However, this result failed to reach statistical significance (p = 0.104) although it came fairly close. A p-value of 0.104 means there is a 90% probability (1 – 0.104) *100) that the result is not due to chance. (N.B. In my initial study, I calculated a much lower p-value of 0.003 indicating statistical significance. This was mistakenly based on a larger sample size. This error has been corrected in the table).
Interestingly, the 15-day interval after the conjunction (“0d 15d”) was mostly bullish with an average return to 1.16%. This compares favorably to the benchmark of 0.23% for that interval based on a average annual return of 5.4% for the S&P 500 for 2000-2024. However, this result also fell short of reaching significance with a p-value of 0.174. Perhaps a larger sample might have generated more statistically significant results.
The effect seems to peter out for shorter time intervals although the pattern of “bearish before/bullish after” is still evident. The fact that the effect is strongest across longer time intervals reinforces the notion that this conjunction is a fairly modest influence.
The updated cumulative trend chart below shows how previous Mercury Rx-Venus conjunctions exhibit a distinct bearish bias up to the day of the exact conjunction. Stock prices generally recovered soon after the conjunction. This chart clearly demonstrate the “bearish before/bullish after” scenario. So far, the current alignment (red line) is tracking well above any historical trend which may indicate a break with the past. However, a mean reversion down to the benchmark line at least also seems more likely going forward. This would be an argument for some downside this week and perhaps even into next week.
One possible implication from this study is that other conjunctions with Mercury retrograde could also be bearish. If stocks are bearish around the time that Mercury Rx conjoins Venus, what happens when Mercury Rx conjoins the Sun? This happens during every Mercury retrograde cycle although the close conjunction is very brief and only lasts for a day or two by standard reckoning. Retrograde Mercury is due to conjoin the Sun on March 7. I hope to perform a backtest of the Mercury Rx-Sun conjunction for next week.
Implications for this week
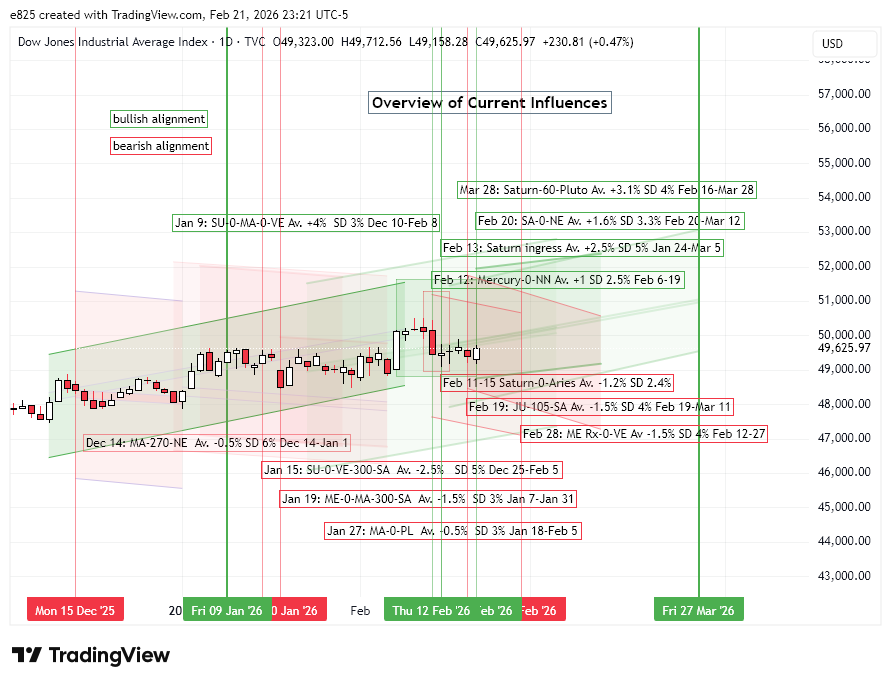
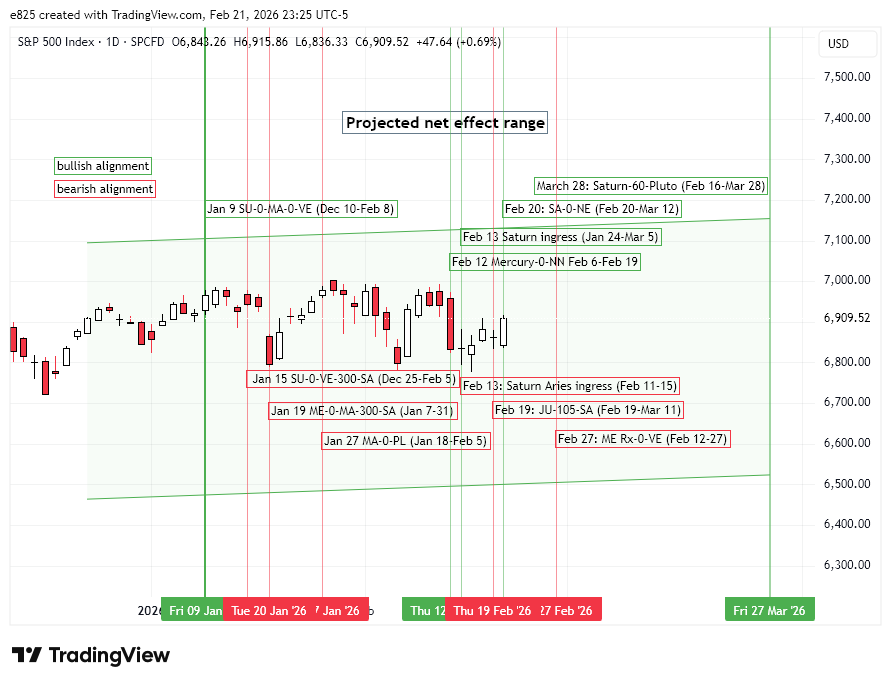
If the Feb 28 Mercury Rx-Venus conjunction is bearish, does this mean this week will be bearish too? Not necessarily. There are several active offsetting alignments in play here including the newly-minted Saturn ingress into tropical Aries (Feb 13), the Saturn-Neptune conjunction (Feb 20) and the approaching Saturn-Pluto alignment (Mar 27-28). All three of these are less immediate influences, however, and may be pushed to the sidelines in the event of a short term bearish impulse. The Mercury Rx-Venus conjunction is one such influence, and evidence suggests the Jupiter-105-Saturn alignment is another potentially bearish influence. These two negative alignments could be sufficient to undermine confidence, at least in the short term. Therefore, there is an elevated downside risk this week as reflected into the downward sloping pink areas that are associated with these alignments in the annotated DJIA and SPX price charts.
I hope to post my detailed analysis of the 60-degree Saturn-Pluto alignment (March 27-28) later this week. This alignment has yielded fairly strong bullish results in backtesting although the sample size is fairly small at just 19 cases. Expanding the sample to include 120-degree “trine” aspects is one way to improve data reliability although time constraints may require leaving that for later.
Disclaimer: Not intended as investment advice. For educational purposes only.
