- Probable significant decline early to midweek with some recovery later
- Dollar to rise towards 80
- Gold may sell off sharply, perhaps towards $910 with some bounce later
- Crude likely headed towards $68-70
- Probable significant decline early to midweek with some recovery later
- Dollar to rise towards 80
- Gold may sell off sharply, perhaps towards $910 with some bounce later
- Crude likely headed towards $68-70
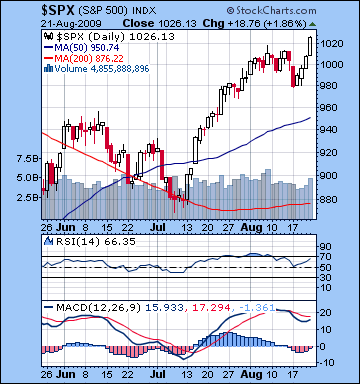 Markets pushed to a new high for 2009 last week as stocks in New York rose 2% on positive housing data. With the Dow bouncing off its early week lows near 9100, it closed at 9505, significantly above last week’s 9400 level, while the S&P ended the week at 1026, eclipsing the 1018 intraday high of August 13. While I was largely correct in my prediction for Monday’s decline on the Mercury-Jupiter-Saturn pattern, the extent of the rebound was somewhat surprising. Actually, the size of Monday’s pullback was smaller than I had thought, just 2% instead of 3-5%, and that was an indicator that the week was going to be more bullish. I also predicted the rise later in the week, especially Wednesday and Thursday and I was not far off. Again, my essential error was in underestimating the amount of bullish energy available for the market. I also mistakenly thought Friday might be lower, although in retrospect, the Venus-Uranus-Neptune aspect had more than enough fuel to offset any negativity in the Moon-Saturn conjunction.
Last week I thought it could be conceivable (but not probable) we could challenge previous highs and the market did, in fact, do that. The failure of any major pullback early on and the strength of the late week rally are good indications that there is still enough positive energy to drive a significant rally. This does not necessarily mean the market can move higher here, but it does mean it has positive resources to draw upon and rebound strongly after any correction. But have we hit the top now? Last week, I was inclining towards a "yes" answer to that question, and this week I’m more or less of the same opinion, albeit from a vantage point that is 2% higher than before. Technically, the market still seems mixed. While new highs are always bullish, it was not confirmed with higher volume. Although the up days at the end of the week were higher volume, the week’s volume overall was less than the previous week. MACD remains negative although the moving averages are now rising and the RSI is approaching overbought territory in the upper 60s. With a significant decline looming this week, we will likely see another rally attempt next week around Labor Day that will likely retest Friday’s highs. At this point, I don’t think that rally won’t make new highs, but it is still a conceivable outcome. For investors who are shorting this rally ahead of the probable decline in September and October, it may be prudent to keep some cash on hand just in case we do move higher in early September.
This week looks very negative as there is a four-planet alignment of Mercury-Mars-Pluto-Rahu that will likely determine market direction. This is an extremely bearish pattern that has the capacity to take markets down perhaps 5-10% over a two-day period. Now whether or not it actually delivers that kind of bearishness will be a helpful clue in determining if the market can make a new high in early September or not. If we only pullback 2-4% (like last week), then that may indicate that a subsequent rally will be strong enough to move the market higher the following week. However, if it takes the market down more than that, it will make any September rally less likely to succeed. While it’s possible that Monday starts higher, I think the decline may well begin in earnest by the afternoon. That is when the Moon at 5 degrees of Libra will move into an alignment with the aforementioned planets. Mercury (5 Virgo) and Mars (5 Gemini) will be close enough to spark some selling, even if they are still more than one degree out of sync with Pluto (6 Sagittarius). Tuesday and Wednesday look very negative as those aspects will tighten, while Venus conjoins Ketu. Although Venus can be a bullish influence, it’s not clear that it can exert much power to change the probable bearish outcome. Some kind of bounce is likely Thursday and Friday (especially in the morning) as Venus will replace both Pluto and Rahu in that four-planet alignment and will tend to encourage buyers to move in. Overall, the week should be negative, with a probable retesting of last week’s lows (9100/980) at some point, with Friday being somewhat higher than those levels.
 Next week (Aug 31-Sep 4) will be a critical time in the market as bulls will test their mettle and see if they can conjure a new high. I believe some kind of rally is very likely in this week, despite the continuation of the bearish Mercury-Mars square. Last week I had suggested that this would be a down week but I’m reversing that call here because I think the minor aspect from Jupiter will be enough to invert the bearish energy into gains for at least two trading days, probably on Tuesday and Wednesday, Sept 1 and 2. This could produce a major 3-5% gain, although some selling is likely by Friday. Again, whether or not this rally will be enough to make a new high will depend in large part on the extent of this week’s correction. With the Labor Day holiday on Monday September 7, the following week looks mixed with weakness on Tuesday followed by a good chance for gains Wednesday and Thursday on the Sun-Venus-Jupiter aspect. Friday looks very bearish, however. After that, investors need to brace themselves for a greater likelihood of more serious declines as we move into mid-September and October and the nasty Saturn-Uranus-Neptune alignment is followed by the Saturn-Rahu aspect. Sept 14-18 looks very negative, as does Sept 21-25. October 7-15 is shaping up as another major decline, possibly a capitulation. After some kind of relief rally in the second half of October, mid-November also looks quite negative so that isa time of another possible significant low. It’s hard to guesstimate levels but 7500/800 still seems to be a plausible downside target by October-November. Much will depend on how bearish Sept 14-18 turns out to be on the Saturn-Uranus-Neptune aspect. This has the potential to take the market down more than 10% in a week, so if we break below 8200/880 then, it will be a sign that we’re going lower than our targets. If not, then this general retracement move will be more modest. I will try to offer additional thoughts on price targets as we move through some of these important aspect configurations.
5-day outlook — bearish
30-day outlook — bearish
90-day outlook — bearish
1-year outlook — bearish
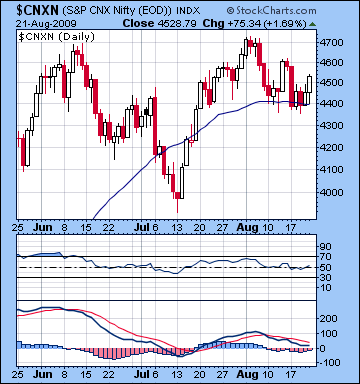 Stocks in Mumbai lost almost 2% last week as improved US economic prospects weren’t enough to offset worries over the Chinese recovery. After Monday’s steep selloff that saw the Nifty close below 4400 on two different days, it rebounded Friday and closed at 4528 while the Sensex finished at 15,240. I was mostly correct in my forecast for lower prices on the early week bearishness contained in Monday’s Mercury-Saturn conjunction. My forecast for a large move (>3%) was also on the mark as stocks dropped almost 5% right on cue with this aspect before bouncing back Tuesday on the Sun-Mars aspect. Wednesday’s weakness was somewhat at odds with expectations, as Saturn’s influence on Venus trumped a parallel aspect from Jupiter. The late week gains coincided nicely with the Mercury-Venus-Uranus alignment as outlined in last week’s newsletter. The best day of the week was Friday as the Venus-Uranus aspect brought more buyers into the market.
I had speculated that 4400 was a key support level here but despite two closes very near to that level, the bulls came back and bid up prices strongly by Friday. While bulls can take some hope from the defense of 4400 last week, they are still quite a way from pushing the market to new highs, especially with the prospect of this week’s bearishness. Technically, MACD remains in a negative crossover territory while there is a divergence between higher prices and lower peaks on the moving averages. RSI is slightly bullish but is very much in the middle and could go either way. Besides being an interim support and resistance level, 4400 is doubly important because it is very near the 50-day moving average. So any serious breaks below 4400 would be a very bearish signal for the market. It should also be noted that the 50-day moving average is just starting to fall, the first time it has done so since March. With this week likely to test more downside support levels of 4200, we can expect some kind of final rally attempt towards 4700 in early September. However, I am skeptical that it will achieve that target. It is more likely to peak at 4500-4600.
This week looks very negative on the Mercury-Mars-Pluto-Rahu alignment all at 6 degrees of their respective signs. The presence of three malefic planets in geometric resonance with Mercury, the planet of commerce, strongly points to another big move down, probably taking place midweek. Monday may see a continuation of gains, however, especially at the outset as Moon in late Virgo will be aspected by Jupiter. By Monday afternoon or Tuesday at the latest, the bears will likely take control as Mercury falls under the doubly disruptive influences of Mars and Rahu. Even if we’re up towards 4700 on Monday’s trading (a big "if" since I doubt it will climb that high), Tuesday and Wednesday has the force to take markets down quickly and again retest 4400 or in a worse case scenario, 4200. Wednesday afternoon may have some support as the Moon approaches a minor aspect with Jupiter and Venus conjoins Ketu . Nonetheless, the downside risk is very large on those two days. Some kind of rebound is likely Thursday and/or Friday as Venus aspects Mercury and Mars. This should be enough to displace the bearish energy from Rahu and Pluto and make stocks more attractive. Overall, the week looks negative, but with the possibility of gains Monday and late in the week, losses may be somewhat mitigated.
 Next week (Aug 31-Sep 4) should see a rally attempt as Mercury and Mars move into a minor but positive aspect with Jupiter. Previously, I had been more negative about my outlook for this time, but I had neglected to fully incorporate the Jupiter factor in my analysis. Tuesday and Wednesday may be the most bullish days where gains of 3-6% are possible. Some weakening by Friday is likely. The following week (Sept 7-11) looks quite mixed as Mercury begins its often difficult retrograde cycle whilst in a square aspect with Mars. Early week declines are likely but we should see at least two days of gains Wednesday and perhaps Thursday as the Sun is in aspect with Venus and Jupiter. This small rally could possibly extend into Friday but it’s hard to say with confidence. After that the market will be increasingly vulnerable to larger selloffs as the Saturn-Uranus opposition takes place on 15 September with the Sun as the triggering planet in close proximity. Mid to late September have planetary alignments that are negative enough to take markets down hard, perhaps down to 3750 or even 3500. October is no less bearish as Rahu aspects Saturn so it’s very possible we could see Nifty 3150/Sensex 10,500 by that time. I will update some of these downside targets as we move through the various aspect patterns.
5-day outlook — bearish
30-day outlook — bearish
90-day outlook — bearish
1-year outlook — bearish-neutral
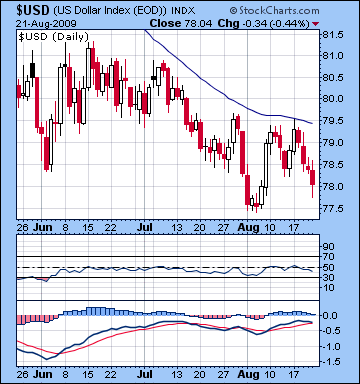 Despite a good start to the week, the dollar moved sharply lower as investors diversified into other instruments. After it’s strong close above 79 Monday, the dollar ended Friday’s session barely above 78. While I was more bullish last week, this outcome did not come as a complete surprise owing to the relative lack of planetary support. I allowed for the possibility that things could be more difficult for the dollar owing to an absence of clearly positive aspects. Happily, Monday’s gain arrived on schedule as the pessimism from the Mercury-Saturn conjunction brought in buyers looking for greater safety. Sentiment turned bearish as the Sun moved under Saturn’s aspect later in the week. Technically, the outlook for the dollar appears fairly bearish. The dollar ran into strong resistance this week at 79.5 which represents both the 50 DMA and an interim high from late July. MACD is barely positive and shows every sign of turning negative while RSI is breaking down. The 50 DMA is still declining. Nonetheless, if it can find support and hold onto present levels, then buyers near the 77-78 will likely move in and push it higher once again.
This week looks more bullish for the dollar as the Mercury-Mars-Pluto-Rahu alignment is likely to stoke fears in the equity markets that will increase interest in the dollar as a risk aversion strategy. I think there is a very good chance we could see the dollar rise above 80 this week. Some late week profit taking is likely, however, so it may slide back near 79-79.5. Despite more weakness early next week that could take it down a little further, the late week influences seem quite positive so it should approach its highs made this week. Watch for the dollar to make a big move up Tuesday September 8 (after the Labor Day long weekend) as both the Sun and Venus will aspect the ascendant in the dollar chart. I’m scaling back my expectations for the dollar for early September, as we’re unlikely to see anything above 81.5 until perhaps Sept 14-18.
The Euro gained some ground last week and closed above 1.43 near its recent highs. Things went more or less according to plan as the Euro moved sharply lower Monday but the recovery was much stronger than anticipated. Clearly, the proximity of the Mercury-Uranus opposition to the ascendant late in the week contained the bullish energy necessary to move it higher. Despite the big up move, the Euro still has failed to punch through some fairly durable resistance at these levels. This week’s Mercury-Mars square sits very close to the ascendant, so some major down move is likely by midweek. I would not be surprised to see the Euro trade below 1.41 here, perhaps even lower. For the next few weeks, the Euro will probably move between 1.39 and 1.42 as we will see more downside exposed at the expense of new highs. The Saturn-Uranus opposition in mid-September occurs exactly square the natal Moon in the Euro chart and this is likely to see a shocking selloff. A possible meaningful low may occur near October 14 when Venus conjoins Saturn on the Euro ascendant (5 Virgo). The Indian Rupee held fairly steady last week closing near 48.5. It is likely to lose ground this week, perhaps back towards 49.
Dollar
5-day outlook — bullish
30-day outlook — bullish
90-day outlook — bullish
1-year outlook — bullish
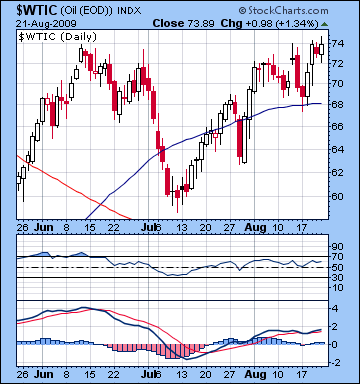 Crude oil rallied back to its recent highs closing Friday just under $74. I had been more bearish here both in terms of overestimating the effects of the Mercury-Saturn conjunction and underestimating the likely rebound. Monday saw a decline as forecast but it was fairly modest — less than 2%. The commodity bulls came back in full force on Tuesday as the Venus-Jupiter and Mercury-Uranus aspects were more positive than I anticipated. Technically, crude is looking nominally bullish as RSI is well over 50 and MACD remains in positive crossover territory. However, the matching of the June highs of $74 creates a potentially bearish double top formation in this chart. Also, there is a divergence in MACD as similar price levels have been marked with lower moving averages. And even taking last week’s gains into account, the 50 DMA is still running almost flat, a possible sign of topping.
This week has the potential to take crude down sharply as the Mars-Mercury square activates the Ketu-Neptune conjunction in the Futures chart. We could see crude fall below its 50 DMA ($68) this week, although some late week recovery above $70 is quite possible. Early next week looks very bearish but the prospect for significant rebound looms large so another rise over $70 is likely. Depending on how low we go this week, next week’s rally could be strong enough to return crude to $73-75 level. If, for example, the pullback this week is only to $68-70, then there is a good chance it will run up to match last week’s high and maybe beyond. If the pullback is back to $64 or below, then it is less likely to match its highs. Watch for the steepest decline thus far to occur in the week of Sept 14-18 as Sun conjoins Saturn opposite Uranus, all of it sitting square to the angles on the Futures chart. I would not be surprised to see a drop of 10-15% that week.
5-day outlook — bearish
30-day outlook — bearish
90-day outlook — bearish
1-year outlook — bearish
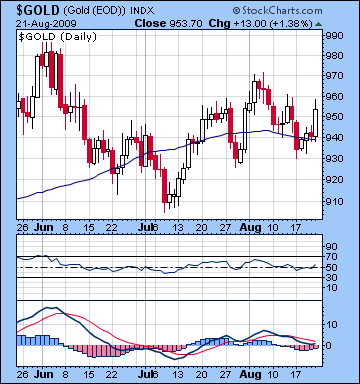 Gold managed to squeak out a modest gain this week as closed at $953. After Monday’s decline that saw it trade near $930, it staged an impressive recovery with Friday being the strongest day of the week. This outcome was not far off my admittedly somewhat vague expectations. Monday’s decline came exactly on the Mercury-Saturn conjunction and the rebound later in the week was also more or less in accordance with last week’s outlook. While I had been more bearish, I was anything but certain of that forecast since the planetary clues were unclear. My biggest error was missing Friday’s gain which I thought might have arrived a little earlier as the natal Venus was activated by Sun and Mars. As it happened, that early Venus activation brought about small gains, but transiting Venus in aspect to the natal Venus on Friday brought a more bullish result. Technically, gold appears to have broken out of a pennant or triangle pattern with Friday’s gain, however, investors should be cautious about reading too much into it. As I have learned from wiser and more experienced market watchers, triangle patterns are often marked by an initial false move in one direction (up, in this case) only to be followed by a sharper move in the opposite direction in the following days. And that is likely to be the case here. MACD is still in negative crossover and there is a divergence between last week’s highs and previous highs.
This week could be extremely bearish for gold as the Mercury-Mars-Pluto-Rahu pattern lines up on the ascendant of the GLD ETF chart. The decline may well begin Monday as Venus conjoins the natal Saturn in this chart. The Mercury-Mars-Pluto t-square is at its most exact on Wednesday, so that is a possible time of maximum bearishness. We could see some rebound later in the week, but our central concern should focus on assessing the magnitude of the decline. I think it’s very likely to fall below $930, a potential support level. After that, $910 offers possible support as it was the July low for gold. Both levels are very much in play here, although it is perhaps too easy to go overboard estimating the impact of these aspects. Next week should see a strong rebound, as Jupiter approaches the natal Moon. This is a very bullish aspect that could give gold more staying power around these levels over the next couple of weeks. So if we go down to $910 this week, it will likely bounce back up to $940-950 in early September. Gold’s steepest descent will likely occur after mid-September and the Saturn-Uranus opposition.
5-day outlook — bearish
30-day outlook — bearish
90-day outlook — bearish
1-year outlook — bearish-neutral

