- Stocks rally likely to continue in the short term; volatility increasing towards end of July
- Dollar to remain weak until July 23; another rally is likely going into September
- Gold strengthening this week; vulnerable to declines at end of July
- Crude moving higher this week although resistance levels may hold
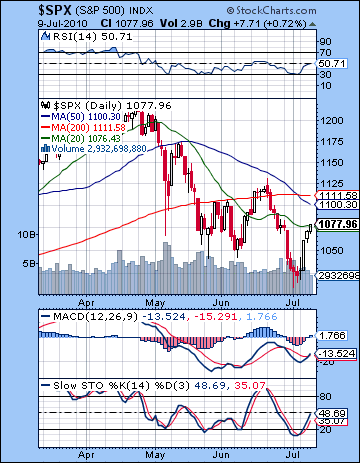 In the absence of any bad economic news, stocks bounced more than 5% as bargain hunters moved in after the recent pullback. After Tuesday’s mostly flat outcome, equities rallied strongly on three successive sessions with the Dow closing at 10,197 while the S&P finished at 1077. While I had noted the possibility of a bottom on Tuesday the 6th on the Uranus retrograde station, the overall outcome was more bullish than forecast. Although disappointing given our bearish stance, it was not entirely unexpected as I had forecast some kind of bounce here in July that could take us back towards 1100/10,500. I was also correct in suggesting that the market would be more bullish Wednesday and possibly Thursday on the Mercury-Venus aspect. This prediction was fulfilled as Wednesday saw a very solid 3% gain which was followed by another 1% up day on Thursday. My forecast went wrong for Friday, however, as I thought we would see a decline on the Saturn aspects to Venus and Mercury. While gains are sometimes possible on this planetary set up, I did not fully expect we could have three winning days in row. I thought we would see an interim low formed sometime between July 2 and July 9 given we had two strong reversal indicators: the Uranus station on July 5th and the Solar Eclipse on July 11. The close proximity of these two phenomena made it somewhat harder to call the low accurately and I thought the coming eclipse might continue to drag on prices. As it happened, we got the low closer to the Uranus retrograde station on the 5th as buyers moved in after that. So we’ve seen the market pullback on this first installment of Saturn-Uranus energy. The most recent opposition coincided to the day of the April 26 top. Since the interim high of June 21, prices have fallen into the Uranus station opposite Saturn. We now appear to be in a rising phase until the next major expression of this Saturn-Uranus energy occurs on July 26. This is made more likely due to the square aspect between Jupiter (9 Pisces) and Pluto (9 Sagittarius) which will be exact on July 23. Jupiter represents optimism and expansion and Pluto symbolizes power and large organizations. While the square aspect can be tense, this appears to be a bullish aspect that will provide some underlying support for prices over the next week or two. Due to Jupiter’s retrograde station on July 23, it is worth noting that this Jupiter-Pluto aspect will remain active until early August. Its positive effects are unlikely to last that long, however, since Saturn will oppose Uranus on July 26 and then Mars will join the bear party on July 30. This is likely to mark a more significant downturn that will extend until November at least. A large crash-like decline is possible at any time between July 26 and November 18, although it is more likely to occur around a few specific time windows. Late July-early August is perhaps the leading candidate and the period around Labor Day also looking quite bearish. Late September into early October is another very difficult period in terms of planets which could coincide with a sudden and significant move lower.
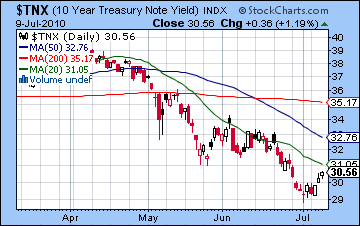
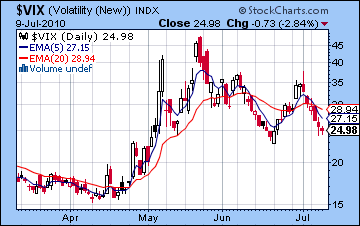
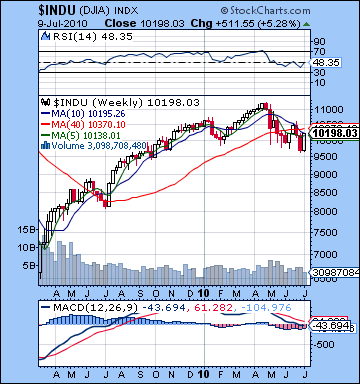 The technicals improved somewhat last week as the 1040 resistance level was broken to the upside. It is now once again resistance, although it has become less important in any future pullbacks. Prices rested on the 20 DMA on Friday’s close as this was perhaps a reasonable place to take a breather after the major gain. How far could this rally go? The next target would be the 50 DMA at 1100. This is actually a more important resistance level because it almost exactly coincides with the falling trend line from the April and May highs. Any break above 1100 would therefore be quite bullish and would signal a further move to the June 21 high of 1130. I have doubts that we can go back to 1130, but 1100 seems quite doable. The planets look mostly positive this week. On that score, there are reports of a better, more complete seal on the BP oil leak could be put in place this weekend. If that should happen, it would spark a short but significant feel good rally as this ongoing national nightmare might be finally be coming to an end. And there is no shortage of bullish technical indicators. Daily MACD has just started a bullish crossover as the bullish divergence is paying dividends with these higher prices. Stochastics (48) are now well on their way higher and have further to go before they are overbought. It is important to note that they needn’t go all the way back to 80 before another decline is possible. In May after the initial decline, they only made it as far as 60 before slumping back once again. But it is perhaps more likely that they will head back closer to 80 before turning lower again. RSI (50) is all the way back to even and seems likely to carve out another bullish divergence with respect to the previous interim high on June 21. Weekly MACD on the Dow is falling and remains in a bearish crossover. That is perhaps the most important thing to remember for understanding the overall direction of this medium term down trend. Predictably, volume was lower on this week’s rise, suggesting the rally made not have had broad participation. $VIX (24) has once again moved into a bearish 5/20 crossover indicating a possible period of declining fear and rising prices lies ahead. We’ve seen some whipsawing here recently with this indicator so it does not necessarily signal the end of the correction. The yield on the 10-year treasury ($TNX) has risen to 3.05% and is inching back to that crucial breakout level of 3.1%. If it should break above this level, it could spark a rash of short covering and push stock prices up further. Overall, then the technicals appear to favor a continuation of the bounce this week. If the S&P can reach 1090-1100, we should see a lot of sellers move in.
 This week points to more upside as the Jupiter-Pluto aspect will be highlighted by a nice Venus aspect on Monday and Tuesday and perhaps into Wednesday. We could get two (or three?) up days here, although perhaps Monday might be more so since the Moon will be in tight conjunction with Mercury and hence receiving the full strength of Jupiter’s aspect. It is highly probable that these days will be net positive so we could well get to 1100 or thereabouts. We can even stretch this Venus aspect into Wednesday since the Moon will conjoin Venus near the close of trading that day and thus bring out more of the bullish Jupiter influence. Besides matching the 50 DMA and the falling trend line, I should also mention that this will form a smaller head-and-shoulders pattern with the June 3rd high as the left shoulder. More weakness is likely after Wednesday as Mercury forms a minor aspect with Ketu (exact on Thursday). Friday also seems bearish, although perhaps not hugely so. Overall, it looks like another week that will go for the bulls with a good chance of perhaps three up days out of five. It is therefore likely that the S&P reaches 1100 this week and the Dow climbs back to 10,500. However, this will only happen if that early week Venus strength shows up on time. I think the chances are good but if it doesn’t, and we get a down day Monday, then there will be a delay in the gains which might mean we top out somewhere under 1100 — perhaps near 1085. Given the wasteland that lies ahead, it might be worth shorting this bounce, although with Sun-Jupiter due next week, a more cautious approach might wait until until then.
 Next week (July 19-23) is also likely to produce some significant upside as the Sun is aspected by Jupiter. This aspect is exact on Friday the 23rd, but I believe the upside may be confined to the earlier part of the week. Actually, this week looks quite volatile since Mars will enter Virgo early on Tuesday. This is unlikely to shake things up on its own, but with Saturn already in Virgo, the coming together of these two planetary troublemakers always holds the potential for danger. So it’s possible we could go as high as 1130 here, although that would require any weakness from the previous week to be quite muted. A more bullish scenario would be that we rise to 1120 by the 14th and only pullback slightly to 1100 by the 16th. Then we rise further in the week of the 19-23 up to 1130, albeit with more swings in both direction owing to Mars’ destabilizing presence. A more bearish scenario might be that we rise to 1100 by the 14th, then have a deeper pullback into 1060 by the 16th. Then back up towards 1100 during the week of the July 19-23 and then down more sharply after that. While I favour the more bearish scenario, we should err on the side of caution and prepare for contingencies if the more bullish scenario should come to pass. It’s conceivable of course that we don’t make it back up to 1100 at all and start drifting lower after Tuesday the 13th. That’s certainly possible, but the Jupiter-Pluto aspect seems to have a ways to go before it exhausts itself so I am expecting more upside. We should see a major down day on Monday the 26th with a crash window opening up all that week as Mars approaches Saturn. Friday the 30th and Monday August 2nd are perhaps the most likely dates of a major downdraft of more than 10% in a single day. If the decline arrives on schedule, then we should see some reversal take hold later that week around Aug 5-6. If for some reason the end of July sees only a smaller decline, then we could be in for some sideways choppiness through August. In any event, August looks mixed with both rallies and further declines with the end of the month looking more bearish. Another large decline is likely after September 15, with the last week of September and first week of October looking most negative. The period between Sept 15 and Oct 7 will likely see prices fall a further 10-20%.
5-day outlook — bullish SPX 1080-1100
30-day outlook — bearish SPX 950-1000
90-day outlook — bearish SPX 800-900
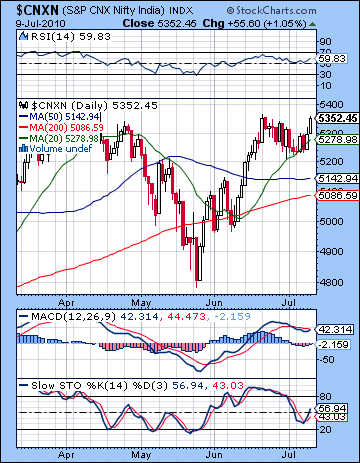 As global markets recovered last week, stocks in Mumbai floated along for the ride higher. The Sensex added more than 2% to close at 17,833 while the Nifty finished at 5352 as the main indices are now within one percent of their high for the year. This bullish outcome was disappointing given my bearish forecast and is another reminder of the continuing strength of the Indian market. Monday’s Uranus retrograde station did not produce anywhere near the decline I had expected as stocks barely moved lower at all. At the same time, it did provide a potentially useful clue in the current trend. I had previously noted that a trend reversal was likely either near the Uranus station or the solar eclipse on 11 July. While I was mistaken in thinking the solar eclipse would be the stronger turning point, the Uranus station does appear to mark an interim low in the market. Monday’s close at 5235 has been the short term low since the start of this most recent pullback on 21 June. This was the first phase of the Saturn-Uranus opposition aspect. Admittedly, the downside move was pretty tame here but it this is only the first of two important phases. The second and more important phase will likely occur close to the time of the exact opposition aspect on 26 July. I have long maintained that the bulk of the decline we see in 2010 will occur AFTER this date. Hopefully, the moves in the upcoming weeks will bear that view out. In terms of longer term influences then, we are likely in a fairly quiet and comfortable bullish interlude here. One reason for the price stability in July is the approach of a square aspect between Jupiter (optimism, expansion) and Pluto (power, large organizations). This aspect will be exact on 23 July — the same day that Jupiter turns retrograde. This is an unusual coincidence and suggests an enormous amount of energy devoted to striving for power and the reorganization of banking and government structures. The square aspect is not always helpful, however, so there could be some negative implications of this combination. Some of the efforts we see in this area could be misapplied or made in desperation. And since they will occur so near the Saturn-Uranus opposition, we have to wonder if it will be part of a larger global shift in both the financial and political spheres. I still believe that this alignment will be big enough that it will severely affect markets in India over the next few weeks. To that end, I note that the India independence horoscope (15 Aug 1947) will come under increased pressure as the coming Saturn-Uranus opposition will line up in a close square with the natal Mars in that chart. Mars is placed in the 2nd house of wealth so Saturn’s aspect represents a probable loss of national wealth.
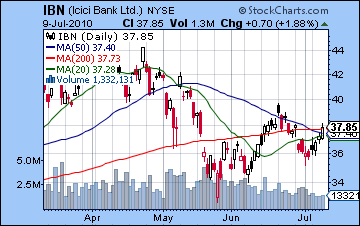
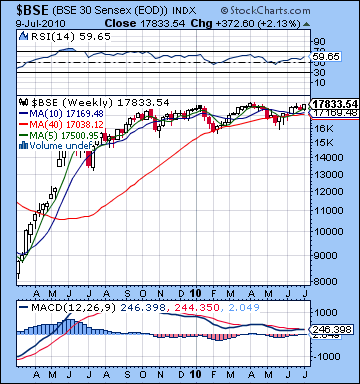 The technical situation of the market continues to be somewhat robust. Stocks ended above the 20 DMA on Friday – a sign of clear strength. The 20 DMA is now rising indicating a bullish trend. Resistance may become significant at these levels since the Nifty is close to the upper Bollinger band. More importantly, it is closing in quickly on its previous high of 5400. One more solid up day and we will see that level broken to the upside. Given the positive planets this week, I think a new high is likely. Daily MACD is still in a bearish crossover suggesting that strength is still building. We can also discern a negative divergence with respect to the previous high of 21 June. Stochastics (56) are rising, however, and may well be headed back to the 80 level before turning down once again. This points to more upside in the near term before a pullback. RSI (56) is rising but a negative divergence is evident there, too, as the relative strength of stocks has not matched its previous high. So while it is bullish for the 20 DMA to be rising and acting as support here, there are signs that the rally be limited and unlikely to last long, even if we do see some new highs here. Another danger signal is that volume was low this week. The big up days of Tuesday and Thursday occurred on just 14-15k, well below the recent average on the Sensex. This shows restricted participation in the rally and a reluctance among bulls. If new highs occur this week, we will pay close attention to volume since anything less than 20k will not confirm a major new breakout. The weekly MACD on the Sensex is still in a bearish crossover (although it is very slim here) and a negative divergence remains glaring. ICICI (IBN) recovered significantly last week as prices closed above the 50 DMA. This is a more bullish signal perhaps, although the 50 DMA itself is still pointing down and thus indicates a negative trend is in place. Volume similarly betrays last week’s rally as we can see that it was lower than the previous week’s down volume. This is a tell tale sign that all is not what it seems and the market is vulnerable to pullbacks.
This week looks to begin fairly positively as Venus moves into alignment with Jupiter and Pluto early in the week. Monday will see Venus (8 Leo) moving up to its aspect with Jupiter (9 Pisces) and Pluto(9 Sagittarius) while Mercury (10 Cancer) is still in close aspect with Jupiter. The Moon will also be in Cancer with Mercury, so this should boost sentiment further. At the same time, a minor aspect between the Sun (25 Gemini) and Mars (25 Leo) will provide added fuel to the mix. The Sun-Mars combination can be troublesome at times, but given the strong Venus and Jupiter ambiance here, I think the bulls should win out. Tuesday also looks generally positive as Venus moves into a more exact aspect with Jupiter. Wednesday looks a little less positive as Venus has moved past Jupiter and thus the aspect should be weaker. The Moon enters Leo, however, to join Venus so that could conceivably boost the situation. So I would not rule out the possibility of three up days here, although we may only see two. The first part of the week does seem net positive so a new high for 2010 seems probable. The mood may sour somewhat by the end of the week as Mercury forms a minor aspect with Rahu by Friday. Friday’s close also looks tricky because the Moon will enter Virgo and conjoin Saturn at that time. Overall, a bullish outcome seems likely here even if the end of the week is more bearish.
 Next week (July 19-23) looks like an increase in volatility although more positive days are likely given the Sun-Jupiter aspect on Friday. Monday could be bearish as Mars prepares to change signs and enter Virgo. Here it will join Saturn and while I do not expect an immediate fallout from this sign change, it is nonetheless possible. Also, Mars will aspect the ascendant in the NSE horoscope so that is another factor that may increase the odds of a down day. Tuesday and Wednesday seem more positive as the Sun moves deeper into Cancer and under the positive influence of Jupiter. Thursday looks less positive, and Friday looks fairly bullish on the aforementioned Sun-Jupiter aspect. The following week (July 26-30) looks more negative with the chance of a steep decline. Monday looks quite negative as Mars aspects Neptune, but all eyes will be on the late week period, especially Friday, when Mars conjoins Saturn. The exact conjunction will not occur until early Saturday morning, but Mars could be the trigger to release of a lot of bearish energy. A one-day crash is therefore possible. More conservatively, we may only see a 5% decline, although I tend to think it will be more on the order of 10% over a five-day period. The negativity will likely carry over into early August. A small bounce is possible in mid-August, but the market should weaken substantially into September. We could see another significant low formed in the last week of September or first week of October as the market looks like it will fall another 10-20% between 15 September and 7 October. This could well be around the 4000 level, although much will depend on how low we drop around July 30.
5-day outlook — bullish NIFTY 5300-5450
30-day outlook — bearish NIFTY 4800-5100
90-day outlook — bearish NIFTY 4000-4500
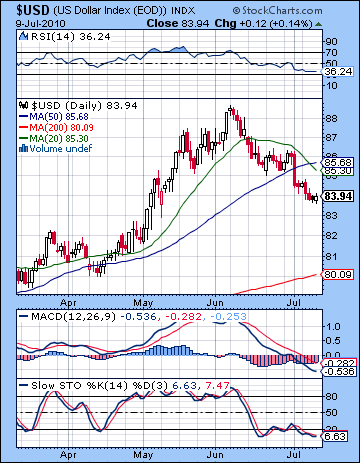 The Dollar continued to slump last week as worries over the US recovery kept the greenback on its heels. It closed down half a cent finishing just a hair under 84. I had hoped for better things here but we only saw scattered signs of life on Friday as the influences of Mercury and Venus finally produced a little of the rise indicated in last week’s forecast. The Dollar is clearly in trouble. It’s resting on the rising trend line from the December low and a breakout lower would send it tumbling further, perhaps back to 80 and the 200 DMA. I don’t think this is likely, but it does illustrate the extent of the weakness. The 50 DMA is still rising at least indicating the basic trend is still up But daily MACD is still falling and locked in a bearish crossover. Stochastics (7) are oversold still, but do not show much signs of turning higher just yet. It’s finding some support at the bottom on the Bollinger band here so maybe it sticks. Volume is still pretty average so there hasn’t been a rush out of the Dollar. More worrying, however, is that the weekly chart shows a MACD bearish crossover. This chart has been in a bullish crossover since December so that is a potentially significant that the medium term trend is changing.
This week does not look especially promising. Transiting Saturn (5 Virgo) is still in aspect with natal Saturn (6 Scorpio) so our expectations can’t be too high in the near term. The early week period does not feature any obviously positive aspects either, so it is hard to see where any rebound will come from Further declines seem likely until perhaps Wednesday when Mercury will aspect the natal Jupiter. The late week looks generally more favorable for the Dollar so the best case scenario would be that it finishes flat for the week. I don’t fully expect this to happen, but it is possible. Perhaps a fake out below support will be what is necessary for it to rally again. The situation should improve after July 23 when Jupiter turns retrograde. In doing so, it will begin to strengthen its influence on both the natal Sun and Saturn in the USDX chart. This will produce another big rise going into September and perhaps part of October. There is a chance that we will see 88 again, although that is not a certainty. October does look like a significant interim high, however. I would also note that a major high in US Treasuries is likely in November. This is unlikely to correlate with a high in the Dollar. Watch for a shocking decline in both the Dollar and Treasuries in December and January.
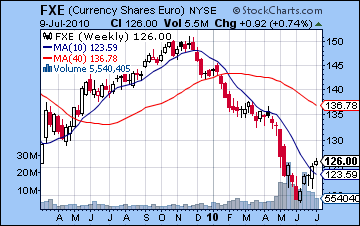 The Euro extended its bounce from oblivion last week as it closed above 1.26. This has been a popular long position among speculators as it had been oversold for weeks. Resistance may now be kicking in, however, as it is now trading above its 50 DMA. The falling trend line is next at around 1.27-1.28 as more investors may be getting cold feet as they enter a game of chicken to see who stays in longest before the whole thing falls apart again. This week looks like more upside as the Sun-Mars aspect will set up on the natal Jupiter by Wednesday. So from that perspective, the bias would be bullish ahead of that aspect and more bearish afterward. So that means we will see a test of the trend line to 1.28 perhaps before it reverses a bit by Friday, perhaps back to 1.26-1.27. After that, things get a little sketchy as Mars enters Virgo on July 20. I think the Euro could stay afloat for another week before it faces doomsday on July 30 when Mars and Saturn line up on the Euro’s ascendant. Actually, a major pullback will likely begin on July 26. The trend looks to be mostly lower through to September. Meanwhile the Rupee held firm last week closing Friday at 46.6. Further gains are likely this week towards 46. Major weakness is likely to accompany the Mars-Saturn conjunction at the end of the July, however.
Dollar
5-day outlook — bearish-neutral
30-day outlook — bullish
90-day outlook — bullish
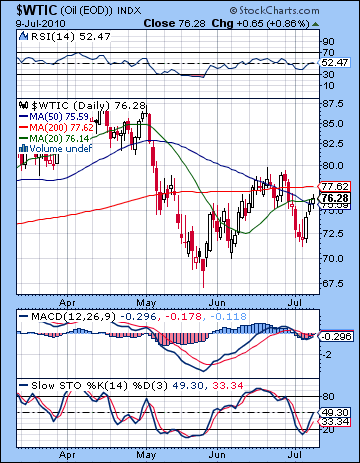 Crude oil racked up solid gains last week on a stabilizing economic environment. After trading as low as $72 early in the week, crude rebounded above $76 by Friday’s close. I thought we might see more downside especially later in the week on the stronger Saturn influence but the growing strength of Jupiter manifested somewhat earlier than expected. As Mercury moved deeper into the water sign of Cancer, I had anticipated more upside for crude since oil is symbolized by the condition of the water signs. Jupiter is already in Pisces, another water sign, so Mercury entered Cancer on Wednesday and this correlated with prices moving higher. The technical situation of crude is still muddled, however, as the recent bounce has not pushed it above significant resistance levels. Friday’s close put it in close proximity with both the 20 and 50 DMA, and below the 200 DMA. 50 DMA is still falling here indicating a medium term downtrend. The 200 DMA is more or less flat here after rising for the better part of the past 12 months. This is another longer term indication that the trend may be changing. Despite the bounce, daily MACD is still in a bearish crossover and is now close to the zero line. Stochastics (49) are rising and suggest this rally may have further to go until reaching the overbought area above 80. RSI (52) has moved into a bullish area but is at risk of forming a negative divergence with respect to the June high (60). Unless RSI also reaches 60 at the end of the current rally, the divergence will be in effect. More upside room is likely but resistance will intensify around the $79-80 area which corresponds to previous highs. We can see the beginning of a triangle or pennant pattern here as falling trend line from recent highs are intersecting with the rising trend line from recent lows. This is a neutral pattern in terms of future prices, although it appears to be fairly close to resolution one way or the other.
This week suggests more possible upside as the Moon joins Mercury in Cancer early in the week and thus comes under the helpful aspect of Jupiter. The Venus-Jupiter aspect on Monday and Tuesday also seems generally bullish in this respect so really there are good astrological reasons for expecting a continuation of the rally. In addition, Mercury will come under the aspect of the potent Jupiter-Uranus conjunction in the Futures chart in midweek. So there is a good chance for significant gains here, perhaps challenging the June high. The late week could see profit taking as the Moon enters fiery Leo. Friday seems more bearish than Thursday. I’m not counting on any big negative fireworks here, although there is some potential for that. Overall, the week should be positive. Next week looks more volatile. On the plus side, the Sun enters Cancer and has its turn to shine under the beneficent rays of Jupiter. But Mars enters Virgo on the 20th and this could be a harbinger of sudden changes as it approaches Saturn. I wouldn’t rule out higher highs during this week, but the downside risk is also greater. I am expecting larger declines in the last week of July and the first week of August. We could see a small rebound in the first half of August but the picture looks more bearish after that. Late September is another very bearish period and we could see crude break down significantly at that time.
5-day outlook — bullish
30-day outlook — bearish
90-day outlook — bearish
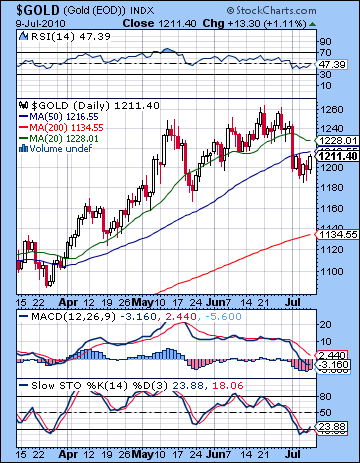 After visiting the sub-$1200 area earlier in the week, gold managed to climb back by Friday’s close to finish the week at $1211 on the continuous contract. While I thought we might see a little more downside, this flat result was not wildly different from expectations. As predicted, gold did trade below $1200 and the late week recovery got a head start on the bounce I had expected for this week on the Venus-Jupiter-Pluto alignment. Gold appears to have found a temporary bottom near support of the large rising wedge. This is also fairly close to the 50 DMA. While some of this support was tested and actually pierced somewhat midweek, the late week recovery might indicate that gold could rally higher once again. Daily MACD is still in a bearish crossover, however, and perhaps worse reveals a negative divergence with respect to previous May lows. This is a powerful signal that gold prices likely will have to retrace in the medium term. Stochastics (23) are turning higher and point to an incipient rally here. RSI (47) is also moving up, although the bearish divergence is clear here also with respect to the May low. In the event of a rally, resistance may be found at the previous support level of the small rising wedge around $1240-1250. We also can’t rule out another retest of the previous high at $1270 although given the growing divergences in this chart, that seems fairly unlikely.
This week looks quite bullish for gold as the early week period is dominated by the Venus-Jupiter aspect. Since the condition of Venus is one of the keys to the gold price, its association with Jupiter should lift prices into Tuesday or perhaps Wednesday. Thursday is harder to call although with the Moon still transiting Leo, a bullish bias is definitely possible. Friday will feature the Sun’s entry into Cancer. This is something of a mixed blessing for gold since the fiery Sun does not do especially well in watery Cancer. At this time, however, the Sun will receive the positive benefit from Jupiter’s aspect so that ought to provide some price support in the near term. Although Friday may be more bearish, the week as a whole looks positive and we could see $1240. Next week looks more mixed, however, as Mars enters Virgo on the 20th while the Sun gets a growing boost from Jupiter. This are potentially offsetting influences although the early week may be more bearish with some recovery more likely at the end of the week. Gold looks increasing vulnerable in the last week of July and first week of August and it could well break support in the large wedge and fall below $1180. Volatility will reach extreme levels at this time. This looks like the start of a major down trend that could extend into October and take gold down towards $1000. The next major decline will likely take place around September 21.
5-day outlook — bullish
30-day outlook — bearish
90-day outlook — bearish

