

Summary for week of September 12 – 16
Summary for week of September 12 – 16
- Stocks may rise into midweek but selling more likely in late week
- Euro will likely rebound higher towards 1.39 break out; prone to weakness by Friday
- Crude to stay firm into midweek but weakness likely by Friday
- Gold more vulnerable to declines with Venus in Virgo although week could be mixed
No jobs plan is going to save this market. Stocks resumed their losing ways last week despite Obama’s well intentioned proposal to boost job growth in the listless US economy. In the holiday-shortened week, the Dow fell by more than 2% closing at 10,992 while the S&P500 finished at 1154. While I had a bearish bias for the week, trading unfolded in a way that was surprising as the only up day occurred on Thursday. In last week’s newsletter I thought the best chances for gains might occur earlier in the week on Mercury’s entry into Leo but this was not the case. Of course, Mercury entered Leo on Monday so some of that positive energy was spent before US markets even opened. After that, the bearish Mercury-Neptune opposition took over and we went lower on Tuesday and Wednesday. Thursday was wildly bullish after the previous two day decline that tested support at 1140. That was very unexpected as there were no obviously bullish aspects in play at that time. Friday was bearish as expected as Mars entered Cancer on that day and we tested support of that rising trend line in the bear flag pattern for the second time.
The overall picture is generally adhering the planetary script here as we have tested that support around 1150 and thus have extended the cloud of uncertainty over the market for yet another week. Many bulls who have been avid buyers of recent dips have been counting on Ben Bernanke to supply another shot of free Fed money into the market on the Sep 20-21 meeting. He spoke last week but refused to tip his hand one way or the other, and this was likely another reason for the selling. For better or worse, nobody really puts much stock in anything Obama says about the economy because the market assumes that the Republicans will block his plans at every turn. But it seems as if Europe is getting top billing these days as new rumours arose that a Greek default may be imminent. Such a development would further jeopardize the solvency of many private commercial banks and would threaten to take down the whole global financial system. Think Lehman Brothers but with a French accent. And the currency markets are starting to wake up to this new and awful possibility as the Euro broke a major support level of 1.40 last week. This is a potentially huge sell signal on the markets as a rush out of the Euro would send more investors back to the US Dollar. This would have the knock-on effect of reducing risk exposure as the logic of the carry trade would be called into question. A falling Euro almost certainly means a falling stock market, although there may be a time lag. The astrological angle on all of this resides with Saturn, not surprisingly, and its upcoming aspect with Ketu (South Lunar Node). Saturn often symbolizes structures and established tradition while Ketu represents sudden chance and the loss of stability. When these two bearish planets come together, they can coincide with situations where established structures are undergoing major change. The loss of stability during this aspect is enough on its own to prompt selling pressure. But it also increases the possibility of institutional failure either of the EU and Eurozone, or perhaps large European banks. I can’t see the EU kicking Greece out of the Eurozone right now, but there is definitely an increased risk of a default or of major European bank failure in the coming weeks on this aspect.
 The technical picture remained long term bearish as the bear flag acquired another two touches of its support line at 1150. While a bear flag is bearish (hence the name!), bulls may at least take some solace in the fact that support is holding here. A break below that trend line would be catastrophic for the bulls, however, as it would greatly increase the likelihood of a retest of 1100 and the probability of a lower low, perhaps around 1050. The argument for the upside assumes that support holds here at 1150 and then a rally that may touch the upper resistance level near 1240-1250. This would keep the bear flag intact, but would allow some short term gains as the market attempts to confuse as many investors as possible. We could very well see a run to 1240 although I would note the bearish head and shoulder pattern forming with the 1230 head and 1205 shoulders. That will make such a rally that much harder to succeed. But MACD is still in a bullish crossover so perhaps all is not yet lost for the bulls. Stochastics and RSI are falling now, however, suggesting some short term weakness. Maybe the best argument for the bulls is that since the Aug 8 low, we have seen a series of higher highs and higher lows. That pretty much describes a bull rally and as long as that pattern keeps up, the market will continue to stay afloat. That is what makes this week so crucial. If Monday is lower, then the trend line is broken, and we see a low that is perhaps lowers than the previous low at 1140. But if Monday holds firm, then the bulls have to try to take out 1205 and thus negate the head and shoulders pattern. Their inability to break 1230 last week is already weighing on their prospects, however.
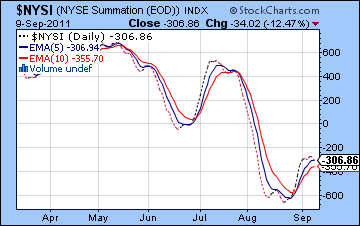
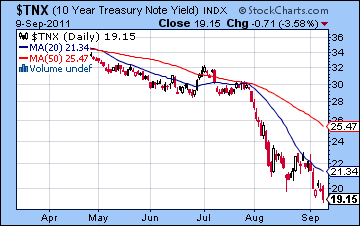
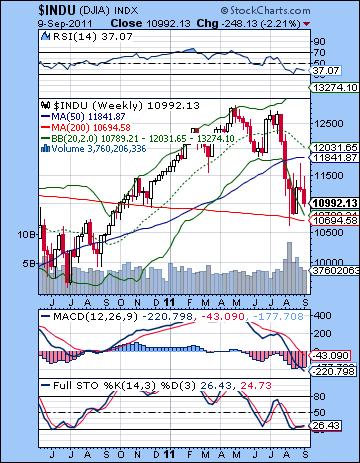 The weekly Dow chart is still hugging the bottom Bollinger band. So far, the 200 WMA is providing support at 10,700 although MACD remains in a deep bearish crossover. RSI is venturing to move out of the oversold area and Stochastics are hinting at a breakout higher. That’s not much to go on, although there at least the bearish case is no more compelling. Just as we saw a crossover of the 13/34 weekly EMA, we can see that the 20 and 50 WMA are about to crossover. This is a slightly longer term pairing and if it happens, will further cement the reality of new bear market. The NYSI summation index, a measurement of market breadth, is starting to turn down although it remains above its 5 and 10 day EMA. It has risen since the second low on August 22 but is threatening to head lower. A crossover of its 5 and 10 day EMA would offer more evidence that the market is heading for a lower low in the coming weeks. If stocks rise this week, however, then this indicator will offer evidence for further upside. As the financial world begins to crumble, the flight to treasuries continues as the yield on the 10-year dropped to an astounding 1.91%. Bonds are still signaling significantly lower prices on stocks. Bernanke may announce something on Sep 21 that could change this trend but at this point the bond market will continue to offer safe haven for money that is risk-averse.
If last week had more of a bearish planetary bias, this week is more bullish. That said, I am still quite cautious here because there does not seem to be much to go on. I would maintain a medium term bearish stance at this point with the most likely scenario being a lower low ahead. Wednesday’s Mercury-Jupiter aspect is the probable fuel for the upswing although that leaves Monday and Friday somewhat more vulnerable to declines. But Venus enters Virgo over the weekend and that can be a negative influence, especially since Saturn already resides in that sign. The conjunction is still three weeks away, but it is possible that Monday could have a bearish tinge to it nonetheless. But a Venus-Pallas aspect may remove the worst of that Virgoan awkwardness. If Monday is negative then that would have huge technical implications for the market since we are sitting at support now. A negative close would change everything. While I would not rule out a negative day Monday, the aspects do not look clearly bearish. So I would tend to preclude a break below 1150 on Monday. This would allow a rise to take place perhaps into Wednesday and the Mercury-Jupiter aspect. The odds for a decline increase after Wednesday, however, as Thursday’s Mars-Neptune aspect does not look good. Friday also looks suspect as the Sun could weaken before leaving the sign of Leo. So it’s possible we could finish higher overall, although recent volatility makes that more uncertain than usual. Down days have a habit of wiping out prior gains. But there is a reasonable chance that we will remain in the bear flag between 1150 and 1180. Actually, this is still quite possible even if we happen to trade lower on Monday. Some kind of relief rally is possible which would rise up to back test the support line.
 Next week (Sep 19-23) is something of the moment of truth as Bernanke will announce his plans for the economy. There is a very real prospect of disappointment here as many observers do not expect him to go ahead with a full blown QE3 plan as before. Most people believe he will announce some kind of modest Operation Twist where the Fed buys long term bonds and sells short term notes. This would be less onerous on the already bulging balance sheets but would still help to keep long term rates low. It’s hard to know what the market reaction to such a modest proposal would be. Some disappointment perhaps, but investors may also decide to simply sell the much-anticipated news. The Saturn-Ketu aspect is exact during this week so that tends to argue for more downside. Bernanke may in fact be relegated to the back burner as the Europe situation continues to spiral out of control. Monday’s alignment of Mercury, Saturn and Ketu looks quite bearish, as does the late week Mars-Uranus aspect. This would be a possible time when we break the bear flag support at 1150. The following week (Sep 26-30) looks rocky as Sun and Mercury form t-squares with Uranus and Pluto. While there is a chance that these configurations could produce substantial gains, I would be be quite skeptical here particularly if the bear flag is broken beforehand. Significant moves are likely here, and the most likely direction is down. October contains some difficult looking aspects, as Venus, Mercury, and Sun all conjoin Saturn in the first half of the month. I would not rule out some upside here (back test to 1150?), since conjunctions can sometimes be possible even with malefic planets. But the problem is that Jupiter is still not quite making its aspect with Pluto. This would be a necessary offset that would be needed to create some optimism. The aspect is not exact until October 28. It seems unlikely that we will decline until that date, but it may mean that it will take a while for the market to find its feet after this correction has concluded. The end of October actually looks very bearish in terms of aspects (aside from this Jupiter-Pluto aspect) so we could see a rally attempt in the middle of the month and then another decline into the last week of October. When the bleeding stops is hard to say. 1050 is a sensible downside target at this point, although I would not be surprised to see it fall lower than that. I had expected a more solid rally to occur in late October and November and now I’m not so sure it will unfold that way. Maybe we will have to wait until December before the bulls get back on track.
5-day outlook — neutral-bullish SPX 1130-1180
30-day outlook — bearish SPX 1100-1150
90-day outlook — bearish SPX 1000-1100
 Stocks moved higher last week as the rebound extended into its second week on optimism that emerging market inflation may be coming under control. Despite Friday’s sell-off, the Sensex ended slightly higher closing at 16,866 while the Nifty finished at 5059. While I had been somewhat bearish for last week, this outcome was not too surprising. I thought we could see some early week upside on Mercury’s entry into Leo and although Monday was slightly lower, Tuesday rebounded strongly. I had expected the late week period to generate more downside and that also came to pass as Friday’s decline erased much of the previous days’ gains. I was off the mark, however, on my expectation for weakness on Thursday and the Mercury-Neptune aspect. Nonetheless, the entry of Mars into Cancer on Friday effectively kept the Nifty in our expected range around 5000-5100.
Despite the second week of gains, the market remains vulnerable to global crosswinds as Europe continues to be a major source of concern. Even though the German High Court did not rule against the EU bailout package, there is renewed anxiety around a possible default of Greece in the coming days. Germany is drawing up contingency plans for its banking sector in the event such a default occurs. Adding a sense of turbulence to the situation, a member of the ECB board resigned on Friday for undisclosed reasons. The currency markets reflected the precarious nature of the Eurozone as the Euro broke a major support level of 1.40 last week. (see details in currency section). Its inevitable decline to 1.30 and below in the weeks ahead will be an additional strain on equities worldwide as money flees the chaos of Europe and seeks safe haven in the US Dollar. A falling Euro likely spells the end to the risk trade that has marked the post-meltdown rally since 2009. Much of the gains in global markets were associated with a strong Euro and weak Dollar as the Fed sought to devalue its currency and cheapen exports as a way out of the crisis. It seems more unlikely that there will be any quick resolution to the crisis in Europe as many investors are waiting for the next shoe to drop. It is perhaps no coincidence that this latest round of Euro-panic comes after Jupiter has turned retrograde at the end of August. The planet of confidence and optimism seems to be slipping into the background here for a while and this will open the door for Saturn and its more punishing ways. As I have noted for several weeks now, the approaching Saturn-Ketu aspect in late September could be troublesome for markets. The symbolism of these two planets suggests that some fundamental changes may be on the way. Saturn is associated with structures and large institutions while Ketu represents re-ordering and destabilization. Together, the Saturn-Ketu pairing can reflect situations where sources of stability are cast into doubt or re-engineered to cope with new realities. Since both of these planets are considered malefic by nature, this adjustment process is often painful and creates uncertainty. Markets hate uncertainty of course, so that is one big reason to expect more fallout from the crisis in Europe. A Greek default is definitely possible under this transit, but so is the insolvency of some private commercial banks that have come into focus in recent weeks.
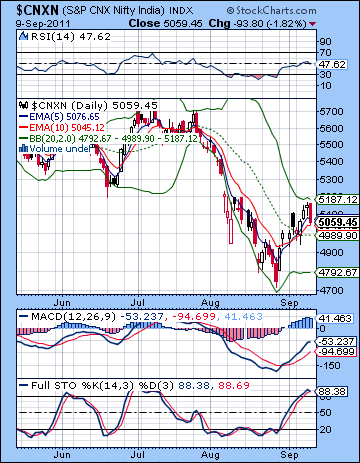
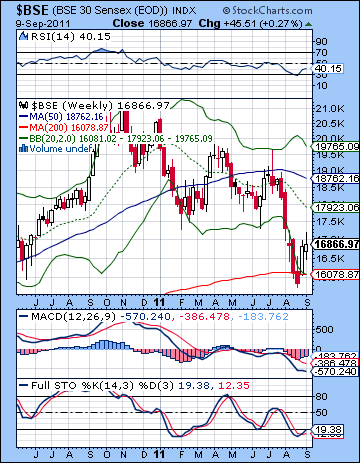 The technical picture continued to improve and yet the medium and long term outlook is still bearish. Thursday’s advance approached the top Bollinger band suggesting that the rally was mostly spent for the short term. Prices remain above the 5 DMA indicating short term bullishness and the Nifty has also managed to climb over the 20 DMA. But Stochastics are now overbought and are showing a small bearish crossover. While this is sometimes an overly sensitive indicator that gives false signals, this rally is perhaps more deserving of a cautious approach. MACD is still in a bullish crossover, however, indicating that more upside is still quite possible. RSI (47) has slipped below the 50 line and offers neither bullish nor bearish evidence.
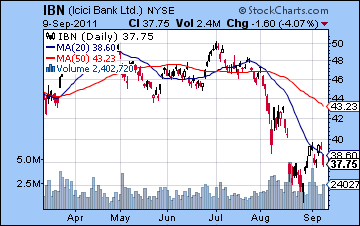
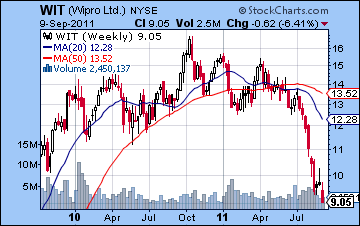
The problem for the Nifty here is that gap above 5230. It will take some major news to persuade bulls to take on more risk to bridge that gap. It’s still very possible given the supporting evidence such as the MACD crossover but it may take more than one try to close it. And even if the gap gets closed to 5300, there will be a huge temptation to sell afterwards. There is a ton of overhead resistance above 5300 that may be more than the Nifty can handle at the moment. Meanwhile, support is likely near the 20 DMA at 4989. A close below that level would increase the likelihood of a return to 4900 and below. Overall, I think more rallies will be sold here as the the market remains below the declining 200 DMA. The weekly BSE chart shows how beaten up stocks have been. After hugging the bottom Bollinger band for a while, they have begun to move higher. The question now is: can they climb back to the 20 WMA at 17,923? That seems like a tall order right here (=5380 on the Nifty). Nonetheless, Stochastics are in the bullish crossover here and as long as that condition remains, the rally may be able to take root. However, the pattern in the Stochastics is very bearish as we can see a series of lower peaks. RSI shows the same bearish pattern of falling peaks and lower lows. ICICI Bank (NY:IBN) reflects the technical troubles of the market quite well. While it gamely ventured higher last week, it failed again to close a gap at $40 and then sold off on Friday. It’s well below its 50 and 200 DMA so it is difficult to see much upside here. But if it can trade higher this week, that would at least suggest some buying interest to prevent a retest of the recent lows. More bearishly, Wipro (NY:WIT) make a new low for the year as it failed to hang onto its 200 WMA. This is a pretty bearish looking chart with the next obvious support level at $7.
 This week looks like a mixed bag. Venus enters Virgo on the weekend and this may serve as a background bearish influence for the next few weeks. Monday’s Full Moon could also be bearish since it occurs in Aquarius, a sign ruled by Saturn. But the midweek looks more bullish as the Mercury-Jupiter aspect is exact on Wednesday and Thursday. This suggests a greater likelihood of some up days near that time. Even if there is a down day on Monday, the midweek looks bullish enough to offset previous losses. And it is quite possible that Monday may not be negative and so we could see the Nifty climb to perhaps 5200-5250 and attempt to close that gap. Thursday and Friday look more susceptible to declines, however, as Mars aspects Neptune. Two consecutive daily declines are quite possible here. I would lean towards a bullish outcome this week, although I would be very cautious in any event given the medium term outlook. The late week declines are perhaps less likely to outweigh the preceding gains so there is a reasonable chance that the Nifty could finish at 5100-5200 or perhaps even higher. At the same time, I acknowledge a certain uneasiness with the planets right here given the proximity of the Saturn-Ketu aspect. This is a powerful aspect that could overshadow any other aspect combination and take markets lower at any time. Extreme caution is definitely in order. One potentially useful guide is to watch the 5 and 10 day EMA. As long as they are in their current bullish crossover, then the market will continue to rise.
 Next week (Sep 19-23) looks more bearish as Saturn forms its exact aspect to Ketu. There is a chance for significant downside with this aspect. Monday looks very bearish given the Mercury-Rahu aspect and while we could see some midweek upside, the late week looks bearish again on the Mars-Uranus aspect. This could be a time when the Nifty slips back below 5000 and retests its recent lows. The following week (Sep 26-30) also looks pretty nasty as the Sun-Mercury conjunction in hard aspect with Pluto and Uranus. This has the potential to produce a significant move. Given that neither Mercury nor the Sun are considered malefic planets, it is conceivable that this combination might produce a gain. This seems less than probable, however. The deck appears to be stacked in favour of the bears here as Venus is close to its conjunction with Saturn at the same time. In early October, the Sun and Mercury make their conjunctions with Saturn. These also look bearish to me, although I wonder if I’m missing something more positive. It’s hard for me to fully accept the picture the planets are suggesting here — that the market could well fall for much of October. And yet it seems very likely that 4800 will be broken on the downside and we could very well see 4500 by the end of October. I had expected a possible low on October 14th with some kind of rally around the Jupiter-Pluto aspect on October 28. I am having second thoughts about this scenario since there seems to be more negative aspects in the last week of October and in early November. I think there is a good chance we will see 4000 by November. The bulls may have to wait until the second half of November before they can stage a significant rally. Longer term, there is a very real possibility we could revisit the 2008 low of 2500 on the Nifty sometime in 2012 or early 2013.
5-day outlook — bullish NIFTY 5100-5200
30-day outlook — bearish NIFTY 4700-4900
90-day outlook — bearish 4000-4500
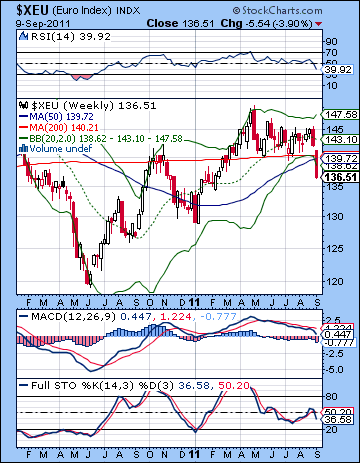 Currency traders finally bailed on the Euro as the latest rumblings about potential bank failures, ECB resignations, and a Greek default were too much to bear. The Euro broke two key support levels and closed below 1.37. The Dollar Index rose above 77 while the Rupee was crushed closing at 46.73. Things are definitely happening now, and it doesn’t look good for anyone with a long position in anything other than US Dollars or perhaps US treasuries. I thought the Euro could eke out another week above the waterline here but it was not the case. The Saturn-Ketu aspect is finally taking hold here and it has the Euro by the throat. The Euro broke below its rising trend line dating back to its lows in mid-2010 at 1.20. It also broke horizontal support at 1.39 which can be traced back to a key high in 2010 as well as some significant congestion in 2009. This looks like the point of no return for the Euro as these patterns speak volumes. But RSI (29) is oversold as is Stochastics (8) although they may not be very influential in a strongly trending market such as this. MACD is in a deep bearish crossover and is well below the zero line. Will the Euro backtest the broken support at 1.39? It’s definitely a possibility although sentiment is so negative right now it seems like a long shot. The next major support level is around 1.29-1.30. We could get there very quickly — perhaps in just two or three more weeks. Below that is 1.25 and below that is 1.20. That is a possible longer term target for the Euro.
This week actually offers a possible back test pattern as Mercury is in aspect with Jupiter in midweek. This will hit the Sun in the Euro horoscope and it could represent some temporary strength. In addition, Venus crosses the ascendant in this chart so that is perhaps added evidence that such as back test is possible. But will it happen? I would think the odds favour some kind of gain this week although whether the Euro climbs all the way back to 1.39 is harder to say. The end of the week does not look good so the rally, if it happens, may only last a couple of days. Next week looks more problematic as Saturn and Ketu will form an exact aspect. This could activate the Mars in the Euro chart and represent another move lower. After that, it looks fairly bleak for the Euro as we move into October. Some recovery is likely in the second half of October. November and December look mostly bearish so we could very easily see 1.20 by year’s end. We could see a possible significant low formed in January 2013.
Dollar
5-day outlook — bearish-neutral
30-day outlook — bullish
90-day outlook — bullish
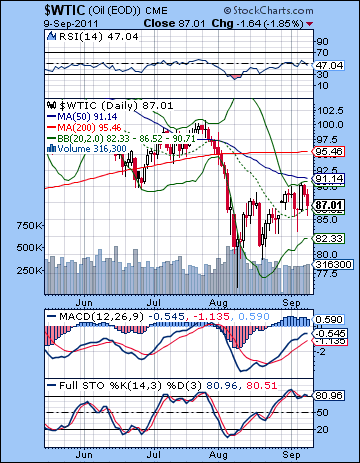 Crude rallied on early week supply concerns as it closed slightly higher on the week above $87. This bullish outcome was not unexpected, although I thought we might see a little more downside. The early week upside arrived more or less on schedule as renewed strength of Mercury pushed prices back up to $90. Tuesday’s intraday low of $85 was somewhat surprising, however. But the second half of the holiday-shortened week was bearish as the Mercury-Neptune aspect was negative. Mars’ entry into Cancer was also negative as expected as crude pulled back to support levels. Crude has tested the upper Bollinger band twice in the past two weeks and this may becoming major resistance at the $90 level. The 50 DMA is another source of resistance at $91 that will make it difficult for any rally. RSI (47) has climbed off its recent lows and is adhering to a bullish rising trend line. If and when it breaks below that line it could signal a reversal for crude. Similarly, MACD is in a bullish crossover and is only hinting at some shrinking histograms. Stochastics (80) are overbought, however, and have begun a bearish crossover. This is perhaps an early warning signal that crude may be weakening. If support near the 20 DMA does not hold, then crude would most likely revisit the $80 level.
This week offers some possibility for gains. Monday is a bit of a toss up although even if the open is negative, some late day recovery seems more likely as the Moon enters watery Pisces by the close. The odds of gains increases as the week progresses as the Mercury-Jupiter aspect on Wednesday is likely to spur buying. Another test of resistance at $90 is therefore possible this week. The late week looks less favourable, however, as the Mars-Neptune aspect could be very bearish for crude. This may be negative enough to nullify any preceding gains this week. Next week looks mostly negative as Mercury joins the Saturn-Ketu early in the week. Later in the week, the Mars-Uranus aspect could also cause problems for crude. We could see a retest of support of $80 at this time. Crude generally looks weak for the next few months. October could be lower, although I would note the presence of some positive aspects that could offset some of the decline. A significant dip is likely in the middle of October and that should be followed by some rally. Late October and early November look very bearish and we could easily see new lows made at that time.
5-day outlook — neutral-bullish
30-day outlook — bearish
90-day outlook — bearish
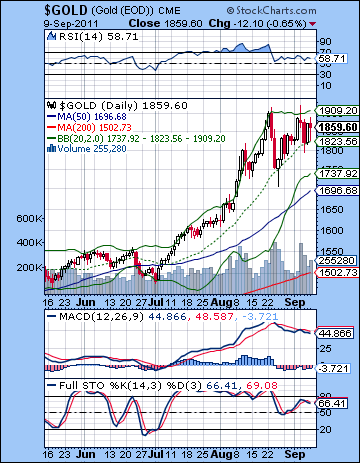 With the Dollar finding its feet again amidst the Euro crisis, gold lost 1% last week closing below $1860. This was a new and unfamiliar position for everybody’s favourite safe haven as money appears to be less attracted to the yellow metal than has been the case recently. Could the bubble finally be bursting? For the moment, at least, it appears as if gold has topped out as it can’t get past its upper Bollinger band. That is not the same thing as ending this incredible rally over the past two years. As long as gold stays above its 20 DMA at $1823, then the upward momentum will remain intact and bulls will have nothing to fear. But technical signals are flashing that a pullback or correction is looming. MACD is still in a bearish crossover, despite the second run to $1900 last week. Stochastics are in a bearish crossover and is below the 80 line. RSI is now showing a clear bearish divergence. It is not a chart that would encourage any long plays. The rising trend line support comes in near the 20 DMA and a downside break could usher in some serious selling pressure. $1600 could be revisited fairly quickly in that scenario which is also close to the rising trend line. Resistance is likely provided by the upper Bollinger band near $1900. Some projections I have seen give an upside target of $2060. I think this is unlikely since we are very close to the upper side of a long rising channel.
This week could see more volatility for gold. First, Venus enters Virgo over the weekend. This is a poor placement for Venus, a planetary co-ruler for gold. The transit through this sign for the next four weeks could put pressure on gold in the medium term. While the midweek Mercury-Jupiter aspect could add some juice to gold, the late week patterns do not favour more upside. The Mars-Neptune aspect on Friday looks especially dangerous for gold. We could see a serious decline in gold at any time here, although the odds increase as time goes on. Next week, the Sun enters Virgo which will likely have an additional bearish burden on gold since Saturn is currently residing in Virgo. The Mars-Uranus aspect on the 22nd-23rd looks especially nasty. The following week there is a critical aspect between Sun Uranus and Pluto that could accelerate any trends already underway. There is a lot of energy in this pattern so caution is necessary. It is conceivable it could spark a rush to gold, but generally I would be fairly bearish about its influence. By October, gold may well be trading at $1600, with lower prices likely by December and January 2012. It looks like we are on the verge of a significant retracement in gold that will provide a compelling buying opportunity for the longer term. Another interim high is likely sometime between July and September 2012. The next major low may occur in January 2013.
5-day outlook — bearish-neutral
30-day outlook — bearish
90-day outlook — bearish