

Summary for week of October 10 – 14
Summary for week of October 10 – 14
- Stocks likely to decline this week around Tuesday’s Full Moon; US unlikely to match previous low; India could retest support
- Euro to weaken midweek on Saturn influence; October rally unlikely to be strong
- Crude bearish this week; probably in down trend in November
- Gold could decline sharply this week week; unlikely to recapture $1750 anytime soon
What a wild and strange week. After bottoming on Tuesday morning, stocks rebounded strongly last week as the ECB announced its own version of quantitative easing in order to stem the banking crisis in Europe. Despite making a new low for the year on Tuesday, the Dow gained 2% closing at 11,103 while the S&P500 finished at 1155. While I thought we could see some upside on Tuesday’s Venus entry into Libra, this bullish result was very surprising. I did not expect to see the early weakness to manifest ahead of this Venus influence. Moreover, the Venus energy completely overshadowed the Mercury-Saturn conjunction on Thursday. The market extended its rally right into Friday’s Venus-Neptune aspect and we only saw some selling after a morning spike higher.
The Tuesday morning low of 1074 on the SPX now looms large. While we got the much sought after lower low that broke below the Aug 9 low of 1102, prices rebounded so strongly that it seems likely to me that the interim low could be in for this month. I thought we had a good chance of putting in a new low sometime in October, but I did not expect it to occur so soon — on the 4th! I also thought we had a decent chance of getting down to 1050 or lower. This hasn’t happened and I now doubt it will until November at the earliest. I think some kind of rally is likely now partially for technical reasons (see below) and also because the bearish Saturn-Ketu aspect is separating, and hence weakening its ability to do damage. It was exact in the last week of September and so we may have bottomed just 7-10 days after that. Pretty close. The inability for any downside at all during Mercury’s transit to this Saturn-Ketu pairing last week was proof that it is rapidly weakening. The Sun makes the same transit to Ketu and Saturn this week. I expect more downside this time because there are some additionally negative aspects in the mix. It is perhaps not surprising that with Saturn on the wane, the ECB cobbles together a quantitative easing package which the market embraces fully. Clearly, the skeptical pessimism of September has been replaced by a more hopeful — or is that deluded? — mood in October. I wonder how long it will last. In addition to Saturn’s growing weakness, Jupiter appears to be strengthening ahead of its aspect with Pluto at the end of October. I had mentioned the probability of some bullishness ahead of this aspect but did not quite expect it to manifest so soon and so powerfully. While Jupiter is strengthening, I still don’t expect the rally to be powerful. It will likely only amount to a bear market rally. Forceful enough to frighten bears in short positions, but not enough to change the main direction of the market. The longer term outlook for the market still seem quite bearish from both a technical and astrological perspective.
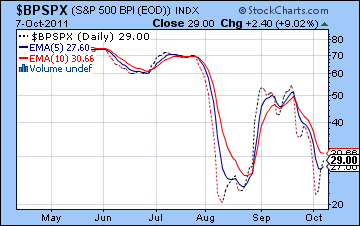
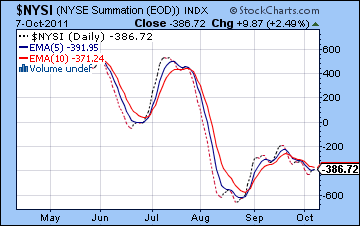 The technical picture has grown more complicated. We got the lower low thus satisfying the bear market expectation of a breakdown in that two month long bear flag pattern. But the rebound occurred so quickly, that there is some reason to think that the low is in for the short term. While the medium term sell signal on the Summation Index ($NYSI) is still valid, there are a number of divergences that suggest that the bears have run out of steam in the short term. The RSI and MACD both show a telltale higher divergent low suggesting the selling pressure is slackening. Like the $NYSI, the Bullish Percentage chart ($BPSPX) is still showing a sell signal as it remains below the 10-day EMA. But this is a more intermediate indicator and often lags the market. It is also subject to many whipsaws when the market is going sideways as this one clearly is. It also did not make a lower low on Tuesday and this set up a positive divergence. How high could this rally go? So far, it is respecting the falling trend line from the July and September highs. The rally actually culminated very close to that line on several indexes as bulls became jittery about pressing their luck. The 50 DMA is another key level of resistance at 1177 (the 50-day EMA stands at 1187) so we could see attempts to test these levels in the coming week. If we get a close above the trend line and the 50 DMA, then that would definitely make things more bullish and would open up the possibility of a move to 1200-1250. I think this is quite possible, although I am uncertain if it will happen October or November. A lot will depend on the extent of the pullback we get this week. A pullback to 1100 would be more bearish, but if the SPX stops its decline at 1120 or higher, then it would suggest somewhat greater strength going forward.
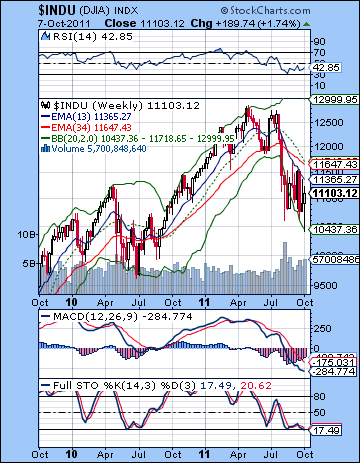 The bulls can claim a short term triumph here as MACD has now moved into a bullish crossover. Stochastics is also in a bullish crossover and moving higher. Prices could move a little higher here and retest resistance at 1170-1180 but the falling volume towards the end of the week was a possible sign that the rally was weakening. Of course, the bear market logic is still intact as we have seen a series of lower lows and lower highs since the Aug 31 high. So if the SPX does not put in a high above 1195 (i.e. a lower high), all eyes will be on the next low and whether it takes out 1074. I don’t think it will, at least not in the next week. More likely it will bounce off support, perhaps at 1120 or 1100. Many bearish blogs seemed to be backing off their hopes for 1050 in the near term and have postponed the next leg down. That may or may not seen as a contrary indicator! The weekly Dow chart still shows why we are in a bear market: the 13 and 34 week EMA are in a bearish crossover. However, this week’s candle was a long-tailed inverted hammer which is more commonly found in reversals higher. It still requires confirmation next week by a higher close but no doubt many bulls are expecting to keep prices back within the previous trading range of 1100-1220. No bullish crossover yet on either the Stochastics or MACD indicating that the medium term trend is still down. Many technical analysts are expecting a right shoulder to form around 1200 which would mirror the high from April 2010. This is a plausible scenario, although it is important to remember that both shoulders needn’t be equal. We could still climb to 1250 and have an upward tilting pattern.
This week will be an important test of the fading energy of Saturn. Mercury’s conjunction with Saturn produced more upside, suggesting that Saturn was completely spent in its ability to depress prices. The Sun-Saturn conjunction occurs on Thursday and therefore offers a good opportunity for more downside. I am somewhat more confident about downside here because Venus is less prominent now, hence it may have less capacity to take the market higher. That said, the early part of the week has a chance of being bullish. Mercury enters Libra on Monday where it will join benefic Venus. Both planets will therefore come under the influence of Jupiter. On the other hand, the Sun will be rapidly weakening as it forms an exact aspect with Ketu. This may result in some choppy action, perhaps like we saw on Friday. Tuesday’s Full Moon could be very bearish as it occurs just one degree from an aspect with Saturn. And despite the bearish influence around the time of Thursday’s Sun-Saturn aspect, there will be a very bullish aspect involving the Moon, Venus and Jupiter. How these conflicting energies play out is unclear, although I would lean towards a bearish outcome overall. Friday also looks bearish as Mars forms an aspect with Rahu. Since the market is a little overbought here, it seems more likely to see a retracement lower before it moves higher again. And certainly some of the aspects this week would support that view. But the presence of some offsetting bullish energy suggests to me that the downside potential here may be fairly modest. I therefore would be surprised to see a decline all the way to 1100, although 1120 is more doable and 1140 a virtual given. Even this fairly modest pullback may not last for long. I think the market will have an upward bias until October 24th and the exact Jupiter-Pluto aspect. This suggests that dips will be bought as eager bulls push it higher and trapped bears will hit the eject button. For this reason, I will not be hugely disappointed if we end up moving higher on week.
 Next week (Oct 17-21) looks fairly bullish, especially early in the week as Mercury is in aspect with Jupiter. Jupiter is moving closer to Pluto so that is another mark in the bullish column. But the rally could be thin ice here as the end of the week could see profit taking as the Moon conjoins Mars. It is possible we could see an interim high during this week, although I am uncertain if it will be higher than 1170 that we saw on Thursday the 6th. This will set up a pullback for the last week of October that should be significant. Mars is in aspect with Saturn on the 25th, and then Mars aspects both Mercury and Venus on the 27th. It could be a spooky Halloween for the bulls! I doubt this will form a lower low than 1074, however. Probably it will test support again at 1100 or 1120. Then the first week of November should see some rebound as Mars approaches its alignment with Jupiter and Pluto. At the same time, Saturn enters sidereal Libra on November 14, so that could undermine some of the risk-taking. November therefore has some difficult aspects which are likely to reduce the upside to any rally attempt and could easily see a decline to retest previous support. There is a possibility we could form a lower low at this time. I wish I could be more categorical about it, but at this point, I can’t. Late November and early December could see another rally, although this is also unlikely to get very far. Late December and January still look very bearish and will likely produce a major move lower that will decisively take out the 1074 low if it hasn’t been taken out already. This period looks likely to produce lower lows. 1000 is very possible by the end of year, although we could be much lower than that. Sometime in January or February, we should see a significant rally take place. It is unlikely to reverse the overall down trend, but it may nonetheless mark a significant move off the bottom.
5-day outlook — bearish-neutral SPX 1140-1180
30-day outlook — bearish SPX 1100-1140
90-day outlook — bearish SPX 900-1000
 Stocks slumped last week as fears about a global economic slowdown continued to undermine confidence. Despite Friday’s post-holiday rally, the Sensex lost 1% closing at 16,232 while the Nifty finished at 4888. While my bearish expectation for the week was fulfilled, the week did not quite play out as I imagined. I expected more early upside on the entry of Venus into Libra which occurred on Tuesday. As it happened, the market fell all through the first half of the week. This was perhaps a reflection of the more specific afflictions to the BSE horoscope. Significantly, global markets did rebound starting on Tuesday in the US. Friday’s recovery in Mumbai coincided fairly closely with the Venus-Neptune aspect as Indian markets finally caught up to global cues after the Thursday closing.
As I have noted recently, the Saturn-Ketu aspect is now separating. This suggests that Saturn may be losing strength and this could have bullish implications for equities. As an example for this rosier view of the things, the ECB came forward last week with a new round of quantitative easing that is designed to keep the banking system liquid and prevent the current debt crisis from worsening. For the most part, the market has bought this latest solution as European stocks rallied strongly last week. Can it last? I very much doubt it, although there is a good chance that these coordinated central bank efforts could forestall the crisis for another month or two. Just how much stocks can rally is harder to say. As October progresses, we should see more evidence of a weak Saturn as declines will tend to be smaller. And as I have noted in previous newsletters, Jupiter is due to form an aspect with Pluto in late October. Jupiter is a bullish planet of confidence and optimism and its aspect with Pluto here suggests that efforts to shore up the banking system may bring some positive results, at least for a while. So with Saturn on the wane and Jupiter on the rise, the astrological stage is set for more upside. Just how far it goes and how long it lasts is less clear. The BSE horoscope is suffering under some heavy afflictions now so it is possible that upside will be fairly modest. Saturn will soon be moving into the 1st house of this BSE chart in November so that could further depress sentiment as we move into 2012. The longer term cycles also appear to be more bearish for the next 12-24 months so that is another factor to consider. For example, the multi-year Uranus-Pluto square aspect is still in effect until 2013. This is a bearish influence and points to ongoing disruption and re-organization of the world’s economic system. All in all, the astrological picture does not look bullish at all. Since the medium and long term technical picture is also looking quite weak, there are few compelling reasons to buy the stock market for the long term at this time.
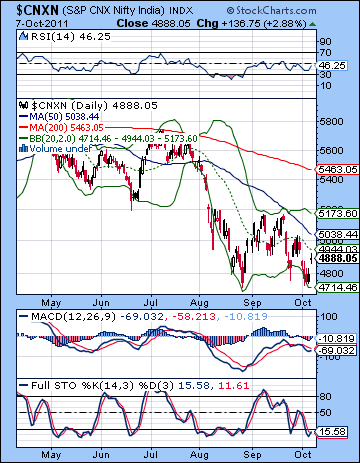
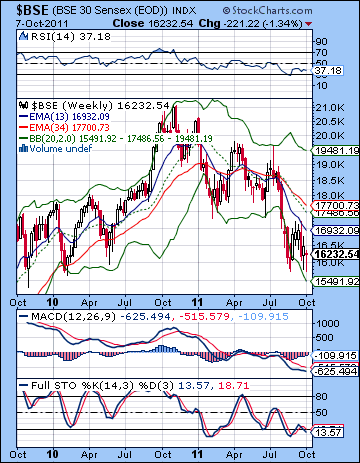 Despite another bearish performance, the market did not suffer much additional technical damage. The early week decline retested support at 4750-4800 and the lower Bollinger band. This also represents the 38.2% Fibonacci retracement level from the 2010 high. This support held and thus we now have a bullish double bottom in place from which another rally attempt can be launched. Friday’s positive session once again tested resistance at the 20 DMA at 4944. MACD is still in a bearish crossover and is pointing to lower prices ahead. On the other hand, Stochastics has commenced a bullish crossover, suggesting some near term gains are more likely. The bulls can find some safe harbour at these levels as long as 4700 is not violated on the downside. Resistance is formidable above 5000, however as any rally to the downward sloping 50 DMA at 5038 will likely cause weak bulls to cover their longs.
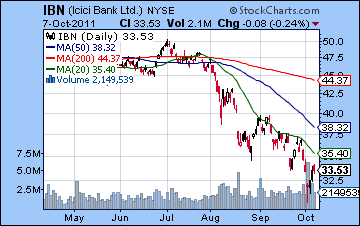
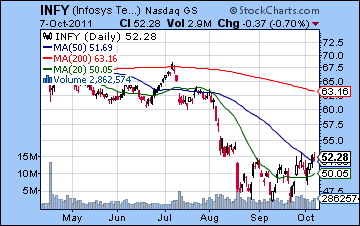
The overall situation still looks very bearish. All three moving averages are still sloping down and price is below all three. Until we see the Nifty move above at least the 50 DMA, the market will remain vulnerable. Perhaps the market could be considered oversold, however, and hence due for a bounce. That may be what happened on Friday. But RSI is still not below the 30 line so the Nifty is not as oversold as it could be. The gap at 5200 may be the line in the sand here since the market has been unable to recapture that level for the past two months. The longer this situation persists, the more unlikely the gap will be closed on any rally. The BSE weekly chart remains solidly bearish also as the 13 week EMA is below the 34 week EMA. Price is still hovering near the bottom Bollinger band and MACD remains in a bearish crossover, albeit with shrinking histogram bars. Stochastics are still oversold and in a bearish crossover. RSI is falling and shows a series of declining peaks that confirms the downward price trend. At this point, there is isn’t much the bulls can hope for other than technical bounce that begins to build a bottom. ICICI Bank (IBN) was lower last week as it continues to drift away from the 50 DMA and make lower lows. Even more bearish was the fact that Tuesday’s sell-off occurred on high volume. The stock appears to still be in the grips of a nasty bearish decline where the 20 DMA is acting as resistance. Few signs of hope there until it can make a higher low and move above the 20 DMA. Infosys (INFY) had a better week as outsourcers showed renewed strength on the falling Rupee. There is evidence that a meaningful bottom has been put in and a rally attempt is underway. This week’s close above the 50 DMA reflects this optimism and promises higher prices in the near term. With a strengthening US Dollar likely for the medium term, Infosys is likely to do comparatively better.
 This week looks like a mixed bag. We get another dose of Saturn as Sun’s conjunction on Thursday is likely to depress prices at some point this week. There are a range of positive and negative aspects this week that make the intraweek patterns somewhat unclear. On Monday, Mercury’s entry into Libra should be a bullish influence. But at the same time, the Sun is in aspect with malefic Ketu. These aspects may cancel each other and produce a mostly flat day. Alternatively, they may manifest sequentially. The more likely sequence is for a rise to precede a decline so Monday may be more bullish than Tuesday. Wednesday’s Full Moon occurs with the Sun just one degree from Saturn so that may be quite bearish indeed for the midweek period. Thursday is actually a fairly complicated affair as the bearish Sun-Saturn conjunction occurs simultaneously to a very bullish Moon-Venus-Jupiter alignment. This is a tough call, although I would lean towards a bearish morning and a bullish afternoon and close. Friday seems a similar blend of positive and negative although this time the negative comes from a nasty Mars-Rahu aspect. This tilts the probability to a negative outcome at the end of the week. These short term aspects seem more bearish than anything else, and yet we somehow have to balance them with a bullish medium term influence, namely, the Jupiter-Pluto aspect that is exact on 28 October. This creates a more bullish backdrop against these bearish aspects can play out their energies. I would still lean bearish this week, although I will not be surprised by any outcome. Perhaps we could see an early week run back to 5000 and then down to retest support at 4750 in midweek. Even if Thursday is bullish (a big if), then Friday could see the Nifty still mired in the 4750-4850 range. This is pretty much where it is now although it may be a struggle to stay there.
 Next week (Oct 17-21) could begin positively as Mercury is in aspect with Jupiter. The Sun’s entry into Libra on Tuesday is also likely to be bullish since the Sun will come under the influence of Jupiter. Some midweek weakness is possible, but the bulls may return on Friday on the Moon-Mars conjunction. Overall, this week could be bullish. The following week (Oct 24-28) looks more volatile, however. There is an unusually dense alignment of Mars, Mercury, Venus and Saturn throughout this week. With both malefic planets Mars and Saturn involved, there is an increased chance of sharp declines. At the end of the week, there is a very bullish pattern involving the Sun, Moon Jupiter and Pluto. This could either represent a quick snap back rally after a large sell-off or it may simply act as an accelerator for the decline. I tend to think it will simply be a rally after a sell-off. Big moves in both directions are therefore possible here. The first half of November looks mixed, although I would lean towards a bearish bias. There is a triple conjunction of Mercury, Venus and Rahu on the 14 November that could spell trouble for the market. This could be made even more significant since Saturn enters Libra on the same day. I have a generally pessimistic view of December and January. The BSE horoscope looks heavily afflicted by both Saturn and Rahu for an extended period. While rallies may occur, they will be short and weak. As I have been suggesting for several months, I think 4000 on the Nifty is very possible by the end of the year. A major rally looks likely starting in January and February.
5-day outlook — bearish NIFTY 4700-4800
30-day outlook — bearish NIFTY 4500-4700
90-day outlook — bearish NIFTY 3800-4300
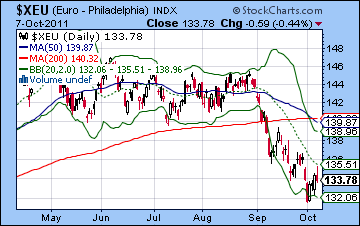 After a volatile week, the Euro finished mostly unchanged as the ECB maintained its current interest rates but undertook an extensive quantitative easing program. I was wide of the mark in last week’s call as I thought we would get more downside around the midweek Mercury-Saturn conjunction. Monday was lower but the Venus ingress into Libra appeared to cancel all other influences and the Euro rallied. My expectation for Friday gains on the Venus-Neptune aspect therefore anticipated this rise somewhat as profit taking emerged on Friday. I was correct in thinking there was a good chance of putting in new lows but these arrived on Monday rather than Wednesday and Thursday. The Euro actually looks like it is trying to rally here as there is a bullish MACD crossover and a bullish Stochastics crossover. RSI has been bottoming near the 30 line for a while but has climbed above it finally. These are actually some fairly reasonable technical bases for a rally. But it still has yet to clear the 20 DMA which is acting as strong resistance. Friday’s intraday high rallied up to that level and then reversed lower. It therefore may take more than one attempt to get above that line. Friday’s candle was bearish with a negative close and a long upper shadow. The Euro daily chart also saw a cross of the 50 and 200 DMA which is seen by some as a signal of a bear market.
This week looks bearish as Tuesday’s New Moon is just one degree from an aspect with Saturn. This is likely to increase pessimism and put the risk trade out of favour. Given the risky nature of the Euro these days, that could spell retreat. Some gains are possible on Monday after the entry of Mercury in Libra. However, I tend to think that the subsequent declines will overshadow any preceding gains. Wednesday could see a follow through on the downside but there is also a possibility of a reversal higher. The Moon-Venus-Jupiter alignment is closest on Thursday but could lift the Euro late Wednesday. But Friday’s Mars-Rahu aspect looks quite bearish, so that is likely to undercut any gains on Thursday. Overall, the astrological analysis suggests there is more downside risk here. The technical picture is less negative, but I would still lean towards a bearish outcome. The Euro may well strengthen in the next couple of weeks as the Jupiter-Pluto aspect becomes stronger. I do not expect a major rebound but it could get back to 1.36-1.38. But the end of October and early November could bring another setback which is likely to retest recent lows. 1.29 is possible sometime in November. After a two or three week rally, another decline looks likely in December and January. This is the one that could really pull the rug out from the Euro and take it down to 1.25 or lower. This could be big.
Euro
5-day outlook — bearish
30-day outlook — bearish
90-day outlook — bearish
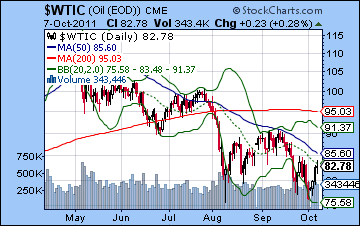 As the ECB poured more liquidity in the banking system, crude posted some strong gains finishing above $82. Although I expected some kind of rebound rally was possible, I thought the midweek would be more bearish. As it happened, crude put in a low below $77 on Monday and rebounded from there. It is still vulnerable here since it put in a low which was below the previous week’s low. However, it may have created a potentially bullish double bottom with respect to the Aug 9 low. Other technicals paint a similarly bullish picture in the short term. MACD is in a bullish crossover and shows a positive divergence with respect to the Aug 9 low. Stochastics is also in a bullish crossover and has moved above the 20 line. RSI is venturing to climb above the 50 line. A previous attempt to do so failed to take hold as prices fall back below $80. This time could be different but it has to be able to close above 50. Friday’s close tested the 20 DMA. This was a bearish signal, especially since the 20 DMA is sloping downward. There is significant resistance around the $83-85 range where both the 20 and 50 DMA reside. Horizontal resistance is likely found around the $90 level should crude climb that high. So the technical picture looks short term bullish.
This week the planets look more bearish. Tuesday’s Full Moon near Saturn is unlikely to shine a pleasant light on crude. Monday could conceivably be higher on Mercury’s entry into Libra, although I would think the subsequent Full Moon on Sun-Saturn conjunction will erase the previous gains and then some. Thursday could be positive on the Moon-Venus opposition but Friday looks bearish again as Mars-Rahu are in aspect in water signs. I would expect $80 to be breached on the downside with a possibility of revisiting last week’s low. There is a chance for more upside next week but the planets look equivocal for the end of October. Generally, they look bearish, but there is an absence of affliction in the crude futures chart so I am reluctant to forecast more downside. Similarly, the planets in early November seem bearish, but this does not show up clearly in the futures horoscope. This somewhat reduces the confidence I would have in calling for a bearish bias during this period. In any event, such a bearish move would suggest a retracement back to perhaps $70 by mid-November. December and January also have a bearish bias as the US Dollar is likely to rally further. This will put commodities such as oil out of favour. An eventual decline to $60 is possible by January.
5-day outlook — bearish
30-day outlook — bearish
90-day outlook — bearish
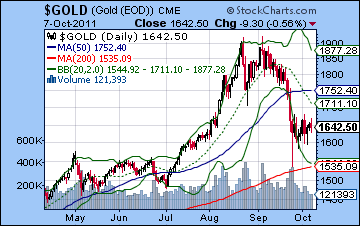 Gold rebounded last week as the ECB’s quantitative easing plan renewed inflation fears and boosted bullion’s safe haven appeal. Despite testing support at $1600, gold rose 1% closing at $1642. While I was correct in thinking that gold could rally on the strong Venus influence here, it was weaker than expected as $1700 was never really in the cards. Gold appears to be forming a base from which to begin a rally but so far is hasn’t done much. The fact that it couldn’t muster up much of a rally despite the entry of Venus into Libra is perhaps a telltale sign just how weak it is these days. But the chart appears to be aching for a rally here. MACD is about to enter a bullish crossover and Stochastics already has as it has climbed above the 20 line. RSI has also been rising since its adventure to the 30 line two weeks ago. Resistance may be around the 20 DMA which is still as high as $1711. The second line of defense for the bears would be the 50 DMA at $1750. It may be hopeless to expect gold to move past either of those levels given its current funk. Support is likely around the $1525-1550 level and the 200 DMA and lower Bollinger band. There is also some significant horizontal support at that level. The rising trend line support also comes in around the $1550 so it is quite likely that buyers will flood into gold if it corrects to that level. In the event of a more protracted correction, it could fall to its long term trend line which would put it around $1200-1300.
This week does not look positive for gold. Monday’s entry of Mercury into Libra could lift prices temporarily but things get sketchy after that. The Full Moon is slated for Tuesday and it could shake things up. The proximity of Saturn to the Sun at this time should be seen as bearish until proven otherwise. The Sun is also very close to an aspect from Ketu early in the week, so that could even undermine the rally potential on Monday. We should be able to squeeze at least one up day out of the Moon-Venus-Jupiter alignment on Wednesday or perhaps Thursday. Friday’s Mars-Rahu aspect could see a big move, although a bearish outcome is more likely than bullish. We could see easily see gold fall back to $1550 here. Next week should see gold rise as the Sun enters Libra. The early week looks the most bullish. Late October is hard to read as the aspects could go either way. November and early December may be somewhat mixed but a major rally looks unlikely as Saturn enters Libra. The downtrend is therefore likely to stay in place until at least January. The larger declines look more likely to occur in December and January. While some October or November rallies may try to recover the 50 DMA at $1700, I am unsure if gold can rally back that high. It may even have a chance to fall back to $1300 and its long term trend line.
5-day outlook — bearish
30-day outlook — bearish-neutral
90-day outlook — bearish