Summary for week of November 14 – 18
Summary for week of November 14 – 18
- Stocks subject to large move early in the week; mixed to bullish for rest of week
- Euro still vulnerable early this week but could be mixed in second half
- Crude may decline early but rebound later in the week
- Gold more vulnerable to declines early
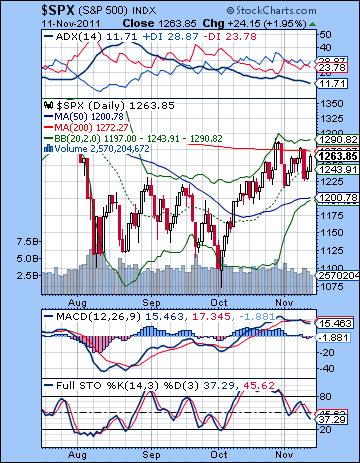 Stocks enjoyed a modest rebound last week as the Eurozone backed away from the precipice. Despite Wednesday’s plunge, the Dow gained about 1% closing at 12,153 while the S&P500 finished at 1263. This was a confusing week. While I was correct in expecting some significant downside around the Mars-Neptune opposition and the Mercury-Venus-Saturn alignment, I did not foresee the upside potential on Monday and Tuesday. When we finally got the full force of the Neptune direct station on Wednesday, stocks sold off sharply. Alas, this was somewhat later than anticipated. The late week was stronger as expected, and the extent of Friday’s gains was somewhat surprising. Overall, the week was disappointing and suggested that the bearish aspects are not manifesting as strongly as I would have thought. As a result, the pullbacks have been somewhat shallow and the rebounds stronger. And yet the market still remains in a consolidation pattern after the Oct 27 high.
Despite the relative resilience of the market, the general financial picture looks troubled and offers a real possibility of fulfilling my bearish expectations in the medium term. The worry over Greece has quickly shifted towards Italy now as it presents a greater problem for the Eurozone. Italy is both too big to fail and also too big to save given the current size and structure of the EFSF. Bond yields spiked beyond the crucial 7% level on Wednesday when the Berlusconi government appeared unwilling and unable to accept the EU austerity package. Although Berlusconi has now agreed to resign and the austerity package has passed the Senate, it is unclear if this solution will prove to be a lasting one. Of course, Italy and Greece may be able to muddle through somehow, but more observers now recognize the necessity of the European Central Bank to take a more active role. The EU is on a knife edge here where any unwelcome development threatens to derail the recovery plan and once again roil markets. From an astrological perspective, this kind of very guarded optimism (or hopeful skepticism) is broadly in keeping with the current situation in the sky. Jupiter’s bullishness may well have peaked at the end of October, but Saturn is not quite ready to take over the reins. Its entry into Libra this week has generated some pessimism over the past week or two but that has not really created much downside. So we are in something of a holding pattern until some new planetary energy takes hold. I think December looks more energized in this sense, as both Jupiter and Saturn will form aspects. That seems like a more likely time when we will see some more downside. In addition, we are entering the eclipse period shortly so that may also bring changes and interruption. A solar eclipse is due on Nov 25 and a lunar eclipse is slated for Dec 10.
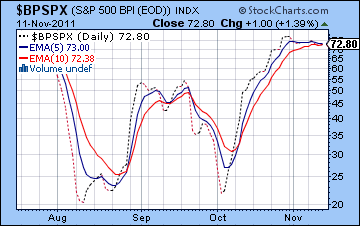 The market does seem to be trying to decide on its next move as it remains in this moderately bullish zone between support at 1220 and resistance at 1270/1293. We got a test of that support on Wednesday and Thursday as the bulls did an admirable job of pushing up prices back towards previous highs. The early week rally saw another test of the 200 DMA and the falling trend line. Friday’s gain came close to this level and actually was a back test of the rising trend line from the October 4 low. We are sitting at a very important resistance level right here. A close above the 200 DMA at 1272 and the falling trend line would be quite bullish and would increase the likelihood of a push to 1307 which is the 78.6 Fib retracement level. Although not probable, we cannot rule out such a move higher. But the trend indicators do not look healthy at the moment and are flashing a sell signal. Daily MACD is still in a bearish crossover, and the Bullish Percentage chart is also showing a partial sell signal as the 5-day EMA is in a bearish crossover. The Summation Index is still showing a buy signal, however, so we may have a little longer to wait there. Stochastics is still in a bearish crossover and has further downside to go before becoming oversold. It may only take one larger down day to accomplish that, however. The ADX returned to a bullish crossover as the blue line moved above the red line. So the daily chart is showing mixed signals but should not provide much encouragement for taking new long positions. That said, the short term trend is still up as price is above the 20 and 50 DMA and both are still rising.
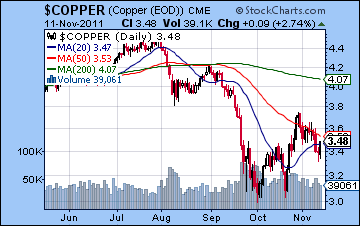
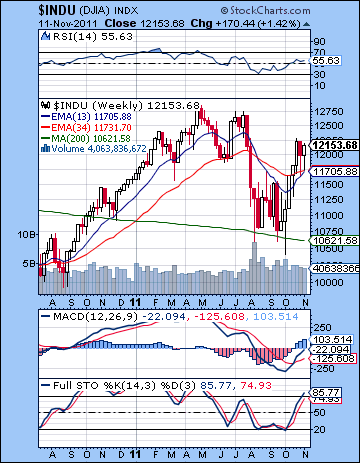 The Dow weekly chart shows how far this rebound off the lows has come. MACD is still in a bullish crossover and RSI has climbed all the way back to a respectable 55. However, RSI needs to keep rising here in order to break above resistance from a trend line from the previous peaks. Given the extent of the current rebound, it at least argues for more of a pullback. This week’s candle was another hanging man, although it is white and hence somewhat more positive. But there is still a measure of indecision in this candle that should give bulls some pause going forward. The 13 week EMA remains below the 34 EMA but only barely. It is quite possible that these may form a bullish crossover as early as this week. This would weaken the medium term bearish case although I don’t quite think it would be grounds for discarding it altogether. The 13/34 is not an infallible indicator. It is a lagging indicator which follows market direction only after they have occurred. It is however a useful tool for informing one’s overall trading stance and one still needs to form a comprehensive picture using several indicators. If it turns bullish while the market remains below key resistance at 1270 or 1293, then one would still have to be fairly cautious about starting any long positions. Meanwhile, bond yields are still low and are still suggesting caution in the market. Low treasury yields tend to suggest low growth and generally lower stock prices. Copper actually declined last week and may be following its falling 50 DMA lower. This does not support the notion that stocks can breakout higher from the current range.
This week features some significant aspects which could move markets in both directions. Monday tilts bearish given Saturn’s entry into Libra and the triple conjunction of Mercury, Venus and Rahu. The Saturn influence need not manifest exactly on the day of its ingress, however. Rahu is an unpredictable influence that is usually bearish but it can sometimes also correspond with large rallies. It is a magnifier of sorts and I would acknowledge the possibility that we could go higher on Monday. But on balance, I think this pattern is more likely to coincide with a decline, possibly a large one. I doubt we could retest 1220 but 1240 is quite possible. Wednesday’s Mars-Jupiter aspect is more solidly bullish so there is some reason to expect a recovery into midweek in the event that Monday or perhaps Tuesday is lower. While this is a reliably bullish aspect, it may be undermined by the Sun-Saturn aspect on Wednesday and Thursday. Like Saturn, the Sun is also changing signs this week as it enters Scorpio. This seems less positive so we could see any gains disappear quite quickly, even on an intraday basis. Friday looks more bullish as the Moon conjoins Mars and both come under Jupiter’s aspect. I doubt it will be enough to produce a positive week overall, however. But a lot depends on how Monday and Tuesday pan out. If we do see a big down day as I expect, then I think the week will finish lower. Probably we will close in the lower half the current range between 1220 and 1273.
 Next week (Nov 21-25) is Thanksgiving in the US so there is no trading on Thursday and only a half day Friday. Typically it is a bullish week will thin volume. I would tend to think it will be bullish here. Monday is a bit of a question mark as Venus enters Sagittarius and comes under the aspect of Saturn. The Venus-Saturn aspect is actually bearish, although Venus entering a new sign is bullish. So that could go either way. Friday has a somewhat better chance of being bearish actually as the solar eclipse will occur while Mars aspects the Sun and Moon. But I do not expect any big moves here in any event. Perhaps a slow melt up that stays under resistance at 1270. The following week (Nov 28-Dec 2) look more decidedly bearish as the Sun comes under the aspect of Mars. Venus conjoins Pluto during midweek so there is still some upside possible. But generally I think it will mark a return to volatility following the what I expect will be a relatively quiet Thanksgiving week. This is the time when there is a good chance to break below 1220. December looks more bearish as Saturn will move into its opposition aspect with Jupiter over the course of the month. This is a slow moving aspect so we still need to allow for more rally attempts. But I do think that we will see a more powerful down move. Where it stops is hard to say. I would be surprised if it only got down at 1140 which is the old head and shoulders target. It looks stronger than that, but we will have to wait and see. There are quite a number of close aspects involving these slow moving planets (Jupiter, Saturn, Uranus, Neptune) until January. We could see some big moves here although they are likely to produce moves in both directions. Saturn’s presence suggests the prevailing direction will be down. A major relief rally looks likely in February and March, although it is possible it could begin as soon as late January.
5-day outlook — bearish SPX 1240-1260
30-day outlook — bearish SPX 1200-1240
90-day outlook — bearish SPX 1000-1150
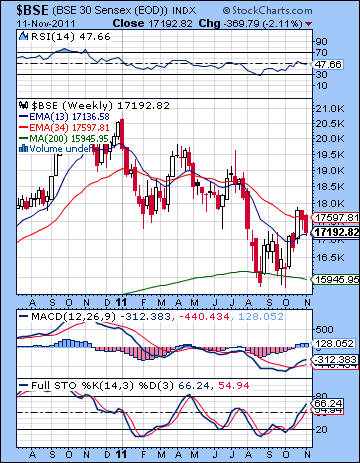
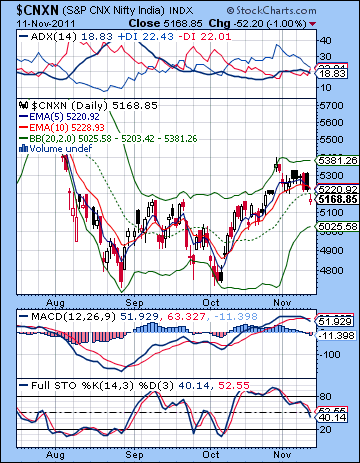 Stocks tumbled again last week on continuing uncertainty in the Eurozone and weak industrial growth. In a holiday-shortened week, the Sensex fell more than 2% closing at 17,192 while the Nifty finished at 5168. This bearish outcome was in keeping with expectations although the week did not unfold exactly as anticipated. I thought the Mars-Neptune aspect would create negative sentiment in the first half of the week but most global markets rose on Monday while Tuesday’s session was flat. Wednesday’s sell-off coincided fairly closely with the Neptune station which was the zenith of its influence as it finally activated the Mars opposition. I had been uncertain about Friday given the plausible arguments for both sides although I leaned towards the bearish outcome if only because Saturn appears to be growing in strength. As expected, we did test support at 5200 and Friday’s close broke below this level with conviction.
Sentiment remains captive to the Eurozone crisis which dragged on for yet another week amidst fresh resignations and new governments. While Greece has finally changed its government, the market appeared to have shifted its attention to Italy. Like Greece, Italy is too big to fail. But unlike Greece, it may be too big to save. The scale of Italy’s debt is much greater than the current EFSF can cover. As a result, the bond market began to demand a risk premium last week as yields soared above the crucial 7% threshold beyond which Italy would become insolvent. With Berlusconi offering no convincing commitment to the EU’s austerity package, Italy teetered on the brink on Wednesday. Berlusconi has since agreed to resign and the austerity package has been approved by the Senate, thus promising some breathing room for this troubled economy. The markets cheered all these new converts to austerity as Saturn approached its entry into Libra this Monday. While Saturn is generally a bearish influence on stocks, it is also important to recognize that it can sometimes accompany higher prices when austerity is demanded by the markets. If Jupiter is associated with growth and sometimes inflation, then Saturn symbolizes restraint and austerity. Indian markets have so far entered a period of consolidation in November ever since Jupiter’s influence has subsided after its dalliance with Pluto. This reduction of Jupiter has only occurred with a modest boost in Saturn’s impact, however, so we have not seen much downside. I think that will soon change as Saturn will begin to aspect Jupiter. In addition, the often volatile eclipse period begins 25 November with a solar eclipse and then continues with a lunar eclipse on 10 December. These factors suggest a move higher is quite unlikely and that we will retest the October low.
 The short term trend is now down as the 5 day EMA has crossed below the 10-day EMA. This reverses the bullish crossover buy signal from 10 October and should put all bulls on alert. Both remain above the 20 DMA (the middle Bollinger band) so momentum has yet to shift decisively. But it was mostly bad news for the bulls last week. The previous retest of the resistance level at the 200 DMA (5375) and the falling channel has produced a retracement lower. This was perhaps to be expected in any event. However, the bulls were not able to keep the Nifty above 5200. While not critically important, it was a sign of the weakness of the market. Worse still, we got a bearish MACD crossover last week. Combined with the test of resistance, this does not make long positions appealing. We should now watch the 5200 level to see if former support now acts as resistance in the event of any rally attempts.
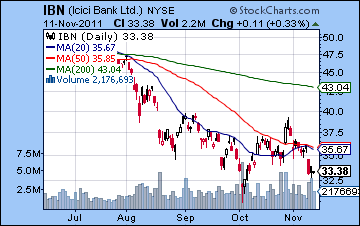
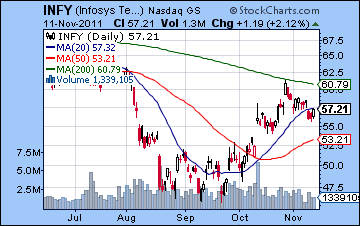
More downside seems likely in the near term as Stochastics are in a bearish crossover and have further to fall before being oversold. ADX is still in a bullish crossover, however, suggesting the trend may not have conclusively turned lower yet. The next support level is probably near the lower Bollinger band at 5025. This is also fairly close to a previous low from 18 Oct. If that level should fall, then the way may be cleared to retest the October low of 4747. The weekly Sensex chart still shows some signs of life. MACD is still in a bullish crossover since October and is a very good indicator for the durability of this recovery rally. However, MACD is forming a lower high with respect to the previous peak in July and suggests that it could well weaken again. If the histograms start to shrink, then this could roll over also. Stochastics still have a little way to go before becoming overbought, however. A bearish crossover here would preclude consideration of overbought status and could start a new move lower. Readers will notice that this indicator also turned lower in July before it was overbought. Medium term momentum is still bearish as the 13-week EMA is below the 34-week EMA. RSI is slumping once again and has fallen below the 50 line that divides bullish and bearish trends. The banking sector remains under pressure as ICICI Bank (IBN) was lower last week as it appears to be revisiting its October low. While volume picked up for the positive days at the end of the week, this is not a good looking chart. The only hope is that it can form a double bottom at $31-32 and rally back from there. Infosys (INFY) is in somewhat better shape but its previous failed test of the 200 DMA looms large. It may support around current levels ($54) but it may also be forming an island top over the past month. A gap fill below $53 could usher in significantly lower prices.
 This week would again seem to favour the bears although there are also some positive aspects in play. Monday could be a day of big moves as Saturn enters Libra during a triple conjunction of Mercury, Venus and Rahu. The Saturn influence tends to make a decline more likely, although Rahu can sometimes surprise on the upside. I would therefore not rule out a major gain here, although I think a decline is the more likely outcome. Mars comes under the aspect of Jupiter on Wednesday and early Thursday so that may improve sentiment during midweek, perhaps as early as Tuesday. But the end of the week looks less positive as the Sun enters Scorpio. The problem here is that the Sun will form an aspect with Saturn which could produce some pessimism and caution, especially involving governments. Given the importance of European governments recently, this aspect will bear close watching. It is exact on Thursday. Nothing stands out for Friday, although I would lean bullish, especially in the afternoon as the Moon approaches Mars. Overall, we could easily see 5000 tested if Monday turns out to be negative as expected. According to this more bearish scenario, we would see a rebound into about Wednesday that would reclaim 5100-5150 and then bounce around near that level for Thursday and Friday. If instead we see the more bullish side of Rahu on Monday, the Nifty could climb to 5300 quite quickly and end up retesting resistance at the 200 DMA by Friday. I don’t quite see that happening, but I’m not yet convinced that Saturn is strong enough yet to take the market substantially lower. This could allow for little rallies to pop up in the meantime.
 Next week (Nov 21-25) looks mixed at best as a bearish Venus-Saturn aspect starts the week. While this does not look powerful, it could still be a drag on stocks. Mercury turns retrograde on Thursday while in close proximity to Rahu so that is another source of caution. Again, this does not look that strongly negative, but it would tend to reduce the amount of optimism available for any potential rally. The following week (Nov 28-Dec 2) looks somewhat worse. The Sun moves closer to its square aspect with Mars. This is a fairly reliably bearish aspect that is in effect for the whole week. The midweek Venus-Pluto conjunction might offer some upside relief but Friday’s Mercury-Rahu conjunction looks quite bearish. December as a whole looks bearish as Saturn comes closer to its opposition with Jupiter. Jupiter concludes its retrograde cycle on 26 December so that may signal the end of this latest corrective phase. The down trend may stay in place beyond that date, however, as I can see a minor aspect between Saturn and Rahu in early January that could also be bad news for the market. It is worth noting that Saturn is also heavily afflicting the horoscope of the BSE at this time so that somewhat increases the likelihood of this major down move. That said, no prediction is ever certain and there is always a chance that we could rally through to the end of the year. I don’t quite see how that can happen, but it is nonetheless within the realm of possibility. A better case for a rally occurs in late January, February and March when Jupiter is moving away from Saturn and forming another aspect with Pluto. The Jupiter-Pluto aspect was one of the keys behind the October rally.
5-day outlook — bearish-neutral NIFTY 5100-5200
30-day outlook — bearish NIFTY 4700-5000
90-day outlook — bearish NIFTY 4500-5000
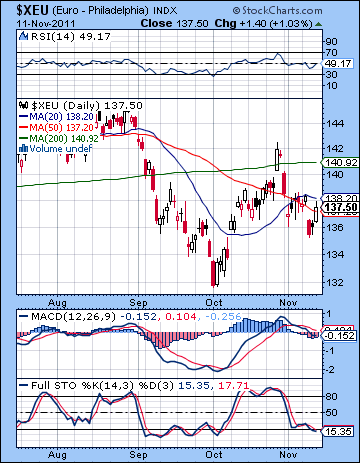 As Greece and Italy strictly adhered to the demands of their German paymasters, the Euro struggled to keep its head above water closing unchanged just below 1.38. The US Dollar Index again finished around 77 while the Rupee weakened to the 50 level. While I was correct in expecting more downside for the Euro here, I did not expect it could climb all the back by Friday. As expected, the Mars-Neptune opposition did produce significant weakness that tested and broke below the previous week’s low. The technical situation of the Euro remains as precarious as ever. MACD is still in a bearish crossover and is now heading below the zero line. While Friday’s gains closed Wednesday’s massive gap, one wonders if the 50 DMA will act as resistance. The 20 DMA (middle Bollinger band) may also be acting as resistance and it lies just above at 1.382. While this chart has already had a death cross of the 50 and 200 DMA, the 200 DMA is only flattening out now. When the 200 DMA begins to fall, it may chase away the bulls that much faster. Stochastics is still oversold and in a bearish crossover. Given the huge bear market in the Euro, this is perhaps less important at the moment. Bulls need to boost the Euro back over 1.39 or else it seems a revisit to the October lows will happen pretty fast. We can also detect the rough outline of a bearish head and shoulders pattern that has 1.28-1.29 as a downside target. This seems quite doable to me.
This week offers both bearish and bullish trends. The early week looks like it will favour bears as Saturn enters Libra and we get a triple conjunction of Mercury-Venus-Rahu. Rahu is the problem here as the shadowy planet has the potential to upset the bullishness of the other two. I am a little less certain of a bearish outcome, however, because the Euro horoscope does not look obviously afflicted. There are some possible trouble spots but nothing as clear as last week. So I am going into this week somewhat guarded in my downside expectations. Wednesday’s Mars-Jupiter aspect suggests some meaningful upside. Even if Thursday’s Sun-Saturn aspect is negative, Friday’s Moon-Mars-Jupiter alignment is more likely to be positive. Overall, there is a reasonable case for more downside although I would not be shocked if the Euro struggled back to 1.40 somehow. Next week looks more mixed with some early week downside possible on the Venus-Saturn aspect. This may not get too far, however, so I would not expect any great sell-off here. Probably we move sideways. After US Thanksgiving, things get more interesting. The eclipses could shake things up but we don’t have to look any farther than the Sun-Mars aspect from Nov 28 to Dec 2 for some bearish inspiration. This looks more clearly negative so we could see a large move lower here. December generally looks more negative so we should see 1.28 at least by December 16. February and March look much more positive for the Euro so I would expect some kind of rebound rally to occur then.
Euro
5-day outlook — bearish-neutral
30-day outlook — bearish
90-day outlook — bearish
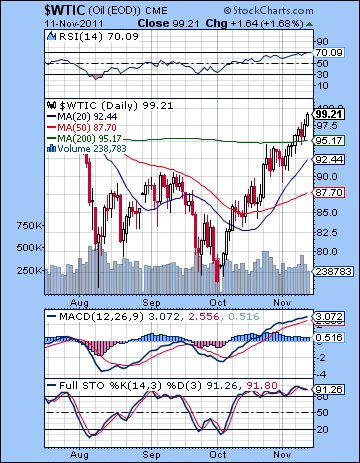 As nervousness grew over a possible Israeli strike on Iran, crude surged higher closing just under $100. It was a surprising turn of events in light of my bearish forecast for last week as I had expected the Mars-Neptune aspect to hit crude hard. While we did get some pullback on Wednesday at the time of the Neptune direct station, it was overwhelmed by the upside before and after. The late week gains were somewhat less unexpected, however. I have quite frankly missed this rally as I thought November would see crude mostly follow stocks to lower highs by month’s end. As geopolitical concerns combine with the ECB’s inflationary rescue policy, commodities like oil are moving higher as investors seek safe haven. Crude is looking more overbought now as RSI has tipped over the 70 line. Stochastics are still overbought of course and crude is running up against the upper Bollinger band. The $100 level is actually pretty strong horizontal support going back to July. I doubt that crude can clear that on its first try barring some actual Israeli attack. But Wednesday’s pullback revealed just how bullish crude is right now as it bounced off $95 and the 200 DMA. Resistance is now support. Any dips to $95 will likely be bought at least initially. Meanwhile the trend is up as the 20 and 50 DMA are both in a bullish arrangement and sloping higher. The longer crude can stay above the 200 DMA the harder it will be for the bearish case to hold water. Below $95, the 20 DMA at $92 seems to be acting as support in this recent run-up.
This week looks somewhat mixed. The early week offers the possibility for declines on the Mercury-Venus-Rahu conjunction on Monday. It could be a significant move down but it may not last. Perhaps it will only test the 200 DMA at $95. The midweek looks bullish again as Mars is in aspect with Jupiter. Thursday could conceivably tilt bearish but Friday is likely to be bullish again on the Moon-Mars conjunction. For this reason, I would not expect too much downside this week since rebounds look more likely. Perhaps we will stay in the current range of $95-100. I would also not be surprised to see a brief rally over $100 for that matter. Next week may continue this sideways action but I would expect more downside by Friday the 25th. Further declines are likely in last week of November and the Sun-Mars square aspect. Just where crude is at that time will be hard to say although I do think the down trend will be significant and will last until at least mid-December. We should see a significant rally into the end of December and into mid to late January. February and March look quite bearish.
5-day outlook — neutral
30-day outlook — bearish
90-day outlook — bearish-neutral
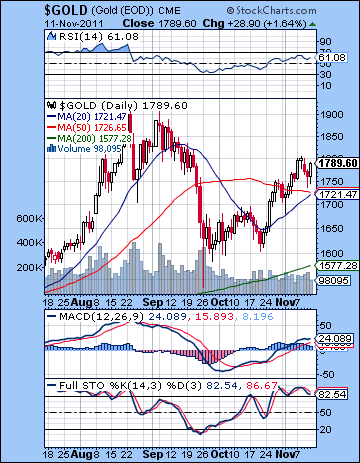 As all eyes looked to the ECB to buy up Italian bonds nobody wanted, gold rose another 2% as an inflation hedge. Despite some midweek weakness that took it briefly below $1750, gold closed near $1790. My forecast was wide of the mark here, mostly because I did not anticipate Monday’s strength. Gold rose despite the tight Mars-Neptune opposition that day. While I did allow for the possibility that this aspect could manifest later such as Wednesday’s Neptune station, I never fully explored the alternate scenario that a rise could precede the decline. Part of my problem is that I am anticipating the impact of this Saturn ingress into Libra which is due this week. I had expected a little more stress beforehand but it seems I was wrong. We may have to wait a little while longer until Saturn is fully in Libra so the new dynamic can take hold. Technically gold looks a little stretched at these levels. It is taking a run at the $1800 resistance level again but it is somewhat overbought. The trend is still up, however, as MACD is in a bullish crossover and RSI is above the 50 line. The 20 DMA is on the rise and price is above both the 20 and 50 DMA. Wednesday’s pullback tested support at those lines so we may see dips to this level bought by aggressive bulls seeking value. However, gold appears to be forming a bearish rising wedge pattern off its September low. A break below its bottom trend line at $1750 might invite the completion of this pattern with a waterfall decline. It’s not a strongly defined pattern but it is one possible interpretation of the chart.
This week will be an important test of Saturn’s effect on gold. Monday will see Saturn enter Libra just as Rahu conjoins Mercury and Venus. A sizable move here is more likely here, and the direction should be down, although it is also possible that we could see a gain. There is a good chance that we will see some downside here as the Sun forms a minor aspect with Saturn on Thursday. Gains are perhaps likely Tuesday and especially Wednesday as Mars is aspected by Jupiter. Friday also could be bullish as the Moon conjoins Mars. Given that gold is up against some resistance and the planets look iffy, there is a reasonable chance that gold will decline this week. That said, I would not be hugely surprised to see it hold steady or make another run higher to $1800. I do think gold will decline in the near term although pinning down just when that Saturn will manifest is more of an open question. Next week looks dicier as the Sun comes under the aspect of Mars. The second half of the week looks somewhat more bullish as the Sun is in aspect with Jupiter. The period starting Nov 28 looks more troubled for gold as the Sun-Mars aspect is that much closer. This is the most likely time for a significant retrace in gold. The corrective move should continue at least into mid-December. How low gold falls is hard to say, although a retest of the September low of $1550 is definitely possible and we could conceivably fall beyond that. Another rally attempt is likely in late December that continues into January. Another move lower looks likely for February and March.
5-day outlook — bearish-neutral
30-day outlook — bearish
90-day outlook — bearish-neutral

