

Summary for week of December 26 – 30
Summary for week of December 26 – 30
- Stocks likely bearish this week especially on Tuesday-Wednesday; down move is possible in January
- Euro to trend lower this week; correction likely to continue into January
- Crude may weaken, esp. late in week; January uncertain as rally is possible
- Gold likely to fall further; correction to continue into 2012
Stocks rebounded smartly last week as the promise by the ECB to undertake a significant bond buying program provided the necessary fuel for Santa’s liquidity-driven sleigh. The Dow rose by more than 3% closing at 12,294 while the S&P 500 finished the week at 1265. This bullish outcome was very much in keeping with expectations as I thought the various Jupiter aspects would likely lift prices. The forecast early week pullback also arrived on schedule as Monday’s Sun-Saturn aspect coincided nicely with a retracement back to SPX 1200. The bulls took over after that just as Venus was moving into position with bullish Jupiter. Thursday’s Sun-Jupiter aspect then provided the second upward thrust later in the week as bulls pushed towards major resistance by Friday’s close. I thought we might have seen more Friday selling on the Moon-Rahu aspect but most of the negativity had faded by the morning open in New York.
Despite my contention that we are still in the grip of austere Saturn, I was not surprised to see the ECB ride to the rescue here with its $600 Billion injection of liquidity. The boost from Jupiter last week as very much expected, especially in light of Jupiter direct station due this Monday December 26. That was bound to stack the deck for the bulls, even if it meant a certain amount of expansionary money printing. But will this improving mood continue into the New Year? I tend to think that Saturn has a few more bullets at its disposal, perhaps in the form further downgrades of France or even Germany. To some extent, these downgrades are already baked into the cake. A France downgrade seems to be widely expected now, for example. Perhaps Moody’s is waiting until after Christmas to deliver the bad news. A downgrade definitely has a Saturnian flavor to it since it warns of excessive debts and insufficient revenues. What matters more than these prudential cautions now is how the market will react to them. A modest decline may suggest that further downside is minimal and that is has already been discounted by the market. At the same time, it is important to remember that the implications of downgrades may not manifest immediately. Borrowing costs will likely rise for the nation in question, and as always the bond market may deliver the real news. Italy’s bond yields again went above 7% last week suggesting that the debt question is still unresolved and unstable. As long as Saturn is forming a tight opposition to Jupiter, it seems unlikely that the market can continue its recovery from the October low. This opposition remains roughly in effect throughout January, so the chances for a major breakout rally seem quite small. Indeed, the downside risk remains in focus here as this bearish pairing offers the real possibility for significant declines.
 The market obeyed basic technical support and resistance levels last week, with the bulls obviously claiming the upper hand for now. As expected, Monday saw support from 1200 tested from which buyers gradually bought up shares. I thought there was significant positive planetary energy on either Tuesday or Wednesday to produce a significant rally and I was not far wrong as Tuesday’s huge 3% rally again forced investors to shift their gaze upwards towards the resistance level of the 200 DMA at 1260. Friday’s thinly-traded session actually closed above the 200 DMA at 1259, a warning for bears that there is considerable buying power behind the current rally. Friday’s candle also pushed above the falling trend line from the July high and that may have likewise served to force some bears to cover shorts, thus accelerating the rise. To be sure, this is a significant technical defeat for the bearish case, although it comes with a large asterisk since the breakout above resistance has occurred on holiday volume. In the event that this rally pushes higher, the next major level of resistance would be the falling trend line from the May high which now comes in around 1320. It is important to note that even a push up to this level would not fundamentally change the nature of this as a bear market rally since it would produce lower highs. Nonetheless, higher prices always have the potential to continue higher than many people expect so that bear market rally suddenly becomes a genuine bull market rally. Another day or two closing above the 200 DMA would obviously be bullish, but a quick reversal lower would suggest that the market is uncomfortable at these levels as bulls take quick profits. This is what happened at the end of October when the rally pushed the SPX above the 200 DMA for only two sessions before reversing lower. As a possible sign of weakness, the broader averages such as the NYSE Composite and the Russell 2000 remain well below their 200 DMA. This is evidence that the rally is narrowing as the exuberance is limited to blue chips.
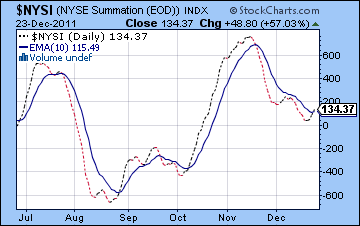
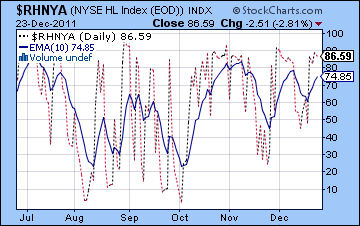
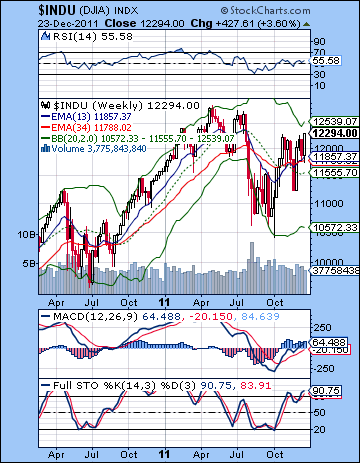 Last week’s gains produced a bullish crossover on the MACD while stochastics has now reached overbought territory at 80. This somewhat increases the chances that a pullback may produce more significant selling. RSI remains bullish but below the 60 level suggesting only a weak advance is underway. It also remains below the previous peak. Price has pushed most of the way up towards the upper Bollinger band (1278) suggesting that further upside will likely need some significant positive news. Given how close we are to resistance here, it is not surprising perhaps that the Summation Index actually got a bullish crossover on the 10-day EMA on Friday. Although this is a lagging indicator, it nonetheless supports the bullish view and establishing some positions on the long side. Of course, if we reverse lower next week as I expect, then the NYSI will likely move below the 10-day EMA and produce a sell signal. That is what often happens when the market is sitting at such critical inflection points. The High-low index ($RHNYA) appears to be close to a high and therefore suggests some pullback may be in the offing. The weekly Dow chart also shows a buy signal as the 13-week EMA crossed above the 34-week EMA. The Dow actually out-performed all other indexes as it matched its late October high. A close above this level would be bullish. The other technical indicators are also bullish. There is no doubt the market is now standing at a crossroads here. More upside would likely pave the way to 1320 if not higher. And yet since we are sitting at resistance now, a reversal could spell a quick end to the rally and open up the possibility for more downside surprises.
If the technicals are straddling the fence, the planets this week favor the bears. Jupiter’s direct station coincides with Monday’s holiday closing. That may be a blessing for the bears since it means that any positive sentiment will go for naught. This station means that Jupiter is not moving from our perspective on Earth and is extra powerful. It is possible it could mark a trend chance, if only because changes in directions of large planets can sometimes correlate with changes in market trends. This is anything but a certainty unfortunately, so we must abide by all the other factors in play. Tuesday and Wednesday look more bearish as Mercury conjoins Rahu. Tuesday looks like the more bearish of the two days, although I would not be surprised to see losses on both days. There is a chance that Tuesday will see a significant decline although that is not necessarily probable. Wednesday and Thursday feature a Sun-Pluto conjunction that also does not seem positive, although it is less obviously bearish than the Mercury-Rahu combination. I would not expect both days to be negative. Friday’s Moon-Mars opposition looks bearish, especially in the morning. That is a somewhat clearer influence that the Sun-Pluto conjunction. So we could see a pullback into Wednesday morning perhaps to 1240-1250 and then a rally attempt into Thursday that comes up short to, say, 1255ish, and then down again on Friday to 1240-1250. That is one scenario at least. There is a chance that the down days could be bigger than expected, especially since Jupiter is changing direction. But I can’t quite see the market selling off hard just yet. It wouldn’t surprise me, but it is not what I could call probable. A rally higher would be quite unexpected. Even in that case, the Jupiter-Uranus aspect is close enough that it could theoretically explain such a rally. Still, it does not seem like a high probability outcome.
 Next week (Jan 2-6) is the first week of 2012. (And no, I do not subscribe to the doomsday Mayan calendar scenario in the slightest!). Monday will be closed in observance of New Year’s, so Tuesday looks mildly bearish. We could see more broadly based selling based on the deteriorating medium term aspects like Saturn-Rahu, but it is hard to exactly pinpoint when these will manifest. The short term aspects look only marginally bearish but they could become amplified. It is important that this first week is bearish for the larger picture for a correction in January and into early February. If this week ends positive, then it would suggest that the market may be more range bound. That said, this week should be bearish. The following week (Jan 9-13) should begin bullish as Venus enters Aquarius. But stocks may slip towards the end of the week again as Sun approaches its aspect with Mars. I still expect January to be bearish on balance, as Mars turns retrograde on January 23. This is likely to be another negative influence and could generate another down leg that lasts into early February and Saturn’s retrograde station on 9 Feb. Alternatively, we could see the market only mildly bearish up to Jan 23 and then see the significant corrective move begin after this date. I tend to think the significant downside will commence in early January, however. It’s hard to say how low we will go. I would not rule out 1010 but I admit that seems increasingly unlikely. Perhaps we will have to content ourselves with more modest targets for now such as 1158 or 1100. A recovery seems likely to start sometime in February. This is likely to produce a more sustained rally into mid-March and the Jupiter-Pluto aspect on the 14th. While I admit I am little fuzzy about exactly how the January corrective move will play out, the rally looks more reliable into March. After mid-March however, the market looks vulnerable again. I am expecting the next bottom to occur sometime in June perhaps around the Saturn station on June 25. It seems unlikely that the market will fall all the way from March until June, although that is one possibility.
5-day outlook — bearish SPX 1230-1240
30-day outlook — bearish SPX 1100-1160
90-day outlook — bearish-neutral SPX 1200-1300
 Stocks rebounded last week after the ECB announced a significant bond buyback in an effort to stabilize the European banking crisis. The Sensex advanced more than 1% closing at 15,738 while the Nifty finished the week at 4714. This bullish outcome was very much in keeping with expectations as I thought the two key Jupiter aspects would generate some positive sentiment. My prediction for weakness early on also came to pass as Monday’s Sun-Saturn aspect corresponded with two down days. I had been somewhat uncertain when the bullish Venus-Jupiter aspect would kick in although I suspected it would be either Tuesday or Wednesday. It turned out it was Wednesday as stocks rebounded sharply off their lows following global cues higher. The market also stayed bullish into Thursday’s Sun-Jupiter as expected. Moreover, Friday’s Moon-Rahu conjunction produced some anticipated selling. Overall, the Nifty finished within the forecast range of 4700-4800.
Despite the ongoing strength of bearish Saturn here, last week’s injection of liquidity by the ECB was in no way surprising as a certain amount of money printing was likely. I have previously described how the growing strength of Saturn as seen in its opposition aspect Jupiter would tend to manifest as austere solutions to the debt crisis, as seen by Merkel’s insistence on a fiscal union that limited deficit financing available to EU member countries. Jupiter was highlighted last week so it was only fitting that the more inflationary approach of a bond buyback should have been attempted, even if it is not the "bazooka" that many market watchers are hoping for. As Jupiter is scheduled to station and reverse direction on Monday 26 December, we may well see more attempts by EU officials to inflate their way out of trouble. At the same time, the ongoing proximity of Saturn suggests that more warnings and caution are likely in the near term. There are more rumours circulating of a possible Moody’s downgrade of France and even Germany. While it is uncertain how the market will react to such a move (perhaps it is already baked in the cake), it does seem likely that we will get more negative news relating to high debt, slow growth, and falling profits for another few weeks. In market terms, this may mean that there will be continued downside risk until Jupiter begins to separate from Saturn in late January and early February. Until that time, therefore, a significant rally seems somewhat unlikely. Indeed, we will see an extended window for a significant decline. Just as nothing is certain in technical analysis, so too is astrology only probabilistic. The risk is there, but there is no guarantee that it will unfold according to the probabilities. But caution still seems like the best approach for the medium term.
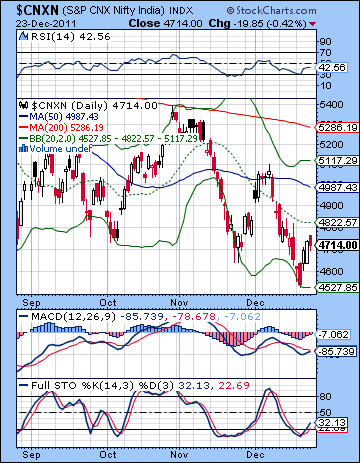
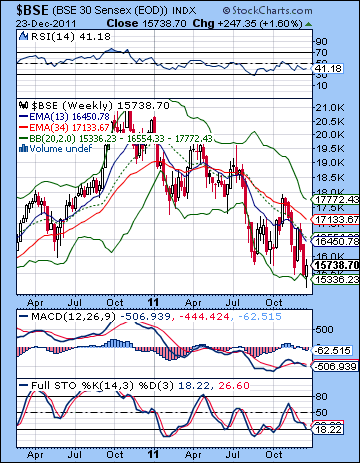 The bears made an important new low last week as the Nifty pushed below support at 4700. While it quickly recovered to the 4700 level later in the week, the damage was significant as it took out the low from mid-2010. Will 4700 now act as resistance? Perhaps, although we did push above that level late in the week so if the market can stay above 4700 early this week, perhaps the bulls can prevail. But another quick move below 4700 would increase the probability that 4700 is acting like resistance. This would be a very bearish development. MACD is in a bearish crossover although the histograms are shrinking indicating a slackening of the down trend. Stochastics also formed a bullish crossover and are above the oversold line. This is bullish technical signal. RSI remains bearish, however, and the series of lower peaks mimics price quite closely. The result is quite a mixed bag of indicators which do not favour bulls or bears especially. The moving averages remain in bearish alignment and all are still trending down. After touching the bottom Bollinger band early in the week, it is possible we could see the rally extend to the middle band at 4822 before reversing again. The lower low means the bulls need to break above the most recent high of 5100 in order to change the bearish dynamic. Support is now likely around 4500 although it is unclear how solid it might be. 4000 is more reliable support in the event the market sustains some shock-type event that sparks a widespread sell-off. I don’t think a downgrade of France would inflict that much damage, although a downgrade of Germany might.
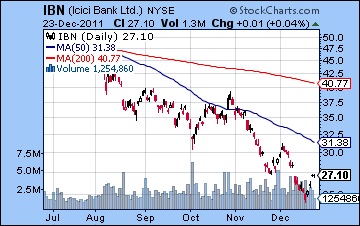
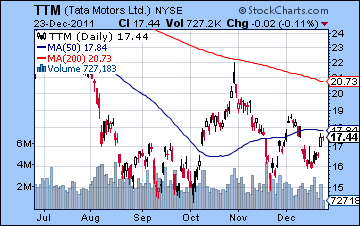
The weekly BSE chart still looks vulnerable to further declines as the 13-week EMA is below the 34-week EMA. The decline since November has been fairly orderly as it follows the bottom Bollinger band. We can see a fairly clear down sloping channel that features several touches of the upper and lower lines. The lower support line in the channel indicates support just under 15K suggesting that we may see more downside before a bounce. Stronger rallies have stopped at the upper Bollinger band while weaker rallies tend to peter out nearer to the 20 WMA. The upper Bollinger band now stands around 17,700 which is right near the previous high. This should be considered fairly solid resistance in the event of another rally attempt. MACD is still in a bearish crossover as is stochastics, although it has now moved below the oversold line. This may somewhat increase the odds for a more sustained rebound. The precariousness of the market is reflected in individual share charts. ICICI Bank (IBN) last week rallied to the previous low. This is a minimum sort of rally but until the gap is filled at $28, it seems less likely that a rally can go anywhere. As it is, the pattern of lower highs and lower lows dooms this chart from a technical perspective. Tata Motors (TTM) is somewhat healthier after a series of higher lows and lower highs but this has only produced a neutral triangle pattern. It could break higher of course, but it is unclear if it can do so. A close above the early December high would be bullish of course and could embolden bulls to add to their positions.
 The final week of 2011 appears to favour the bears. Monday tilts bullish, however, as Jupiter concludes its retrograde cycle and resumes its forward motion. This is often a bullish energy, especially given the close aspect with Uranus. But Tuesday’s Mercury-Rahu conjunction looks more bearish and could bring markets down, perhaps sharply. Wednesday could also be negative as Mercury will still be within range of Rahu. We should see at least one other up day this week. Perhaps this will occur on Thursday. I’m not sure since the Sun-Pluto conjunction does not look particularly bullish. In fact, it can be correlated with down days. The odds are somewhat higher for a down day on Friday as the Moon opposes Mars, especially in the afternoon. We could therefore see a significant down move on the last trading day of 2011. Given that the Nifty bounced off the bottom Bollinger band already, Monday could well extend the push towards the middle band. I do expect more selling so we could get a retest of last week’s bottom of 4500 by Friday. That is the more bearish scenario. If Jupiter turns out to be a little stronger than expected, then the Nifty could retrace down to 4600-4650 and close only slightly below current levels. While I tend to favour the more bearish interpretation that sees the Nifty finishing below 4600, I would not rule out 4700 again by Friday. I therefore expect a mostly unchanged technical picture with price to be below the 20 DMA and the moving averages to remain in their bearish arrangement.
 Next week (Jan 2-6) looks mixed although the possibility of more downside will remain. The problem is that Saturn is slowly moving into an alignment with Rahu that will negatively affect prices at some point in early January. What is less clear is exactly when this will occur due to the relatively slow velocity of both of these planets. In practical terms, this means that we cannot rule out a positive week here. Nonetheless, the probabilities do point to more downside. Plus, there is the added possibility of a major breakdown to the downside. Monday could be bullish, but the likelihood for declines will increase after that. The following week (Jan 9-13) will likely begin positively as Venus enters Aquarius on Monday. Some weakness is possible in the middle of the week but it is the end of the week that is more puzzling. A large move is possible here, although I am unsure of the direction. A Venus-Neptune conjunction is usually bullish but in this instance it occurs in close aspect with Saturn. This increases the likelihood of a negative outcome. However, it is by no means clear to me where this move will be. The Mars retrograde cycle begins on 23 January and this should be another source of nervousness in the markets. This is likely to coincide with another significant move lower until perhaps the end of January. It is difficult to say with any confidence where the low will be. 4000 is certainly possible, although it may well be somewhat higher than that. Recovery will likely begin in February and continue into mid-March and the Jupiter-Pluto aspect. Regardless of where the Nifty bottoms, this should be a powerful rally that rises at least 10-15%. Perhaps the Nifty will rebound to 5000 or even the 200 DMA at 5200-5300. It is conceivable that it could rise higher than that and match the October high. Another down move looks likely after that into April with possible recovery in May. June looks quite negative so we could well see a lower low put in at that time.
5-day outlook — bearish NIFTY 4600-4700
30-day outlook — bearish NIFTY 4200-4500
90-day outlook — neutral NIFTY 4500-5200
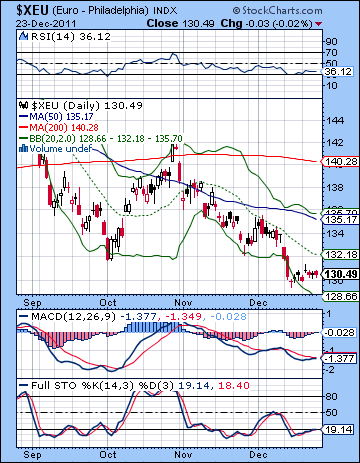 Despite the ECB loading up its liquidity bazooka and injecting $600 Billion into the banking system, the Euro finished unchanged on the week near 1.304. The Dollar Index closed slightly below 80 while the Rupee extended its recent weakness by dropping towards 53. All things considered this was a bearish outcome given the supposed good news it had at its disposal. After the expected early week sell-off, we did get the gains as forecast for the midweek on the Venus-Jupiter aspect but they were underwhelming to say the least. The Euro seems stuck here unable to even mount a challenge to its 20 DMA, that most humble of bear market targets. MACD is venturing to form a bullish crossover here but RSI looks pallid and unable to break out of a downward sloping channel. Stochastics are bumping along the bottom of the oversold area. Bears are banking on the fact that previous support at 1.32 is now acting as resistance. It’s a reasonable wager to be sure, although one would think a rally to the 20 DMA at 1.321 is doable at some point. As time goes on, the 20 DMA will slide below this critical resistance level so the bears can have their cake and eat it too. Until 1.32 is broken decisively to the upside, the Euro will continue to be sold. The Euro may be in the process of forming a downward channel. Support in this channel may be closer to 1.26 over the next few weeks.
This week looks bearish for the Euro. Jupiter could influence the proceedings early in the week and produce an up day on Tuesday but it seems more likely that the Mercury-Rahu conjunction that day will be bad news. I can’t decide if we will get a big down week or a more modest one. I am inclined towards a more moderate outcome, although there are enough planetary influences to suggest three out of four down days this week. Tuesday and Friday have a good chance of being negative, with the in between days splitting 50-50. Perhaps we retest the previous low at 1.29. Next week things could get interesting as the Saturn-Rahu begins to tighten along with the Saturn-Jupiter aspect. I am expecting another move lower in January with a possible bottom sometime near the the Mars retrograde station on January 23. That bottom channel support at 1.26 should be within range, and I would not be surprised to see something lower. The trend should shift to bullish sometime between January 23 and perhaps February 9 and continue into March. This rally could deliver a 50% retracement from 1.40, perhaps somewhere in the 1.32-1.34 range. Another move lower is likely into April although this could be range bound between 1.26 and 1.32. May and June, in contrast, look more bearish again with lower lows quite possible. Perhaps this is the time when we will see the Euro fall to 1.20.
Euro
5-day outlook — bearish
30-day outlook — bearish
90-day outlook — bearish-neutral
 Crude soared 6% last week as growth prospects and renewed Middle East worries combined to push prices higher. Crude finished the week just under $100. This bullish outcome was largely expected as the Venus and Sun aspects to Jupiter took effect through much of the week. I thought there was a good chance of testing the 200 DMA and allowed for the possibility that we could go higher. While the extent of the gains were somewhat surprising, the overall outcome was not. As impressive as the gains were, crude is still forming a lower high here and therefore offers the possibility of a bull trap at these levels. A quick reversal here and we could see the bearish pattern of a lower highs and lower lows take hold. Stochastics are climbing but are close to overbought now while MACD has yet to show a bullish crossover. While RSI has recovered, it has yet to break above its downward sloping resistance line from previous peaks. The chart is about to see a golden cross of the 50 and 200 DMA reflecting the recent strength since the October low. I am not sure how important this pattern this, especially in light of resistance provided by the falling trend line from the May high. Failure to break above that trend line would be bearish and would invite another trip to $90. Whereas a break above the trend line would be quite bullish and might give a lift to crude and push it back to recent highs of $103.
This week may be more bearish for crude as Tuesday’s Mercury-Rahu conjunction could produce some selling. The Sun-Pluto conjunction may be more bullish so an up day or two may occur on Thursday and perhaps Friday. Even if the bears prevail here, I would not expect a major down move. Perhaps only a retest of support at the 200 DMA at $95. January is more difficult to call. The transit picture looks fairly bearish given the Saturn-Rahu and Saturn-Jupiter aspects in play. And yet the Crude Futures horoscope actually suggests some upside is quite possible, even likely. That creates contradictory astro signals that make me reluctant to call any clear direction for January. We could see some selling in the first week, but the odds for some kind of rally increase by the second and third weeks of January. Since I am still expecting a sell-off in equities, I am not quite sure how this plays out. Perhaps it is geopolitical instability that produces a spike in crude prices and a decline in stocks. That is one possibility. If a rally in crude takes place, it is possible we could revisit the May highs of $115. It seems unlikely now, but it is something to consider. Late January and early February will likely see a significant decline in crude in any event. A correction is likely to continue through much of February with range bound trading into March and April.
5-day outlook — bearish
30-day outlook — neutral-bullish
90-day outlook — bearish
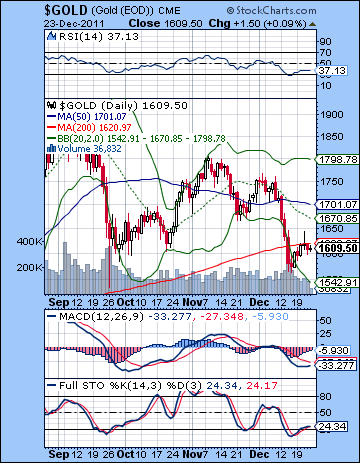 Despite the ECB’s best efforts to inflate European debt by buying back bonds on a large scale, gold could only muster the most modest of gains last week finishing near $1610. This was largely in keeping with expectations although I thought we might have seen more midweek upside. Monday was lower as expected on the Sun-Saturn aspect although the decline was quite modest. The weak rally was a reflection of the new reality in gold where sentiment has suddenly turned very bearish. A contrarian might want to take the opposite side of the trade and go long, but it is still early days here. Gold is now on the wrong side of the 200 DMA and unless it can close above it soon, it runs the very real risk of another leg down. MACD is still in a bearish crossover while RSI is still forming a trend of lower highs. If gold can find some support here, it could conceivably form a descending triangle from the August high which, while bearish, would at least keep prices above $1600 for several more weeks. In the event we do see a rally, there will be some significant resistance at the 20 and 50 DMA between $1670-1700. Given the series of lower highs, that may be followed by more selling. The longer term chart suggests there is considerable downside left to go if the sell-off continues. The rising channel off the 2006 low suggests support at $1000-1100. We can see that the next level of horizontal support is $1500-1550.
This week looks more bearish as the Mercury-Rahu aspect on Tuesday and Wednesday looks like to punish gold some more. Thursday’s Sun-Pluto conjunction may also create problems for bullion although there is a chance the polarity of that combination may reverse and we could get some upside. Nonetheless, there is a significant amount of negativity that should translate into lower prices. There is a chance we could test that first level of horizontal support at $1550. Gold looks vulnerable to declines in early January as the Saturn-Jupiter aspect is at its closest. January would appear to tilt bearish more generally, although there remains some question about the depth of the retracement and the duration. A more bullish scenario would see a modest decline with more range bound trading as we approach the Mars retrograde cycle on January 23. Perhaps that makes me cautiously bearish on gold. While I would not be surprised to see a major decline occur to $1400, I can’t find enough corroborating astrological indicators that would make me confident in that forecast. Gold should rally in February and March during the Jupiter-Pluto aspect. Another major leg lower looks likely starting in mid-March.
5-day outlook — bearish
30-day outlook — bearish
90-day outlook — bearish-neutral