 (28 September 2025) US stocks finished the week slightly lower as markets began to price in a possible government shutdown after September 30. The decline coincided with the Mars-Pluto square and Mars crossing the ecliptic, both of which hinted at possible weakness. However, as I noted in last week’s post, the past performance of these alignments was quite unremarkable and did not present a compelling case for significant downside.
The planetary highlights this week involve Mercury and Venus. Mercury is due to cross the ecliptic on Tuesday (and thus conjoin its south planetary node) while on Wednesday heliocentric Mercury conjoins Mars just as geocentric Mercury squares Jupiter. None of these alignments have an strong bias either way, although they are worthy of further investigation.
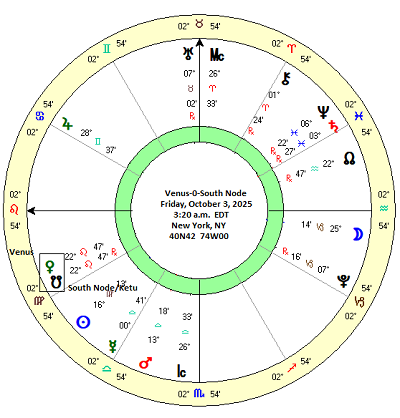
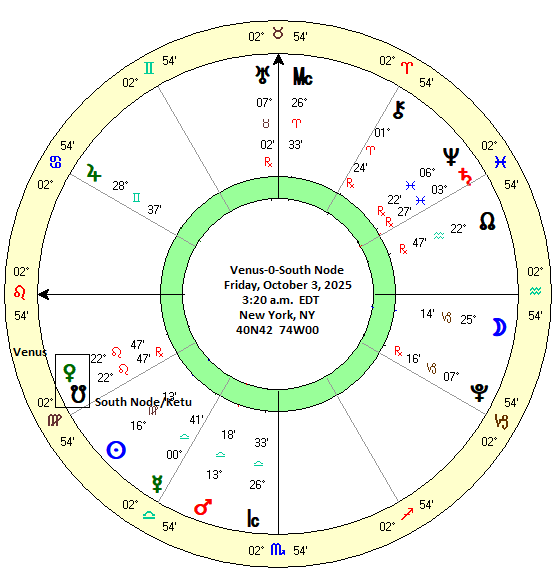
The late week conjunction of Venus and the South Lunar Node is even more of a question mark. On the face of it, this is a pairing of opposites as Venus is considered a benefic planet while the South Lunar Node is often seen as somewhat malefic. Briefly stated, the South Lunar Node is not an actual planet, but rather one of the astronomical points that mark the intersection of the orbital plane of the Moon and the ecliptic, i.e the horizontal plane upon which the planets revolve around the Sun. In traditional astrological systems such as Vedic astrology, the South Node or “Ketu”, as its known, is a natural malefic that erases, erodes and disrupts normal routines. It is seen as a spiritual planet that has an inherently anti-materialist orientation. This is in contrast with its materialist mirror image, Rahu, which is the North Lunar Node. Ketu therefore carries a more bearish bias in all matters financial.
Given Ketu’s unpredictable nature, I have usually viewed the Venus-South Node conjunction with some caution, even if it is borne of indecision. The changeable nature of the lunar nodes also means it may not be strongly bearish either as other factors can offset or even reverse its primary influence. And even if it is bearish, it would likely be a short-lived effect anyway since Venus travels at 1.2 degrees per day while South Node travels backwards (mostly) at a much slower average rate of 0.05 degrees per day. But rather than speculating at its potential effects later this week, we are better served by analyzing previous conjunctions from an empirical perspective and asking: what does the evidence say?
Method
In order to shed some light on the market effects of this conjunction, I decided to analyze the previous 35 years of Venus-South Node conjunctions from 1990 to 2025. The annual Venus-South Node conjunction therefore resulted in a sample of 37 cases. Closing prices of the S&P 500 were recorded at 3-day intervals starting from 15 days before conjunction until 15 days after the conjunction. The mean South Node position was used to mark the conjunction. The difference between the mean nodal position and true nodal position is rarely more than one degree and thus was unlikely to significantly alter the results since the day of the conjunction would only vary by one day either way. At the time, this seemed like a relatively unimportant decision given the much longer 30-day window under consideration, But the decision to use the mean node instead of the true node would prove to be consequential. But more on that later. The closing prices at various intervals are shown in the table below.
Price changes were recorded in percentage terms at various intervals including the 30-day window (“-15d 15d”), the 24-day window (“-12d 12d”) and so on down to a 6-day window (“-3d 3d”) which was further divided into 3-day intervals before and after the day of conjunction. Given the relatively high velocity of Venus, my expectation was that if there was an effect in either direction, it would tend to manifest more in the shorter time windows, perhaps 6 days or 3 days before and after the conjunction. But as always, the data would speak for itself. The table below shows the percentage changes for each case at different intervals from 1990 to 2025.
Results
The results shows very little apparent effect from the Venus-South Node conjunction. The summary statistics table below suggests the average and median roughly tracks the expected line. The expected values were derived on a pro-rated basis from an 8.6% average annual return for the S&P 500 since 1990. That said, some intervals did print negative averages (e.g. “-12d 0d”, “-6d 6d”) although none reached statistical significance based on the 95% probability threshold of p<0.05. The medians were also consistently higher than the average and reflected the relatively small effects of this conjunction.
The slight negative bias of the conjunction is better seen through the cumulative trend chart shown below. The average line is consistently below the expected line. But the median line tracks the expected line quite closely and therefore does not confirm the more bearish effects of the average line.
As far as this small sample goes, the Venus-South Node conjunction does not seem to have a major market effect.
A surprising twist: direction matters
But there is more to this story. As mentioned earlier, the lunar nodes come in two versions: mean and true. The mean node is a smoothed, always-retrograde simplification of the sometimes erratic motion of the true lunar nodes. In actuality, the lunar nodes move in both directions — sometimes forward and sometimes backwards. While they are retrograde more often than they are direct, the effect of the forward direct motion of the nodes is worth considering in its own right. This possibility only struck me once I was well into the research. By separating the sample into two types of conjunction — one with a direct node and one with a retrograde node — there was an obvious way to disaggregate the sample. My guiding question was therefore: does it matter if the South Node is in direct motion when it conjoins Venus?
It turns out it does very much. Taking the true node position at the time of conjunction with Venus, I grouped together all the conjunctions in which the South Node was direct. This produced a batch of 16 cases. The summary statistics and trend tracking chart are shown below. Both the averages and medians for most intervals were very negative and there was even one result that was statistically significant. The cumulative trend chart shows this very clearly as the average and medians lines are far below the expected line. Clearly, there is a bearish effect from the Venus-South Node conjunction, but only if the South Node is direct. A larger sample might well have produced more results that were statistically significant.
Now compare that chart of direct South Nodes with the chart of the Venus-South Node conjunction when it is retrograde. The difference is like night and day. This sample consisted of 21 cases and produced mostly positive results across most intervals for both average and median. While there is a noticeable and unexpected dip at 6 days and 9 days after the conjunction, the bottom line here seems to be that the Venus-South Node conjunction is bullish for stocks, but only if the South Node is retrograde at the time.
Of course, the size of sample is too small to make any high confidence predictions. If time permits, I hope to repeat the study with a larger dataset which might be able to bolster the sample size enough to reach statistical significance. It would also be an opportunity to redo the study using the true nodal position to see if there is any measurable differences with the mean node.
Implications for this week
As it happens, the South Node will be direct at the time of the conjunction on Friday (mean node) and Saturday (true node). Based on the results of this study, this increases the odds for some downside this week. Since the chart shows an extended period of under-performance both before and after the exact conjunction, it is even possible we could see a bearish bias extend into the second week of October. However, we should be careful not to attribute too much weight to this study. Without statistical significance, these results do not provide a sound basis for a high confidence prediction, let alone a trading strategy.
Nonetheless, there is some reason to be cautious this week.


