 (13 July 2025) Stocks slipped a bit last week as President Trump’s renewed tariff threats prompted some investors to take profits. Despite the pullback, most US indexes remain near all-time highs thanks to a tech-driven rally. Even if stocks experience some selling in the near term, the outlook seems bullish given the strong breadth of this rebound.
All eyes this week will be on the Mercury retrograde station which occurs shortly after midnight (EDT) on Friday, July 18. Given the bearish reputation of retrograde Mercury, this could be potential turning point for the market as stocks could become more vulnerable to declines. And yet as my previous study in March suggested, the Mercury retrograde cycle actually isn’t that bearish. In fact, it barely moves the needle in either direction, aside from one important exception. Its reputation may therefore based more on astrological myth than reality.
But with another Mercury retrograde cycle approaching, I decided to revisit the study and see if my original results held up with a larger sample size. In the previous study, I noted how the small sample size of 79 cases from 2000 to 2024 might not be large enough to capture the true effects of retrograde Mercury. With that in mind, in this analysis I have expanded the sample size to 141 retrograde cycles from 1980 to 2025.
Mercury retrograde: separating fact from fiction
As before, I used a series of time intervals in order to assess the potential impact of Mercury retrograde. The first and last recorded prices coincided with the Mercury shadow period which typically demarcates the longest extent of the retrograde period. A pre-retrograde shadow period lasts about 15 days and is defined as the time in which Mercury traverses across the same 10-15 degree zone in the sky as its retrograde cycle while a post-retrograde shadow period sees Mercury traverse across the same zone that preceded its retrograde cycle. While the narrow Mercury retrograde cycle lasts about 22-24 days, if we include both shadow periods, then the long version of the retrograde cycle lasts for about 54 days.
In the tables below, I used a shorthand to label the various time intervals. The price 15 days before the retrograde station (RxS) was labeled at “-15dr”. This represented the price of the Dow Jones Industrials 15 days (d) before (-) the retrograde (r) station. The price at the retrograde station was labeled as “0dr”. The intervals following the retrograde station have a plus sign (+) in front of them.
Results
My working hypothesis was that if the Mercury retrograde period is bearish, then we should see average and median prices decline after the retrograde station. Since many believe that the period immediately after retrograde station is the most bearish, we would see some evidence appear in the 2-day, 4-day or 6-day period after the station. However, the results for this larger sample basically duplicated the original results. While there was some minor variation across the intervals, there was very little effect. So no rejection of the null hypothesis.
The first column on the left (“-15dr 0dr”) shows the percentage change in prices in the 15-day run-up to the retrograde station. The summary data at the bottom of the table show little to no effect as the average is -0.03% and the median is 0.14%. Since the dataset is widely distributed given the large standard deviation of 2.98%, the median better represents the typical data point in the sample than the average. The median of 0.14% isn’t far off the expected value of 0.35% which is based on an 8.6% average annual return for 1980-2025. The period leading up to Mercury turning retrograde is slightly more bearish than chance would predict. (See page 4 for summary averages, medians, and % positive, etc.)
But how does this compare with the period after Mercury turns retrograde? Actually, the last three columns on the right hand side of the table show little variation. The first two days after the station (“0dr 2dr”) have an average of -0.06% and a median of 0.00%. This is not what we would expect to see if Mercury retrograde was clearly bearish. It’s much the same story for the longer 4-day (“0rd 4dr”) and 6-day (“0dr 6dr”) periods which have a slightly positive median results, 0.25% and 0.14% respectively. Moreover, these are basically in line with their expected values. Taken together, this evidence suggests there is no bearish influence of this short version of Mercury retrograde.
If we widen our scope, it’s much the same story. The table below shows the market effects of the whole 24-day Mercury retrograde period and the shadow periods. The first column (“RxS DS”) is the net change of this entire Mercury retrograde period from the retrograde station (RxS) to the direct station (DS). Nothing earth-shaking here — it is pretty much what chance would predict. The average is 0.45% and the median is 0.61% — both of which are very close to the expected value of 0.57%. In other words, no effect. The number of positive cases is 61% which is slightly more than chance would predict which is 57% based on long term averages. A similar null result is seen in the long 54-day period that includes the shadows. If there is a bearish result here, it is in the 15-day periods that precede and follow the respective retrograde and direct stations. Even there, the bearish bias is tiny, with the median of 0.14% and 0.16% against a 0.35% expected value. The results are barely below what chance would predict and aren’t even negative. (See page 7 for summary averages, medians, and % positive, etc.)
The Mercury retrograde station as pivot
As I mentioned earlier, there is an important exception to this underwhelming neutral picture. And that is that Mercury retrograde can act as a pivot as prevailing market trends may be more likely to reverse when Mercury changes its direction. We saw evidence of this pivot effect most recently in March and April amid the initial tariff turmoil. The first leg down in March formed an interim low just two days before Mercury turned retrograde after which a short rally ensued. In other words, Mercury retrograde was bullish in the short term. The final low on April 7 occurred the same day that Mercury ended its retrograde cycle and resumed its normal direct motion. In both instances, the retrograde and direct stations of Mercury acted as timing markers of a change in direction.
But how consistent is this pivot effect? As in my previous study, I created samples of cases in which prices where trending higher or lower before Mercury changed its direction. I used a >1% threshold 6 days before the station as the selection criteria for both bullish and bearish reversal scenarios. Mercury turning retrograde may therefore coincide with sudden bearish reversals after a positive up trend as well as bullish reversals after a down trend as it did in early Aug 2024.
Testing the bearish reversal thesis
Since we are immediately concerned with the prospect of a bearish reversal on or around July 18 after the recent run-up, let’s look at the bearish reversal scenario first. The resulting sample of 36 cases had an average gain of 2.00% 6 days before the retrograde station and mostly retained its positive trend 4 days before (1.55%), although this trend was eroding somewhat 2 days before the Rx station with an average gain of 0.93%. Nonetheless, fully 83% of cases were still positive 2 days before the Rx station.
But the up trend suddenly came under pressure after the retrograde station as only 47% of those cases were still positive with an average gain of just 0.07%. This more neutral trend continued 4 days after and 6 days after, although it moderated somewhat as seen in the 53% and 58% positive cases in those two intervals. Also, the median gain rebounded somewhat from -0.03% 2 days after the Rx station to 0.24% and 0.20% in the subsequent 4-day and 6-day intervals.
Clearly, these results don’t describe a major bearish reversal and don’t provide a justification for a specific trading approach. But there is some evidence here that bullish up trends will tend to lose their momentum in the days following the Mercury retrograde station. This may be seen as a partial salvaging of the traditional bearish view of Mercury retrograde. Mercury retrograde may be less bullish than would otherwise by the case, but only in the context of a strong up trending market.
Testing the bullish reversal thesis
But could the Mercury retrograde station also act as a bullish timing pivot for a down trending market? To test this idea, I collected a sample of 26 cases in which stock prices had fallen by more than 1% in the 6 (or 8 days) before the station. This produced an average decline of -2.98% and a median decline of -2.95%. This down trend showed signs of eroding before the retrograde station, however, as the average decline was-2.25% 4 days before the station and just -0.95% 2 days before. Moreover, 24% of those cases had reverted to positive outcomes before the Rx station.
After the station, however, almost half (48%) the cases turned positive, although the average return was still negative at -0.56% 2 days after. As with widely distributed data, the median perhaps better represents the typical outcome and it was 0.00% 2 days after and only slightly negative 4 days after (-0.27%) and 6 days after (-0.07%). Here again, this isn’t evidence for a huge reversal. A stronger bullish reversal effect would have produced clearly positive returns in the days following the Rx station but this didn’t happen. So while the bullish reversal thesis doesn’t find much support here, we can see that the prevailing bearish trend is clearly weakened by the reversal of Mercury’s direction.
Conclusions
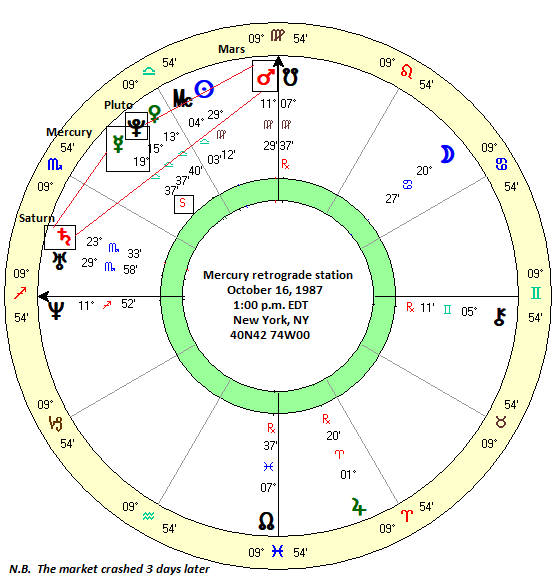
Despite its bearish reputation, the evidence presented here suggests that on average the Mercury retrograde cycle is actually fairly neutral in its market effects. As always, we can point to individual instances in which Mercury retrograde coincided with negative outcomes, such as in October 1987 when it stationed retrograde three days before the October 19 Black Monday crash. While Mercury may have played a role in that crash, it was only one factor out of many. Across many cases, this apparently bearish influence completely disappears as we have seen in this study.
At the same time, this study doesn’t fully debunk the Mercury retrograde cycle. Mercury’s direction does have effects but only under certain circumstances. One of those circumstances is that it can often mark turning points for the market where prevailing trends are subject to change. Thus, the Mercury retrograde station can signal either an end to a bullish trend and a bearish trend. Even here, however, this trend change effect is not that strong. The bearish reversal did not see much downside post-Rx station. Instead, it seemed to merely highlight the weakening of an up trend. Whether or not this was due to statistical mean reversion (i.e. all short term trends eventually revisit the long term trend), or a self-fulfilling prophecy as a small number of astrologically-inclined traders reduced their long exposure or something inherent in the Mercury retrograde cycle remains to be seen.
Given the small effect, the retrograde cycle is not a sufficient basis for a stand-alone trading strategy. As with most things in astrology, it is best used in conjunction with other factors. In October 1987, the Oct 16 Mercury retrograde station was part of a powerful alignment as the Mars-Saturn midpoint conjoined the midpoint of Mercury-Pluto. Since Mercury was stationary (as denoted by the “S” in the chart), it increased the effect of the broader alignment. To be clear, the Mercury influence was not necessarily bearish, but only became bearish because it was aligned with the doubly malefic Mars-Saturn midpoint.

Implications for this week
With stocks trending higher in recent weeks, this Friday’s Mercury retrograde station would seem to be another opportunity to test of the potential bearish reversal thesis. Will it deliver? Given the relatively modest post-Rx station effect, it is hard to say with certainty. But with Saturn also stationing retrograde today (Sunday, July 13), there is a second influence which favors some kind of reversal and change in trend in the coming days.
And we should note that this upcoming Mercury retrograde station also forms an alignment with Saturn. Mercury turns retrograde at 21 Cancer (15 Leo/tropical) and thus forms a close 135 degree sesquisquare with Saturn, with just one degree of orb. Most Mercury-Saturn alignments are bearish for markets, although this 135 degree alignment is not as powerful as the primary aspects such as the conjunction, square and opposition. However, the fact that Mercury is stationary this week means this interaction with Saturn will be stronger than normal. It definitely increases the downside risk. It is important to note that any bearish reversal effect may not happen this week since the post-station period (i.e. after July 18) tends to be more bearish. That would push any downside into next week (July 21-25). That said, some caution is warranted this week, especially as we get closer to Thursday/Friday.


