

Summary for week of January 16 – 20
- Stocks may slip early in the week but recovery is likely by Thursday
- Euro could rebound into Thursday
- Crude may strengthen midweek; downside risk is increasing in late January
- Gold to decline early but recover into midweek
Summary for week of January 16 – 20
- Stocks may slip early in the week but recovery is likely by Thursday
- Euro could rebound into Thursday
- Crude may strengthen midweek; downside risk is increasing in late January
- Gold to decline early but recover into midweek
Stocks melted higher for yet another week as investors chose to focus on positive economic data despite fresh credit downgrades in Europe. The Dow rose less than 1% closing at 12,422 while the S&P 500 finished the week at 1289. As disappointing as this bullish outcome was, I was not hugely surprised by it either. Last week, I alluded to the complexity of the current planetary pattern and allowed for the possibility that the Jupiter-Uranus aspect was a supporting factor for the market. Alas, I could not quite bring myself to make a bullish call, if only because the market looks increasingly overbought from a technical perspective. It was a case perhaps of the short term aspects winning out over the medium term aspects. I noted how the entry of Venus into Aquarius on Monday could very well push up prices in the early week. This is more or less what happened, although the strength continued into Tuesday’s session as well. But no real pullback was forthcoming after that, surely a sign that Jupiter is still stronger than Saturn. Friday’s correction was welcome on the Venus-Neptune conjunction, but the dip was aggressively bought intraday so we got a long-tailed hanging man candlestick.
S&P’s credit downgrades of France, Italy and other EU nations arrived on Friday. While this should rightly be seen as a reflection of the ongoing presence of Saturn and the dangers of excessive debt, the market had largely priced it in already. In other words, things are going to have to get worse in Europe if stocks are going to correct significantly. Greece is again on the verge of default as it has to raise more money from the credit market on Tuesday January 17 amidst the specter of a collapse of their own debt negotiations. Perhaps that might be the straw that breaks the camel’s (or bulls’) back. So far, this Jupiter-Saturn opposition has been more bullish than I originally anticipated, presumably due to the supporting aspect of Uranus. But as Jupiter begins to separate from Uranus this week, the market could again be on shakier ground. That is quite possible, especially given the upcoming retrograde stations of Mars (Jan 23) and Saturn (Feb 7). Even if we get a pullback soon, however, can the market continue higher and challenge the high of 2011? As I see it, there are two possible scenarios that seem more likely. The first scenario is that we get a top now, either last week at 1296 or this week upcoming somewhere near the 1300 level. In this scenario, the Mars retrograde of Jan 23 figures prominently as stocks fall after Mars has reversed. This would allow for a pullback and then another rally attempt into February and March which puts in a lower high. The other scenario is that we could top out in the next few days (if we haven’t already) and have some kind of pullback, but the market then makes a higher high into March, perhaps matching the 2011 high of 1370. While I think the market is overdue for a pullback now, there is a significant chance of some gains after the Saturn station on February 7. I could wrong in this, but the Jupiter-Pluto aspect in March does look quite bullish and it will likely produce a sizable rally. Whether it creates a new high remains to be seen.
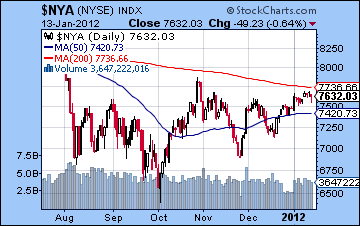 They say never short a market that is making new highs. That likely applies here as the SPX took out the October high last week following the lead of the DJIA. Interestingly, the broader NYSE Composite has yet to break above its October high — nor its 200 DMA. This is perhaps a sign of weakness although we cannot make too much of it. While we got a new high on the SPX, the chart pattern now resembles an ascending triangle more than ever. This is a bullish pattern that is characterized by similar highs and increasingly higher lows. Dips are getting bought more quickly and shows that the bulls are getting stronger over time. Even if the bulls relent in the near term and we pullback off current levels, the next low will be important. If it is higher than the previous low at 1202, then that will also be a bullish sign that the market can at least recapture 1290-1300 again. The SPX remains well above its 200 DMA a bullish indication if ever there was one. The 50 DMA is still below the 200 DMA so that may allow for some doubt about the medium term health of the market. While the market looks overbought by some measurements such as stochastics, RSI is not yet overbought and remains below the 70 line. This is an argument for more upside perhaps, although it is worth noting that the RSI reversed right around this level (65-68) back in October. MACD is still in a stubborn bullish crossover. Perhaps the SPX can advance all the way back up to the falling trend line from the 2007 and 2011 highs. This would suggest a 1320-1330 level in January. If it manages a close above 1300, then perhaps the odds rise for a quick run to this trend line in the short term. But if the SPX fails to hold onto the psychologically important 1300 level, then it could signal a pullback.
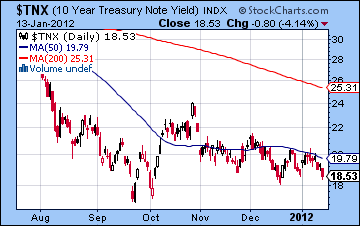
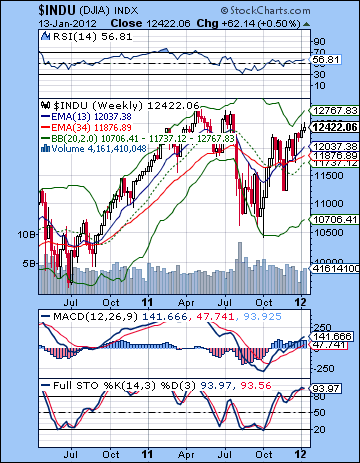 The weekly Dow chart still looks moderately bullish. The 13 and 34 week EMA are in a bullish crossover suggesting good upside momentum. It is perhaps worth noting that the broader NYSE Composite weekly chart has still not seen such a crossover. MACD is still in a bullish crossover while stochastics are well above the 80 line. RSI is carving out an ever so slight bearish divergence with respect to the previous high. The more emphatic sell signal for this chart may be a bearish crossover on the MACD. A bearish cross on stochastics might also indicate some selling ahead although it may not mark a sea change from the post-October 4 rally. Even a pullback back to the November low may not generate a bearish cross on MACD or the moving averages. This is one reason why the weekly chart remains the bulls’ best friend at the moment. But the bond market has not been confirming the rally in equities. Yields fell again last week as the 10-year treasury bond had its lowest yield ever recorded at an auction. The ongoing need for comparatively safe instruments such as treasuries highlights the vulnerability of the stock market. Even if the promise of QE3 can keep investors interested a while longer, I think the these sub-2% yields are one reason why stocks are having trouble breaking above SPX 1300. The strong Dollar and weak Euro are further evidence against a continued rally in stocks.
The planets this week look quite mixed indeed. Since Saturn has yet to manifest strongly this month, it seems fairly unlikely it will do so here. The Saturn-Rahu aspect is still quite close but I’m less inclined to think it will show up at all this time around. That’s mostly because the Jupiter-Uranus aspect will be exact this week. This could well represent a culmination of bullish energy. In other words, there is a theoretical case for a top here. This is perhaps somewhat more likely since Mars turns retrograde next week (Jan 23). Mars stations are not always reliable in this way, but at least it offers the possibility of a trend reversal at that time. Monday’s MLK holiday means no trading in New York, but all other exchanges will be open. There may be some downward pressure on stocks on Monday which extends into Tuesday due to the Mercury-Rahu aspect. I would therefore expect one down day on Tuesday or perhaps even Wednesday. But as the Sun enters into an alignment with Jupiter, Saturn, Uranus and Neptune by Thursday, there is a better case for some upside. There are an unusually high number of planets clustering around 6 or 7 degrees of their respective signs so it should produce a net positive result across the last three days of the week. That said, there are some potential trouble spots that could also produce a down day. Friday perhaps stands out as more likely in this respect, although the picture is so jumbled this week I would not be surprised it if occurred on Thursday on the tight Sun-Saturn square aspect. So one possible scenario would be a Tuesday retest of last week’s low at 1275 and then back up to 1290-1300 by Friday. If this is fails to recapture last week’s high, then Friday may see a sell-off. That is one possibility although I would not rule out a break above 1300 either.
 Next week (Jan 23-27) begins with the retrograde station of Mars. This happens once every two years so it is worth taking seriously. It is traditionally a bearish measurement, although it is somewhat less reliable than I would like. Monday has the added feature of a close Mercury-Mars aspect so that increases the odds of a significant down day on Monday. There is also a Fed meeting with Bernanke scheduled to speak on Wednesday. The week as whole has a reasonable chance for a decline although a rebound of some size is likely late in the week, probably on Friday’s Mercury-Jupiter-Saturn aspect. The following week (Jan 3 – Feb 3) also tilts bearish as Venus lines up to oppose retrograde Mars on Feb 1. The Sun is in aspect with Rahu that day, so there is a good chance for another significant decline. There is a chance that the down move will be noteworthy since Jupiter will finally be separating from Uranus and Neptune as well as Saturn. This may reduce the bullish energy available and coincide with a significant shift in the market. That said, I still would not give this a high probability bearish outcome but it seems more likely than not. How low we go is very hard to say. I used to think in terms of testing the previous low of 1158. Now I’m not so sure. Once Saturn turns retrograde on Feb 7, there is a chance that the bulls will take over again. I am unsure if this happens immediately or if we will have to wait until approximately Feb 18 when the Sun conjoins Neptune and sets up a larger alignment with Saturn. But the prospects for a significant rally should grow through February with a possible cumulative peak occurring near the Jupiter-Pluto aspect on March 13-15. After this aspect, the odds increase for a stronger correction. Late March and April still look quite bearish so that may mean that the last significant high occurs in mid-March. Whether it is the high for the year is harder to say. It could be. Even if we bounce in May, the market looks very likely to cascade lower in June and into July as Uranus squares Pluto and Saturn stations once again. Maybe that is the time we will finally retest the October low of 1074.
5-day outlook — neutral-bullish SPX 1280-1300
30-day outlook — bearish SPX 1180-1240
90-day outlook — bearish-neutral SPX 1250-1300
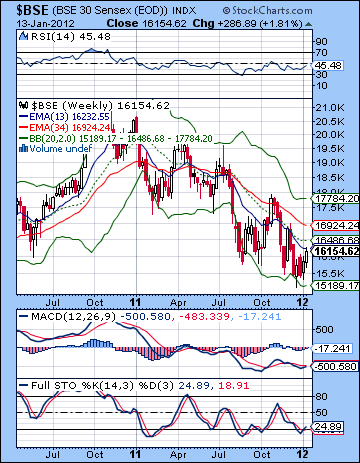
 Stocks climbed higher last week on positive European sentiment, diminishing food inflation and solid earnings reports. The Sensex rose 2% closing at 16,154 while the Nifty finished at 4866. I had been fairly open minded about last week given the range of influences at work so this outcome was not surprising. I noted that there was a chance we could move above 4800 by the end of the week and that is where we finished up. Tuesday’s large gain roughly coincided with the bullish entry of Venus into Aquarius which I had mentioned as a possible source of bullishness. While I thought it might manifest on Monday, it nonetheless was not wildly out of whack here. There was precious little downside, however, as only Thursday showed any sign of pessimism. Thursday’s pullback coincided with the bearish Venus-Saturn aspect while Friday’s modest gain seemed to match the more positive Venus-Neptune aspect.
The market appears to be trying to form a durable bottom here. This is perhaps somewhat fitting given the ongoing tension between the bullish and bearish planets in the sky. The close proximity of Jupiter (7 Aries) to Uranus (6 Pisces) has provided support for sentiment here and has likely prevented lower lows. As positive as this pairing has been, Saturn (5 Libra) has not been too far out from its own aspect with Jupiter and this has tended to limit the optimism. Neptune’s recent entry into this large alignment at 5 Aquarius has yet to tip the scales in either direction. Since it is closer to Saturn, it may suggest to further upside is more limited. So if there are encouraging signs of growth in the economy, Saturn’s presence will tend to put a damper on any enthusiasm. That is one way to interpret Friday’s very Saturnian downgrade by S&P of the debt rating of France and several other EU countries. Saturn is warning that debt is too large for sustainable growth to occur and hence caution is best advised. This kind of Saturnian energy may be around a while longer, perhaps until Saturn turns retrograde on 7 February. While Jupiter still forms a bullish aspect to Uranus for the next several weeks, I am skeptical if Indian markets can rally significantly in the near term. While I would not rule out a gradual rise in the indices, I would also not rule out further testing of lows over the next several weeks. The upside potential therefore seems somewhat less than the downside risk. There may be a better opportunity for a larger more sustainable rally only after 7 February. That is what the astrology would suggest at least. We will have to see if the technical picture also clarifies in the meantime to confirm that belief.
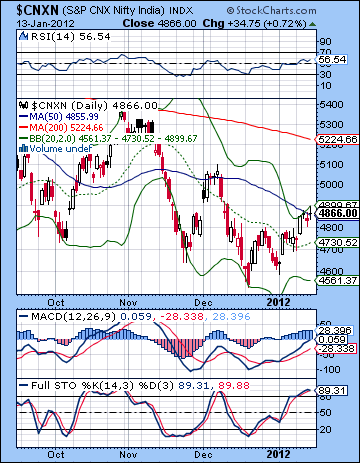
 The current technical situation reflects a cautious optimism. The Nifty has climbed back from its bottom Bollinger band low in December all the way back to the upper band. Last week’s close was almost exactly on top of the top band. This also coincided with the 50 DMA — a major resistance level in a bear market. We can also see how it has moved back up to the falling trend line from the early November high. While there may be signs of life here, the basic pattern of lower lows and lower highs has not changed. The moving averages remain in a bearish alignment although the 20 DMA has now turned up. While few observers are pondering the possibilities of a new bull market right now, there is some question whether another run up to the test resistance at the 200 DMA is possible. The RSI still has some room to go before becoming overbought so that perhaps argues for more upside. MACD is still in a bullish crossover and is now edging above the zero line. This is another positive indication. Stochastics is another story, however, as it is overbought and has begun a bearish crossover. This suggests a mixed picture overall. There is significant overhead supply above current levels that dates back to September. While some very positive news could be enough to give bulls more confidence, the more likely scenario is that bulls will continue to sell into rallies. The gap above 4900 may be important in this respect. A close above 4900 would likely encourage a gap fill at very least and a run to 5000. Support is currently provided by the 20 DMA around 4730. A close below that level would be quite bearish.
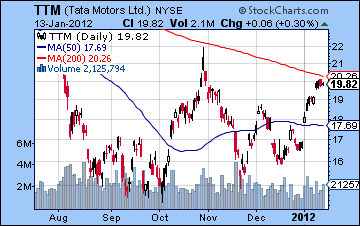
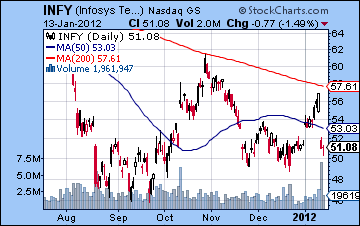
The weekly Sensex chart has not changed significantly. The bearish crossover of the 13 and 34 week EMA remains showing an ongoing negative trend. Stochastics has extended its bullish crossover and has a long way to go before becoming overbought. MACD may be on the verge of a bullish crossover and it shows a positive divergence with respect to its previous low. While this augurs favourably for the medium term, it does not say that a turn higher is imminent. It may be anywhere from one week to several weeks away. RSI is still below the 50 line. Individual stocks like Tata Motors (TTM) had a good week but remain on the wrong side of key resistance levels. Tata climbed back to its falling 200 DMA. But now the real test of the bulls’ mettle begins. Can it hold above the 200 DMA? While it may be worth a pilot long position if it crosses over the 200 DMA with a tight stop loss, this stock still looks vulnerable to declines. Perhaps it needs to put in another higher low before it can gain the strength to cross and stay above the 200 DMA. The chart of Infosys (INFY) is even more interesting. It reported strong earnings last week and investors rewarded it by buying it aggressively. Here again it stopped just short of its 200 DMA. But all that goodwill soon evaporated, as it quick fell and filled the gap at $52. Actually it duplicated the gap on the way down also. Volume was extremely heavy, however, so that is another sign that it may not be in a good position to rally. Friday’s candle was bullish but it does not look particularly positive here.
 This week again does not offer any clear astrological indicators. In terms of intermediate influences, Jupiter and Uranus forms their closest aspect so that will generally be supportive of the market. Whatever influence the Saturn-Neptune aspect may have here, it is unlikely to offset the positive influence of Jupiter. But the short term aspects suggest some downside in the first half of the week is also more likely than not. Monday’s Moon-Saturn conjunction could be troublesome for the market and take prices lower. Tuesday’s Mercury-Rahu aspect is similarly bearish, although whether it has the force to undermine the bullish Jupiter influence is unclear. I tend to think that we could see a net decline over the first two trading days and possibly even two losing days although that is less likely. As the Sun enters into the larger alignment with Jupiter, Saturn and Uranus, some upside is more likely. This looks somewhat more probable on Wednesday and Thursday, although that is by no means clear. Friday could also be positive as the Sun forms a tighter aspect at that time. However, the Moon-Mars aspect will be quite close in the afternoon so it is possible that could erase previous gains that day. So I would not be surprised to see the market pullback, perhaps to 4750 and the 20 DMA and then retest recent highs at 4900 by Friday. That is one fairly modest scenario. A more bullish scenario is also possible here where we test 5000 by the end of the week, although that may be difficult to achieve. While I think the market is generally vulnerable to declines, I am less convinced that they could take place this week. It seems more likely that they will occur after the Mars retrograde station on the 23rd.
 Next week (Jan 23-27) may be more prone to declines due to the Mars retrograde station on Monday. Mars begins its two-month backward journey through the sign of Leo (this is bad for leaders and governments in general) at this time so there is a somewhat greater chance that we could see a trend change here. Monday may well be a negative day as the Mercury-Mars aspect looks quite nasty. The first half of the week should be bearish with some recovery by Friday. The following week (Jan 30-Feb 3) also seems more bearish as Venus opposes Mars midweek. Actually, this period between the retrograde stations of Mars (23 Jan) and Saturn (7 Feb) definitely has some downside possibilities. I don’t think it will be huge but there is a chance that the Nifty could retest its December lows. The market may be begin to recover after 7 February although that date is not etched in stone. It is possible we may have to wait another week or so before the effects of Saturn’s slow velocity begin to disappear and the market comes under the more bullish influence of the Jupiter-Pluto aspect. This aspect is exact on March 13-15 so there is a good chance for a significant rally lasting for several weeks. Even if the Nifty tests 4500 once again, there is a very good chance it could bounce all the way to 5200 by March. April looks more bearish again, however, and Q2 generally looks more negative. I would therefore not expect any rally to last beyond April. June and July look like they could be close to an interim bottom, presumably a lower low than where we are now. The Uranus-Pluto square and Saturn station both occur in June. These aspects may adversely affect China in particular so we will have to watch for problems on that front. Since November and December 2012 look very bearish, I would consider waiting until that time has passed before entering into any significant long positions.
5-day outlook — neutral-bullish NIFTY 4800-5000
30-day outlook — bearish NIFTY 4500-4700
90-day outlook — neutral-bullish NIFTY 4700-5200
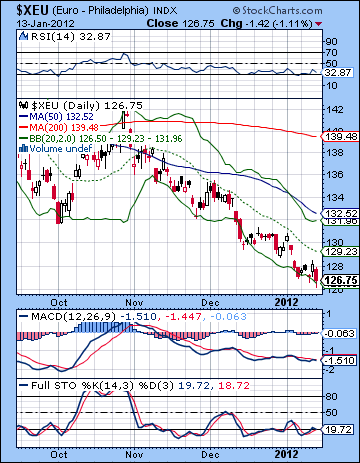 The Euro continues its slow descent into the abyss last week as the sweeping S&P downgrade confirmed what many already know– the Eurozone is in deep financial trouble. The Euro made a new low and closed below 1.27 while the Dollar Index finished above 81. The Rupee recovered strongly and closed at 51.5. This bearish outcome was not unexpected, although I had been fairly agnostic in last week’s newsletter. I thought we could see some early week upside on the Venus ingress and we did as the Euro rose both Monday and Tuesday. But the reversal was not surprising later in the week, and neither was Friday’s significant sell-off. I was uncertain what the Venus-Saturn-Neptune might bring and thought that the week as whole could easily bring more downside. Technically, the Euro seems to be falling by sheer gravity at this point. In one sense, the Euro short has become a very crowded trade with many traders piling on in the hope for lower lows. So far, this strategy has been effective although one wonders when the bears’ luck will run out. Stochastics are back below the 20 line and in a bearish crossover. MACD is also in a bearish crossover while RSI is listlessly bumping along the oversold line. The weak Euro should certainly give equity bulls pause as a strong Dollar does not bode well for the current stock rally. At the moment, the Euro can barely manage to test resistance at the 20 DMA. Currently this level is 1.292. That may be the next shorting opportunity in the event of a rally attempt this week.
This week looks like a mixed bag of sorts. Jupiter is very close to its aspect with Uranus this week so that means that some upside is conceivable. The shorter term aspects seem to favour the bears, however. Monday and Tuesday seem more bearish as the Moon-Saturn conjunction may generate nervousness. Tuesday’s Mercury-Rahu aspect may also be problematic for riskier assets like the Euro. Gains are somewhat more likely by Wednesday and Thursday as the Sun moves into the thick of the Jupiter-Saturn alignment. It also takes up a not bad position in the Euro horoscope. Friday is more of a toss-up as there is a nasty Mars aspect in effect in the Euro chart. At the same time, however, the Sun may benefit from a Jupiter aspect. Overall, we could move lower in the early going, perhaps below 1.26 and then back up to 1.28-1.29 by Thursday. If Friday is down as it might be, then the Euro may finish closer to current levels, albeit with a bullish bias. Next week brings the Mars retrograde station on Monday, so we could see a Euro flush. I mention this only as a possibility. I would not call it probable, but the downside seems enhanced somewhat. There is a reasonable chance that we could see a meaningful bottom in the Euro sometime between January 23 and February 7. I suspect it will occur in February sometime around the Saturn station. Just where it occurs is uncertain, although at the current rate of decline perhaps somewhere south of 1.24 — perhaps as low as 1.18 and the lower trend line. There is a very good chance for a major rebound to begin in February and continue into March. We should expect at least a 50% retracement of the recent decline if not more.
5-day outlook — neutral
30-day outlook — bearish
90-day outlook — neutral-bullish
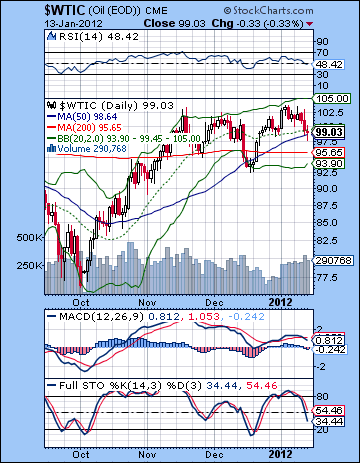 Crude oil tumbled last week on reduced demand prospects and diminishing tensions in the Middle East. Crude finished near $99 for WTI. While I thought we might have seen more upside last week, this bearish result was not surprising. I had been fairly uncertain about market direction given the difficult underlying influences at work. As I noted, these could take effect at any time and so I did not discount the possibility of a negative week. The early week was net positive as expected as the Venus ingress into Aquarius manifested with Tuesday’s gain. As expected, we got some late week pullback as the Venus-Saturn aspect on Thursday took crude below $100. Crude looks quite weak from a technical perspective as it pierced below its 20 and 50 DMA last week. While the moving averages remain in bullish alignment, stochastics is in a vicious bearish crossover and is heading down towards the oversold line. MACD is in a bearish crossover and has moved below the zero line. There is also a significant negative divergence in play here. RSI appears to be sloping down and displays a series of falling peaks. The failure of crude to make a higher high last week may give bulls pause here. If we do get a correction, then support would first come in around $92. Resistance would likely be around $102 if we get a rally.
This week looks uncertain as both bearish and bullish aspect are in play. I am tempted to say we will have a mixed and ultimately neutral outcome. The Jupiter-Uranus aspect is closest this week so we cannot rule out another rally attempt, especially in the second half of the week. But the first half of the week looks less positive so some testing of support is somewhat more likely on Tuesday and to a lesser extent, on Wednesday. Monday is closed for MLK Jr Day. Perhaps we test support at $95 early on Wednesday before we recover. But the bulls look likely to try to rally by late Wednesday and Thursday so we could be at $100 again. Friday is harder to call although I would lean bullish here too. Next week Mars reverses its direction and begins its two-month retrograde cycle. This is potentially more damaging to crude oil because Mars will reverse itself at a very important point in the Futures horoscope. This makes the prospect of a significant correction more likely during this week. The bearish outlook is somewhat more likely to extent into early February and the Saturn station on Feb 7. A more negative outlook may also continue into February. There should be some kind of rebound into mid-March but I am uncertain if this will produce a higher high. I tend to think it will be a lower high — perhaps somewhere between $92 and $104.
5-day outlook — neutral
30-day outlook — bearish
90-day outlook — neutral
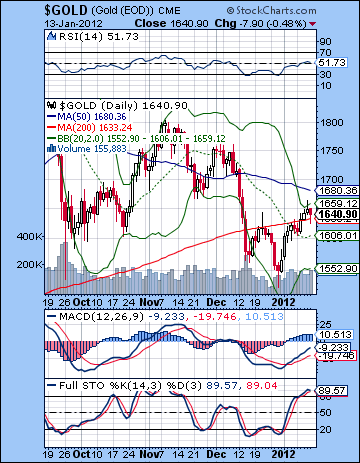 Gold rose 1% to $1640 last week as the technical bounce continued after the recent sell-off. This bullish outcome was not surprising as I had been fairly non-committal about gold last week. I thought we would see some early week upside on the Venus ingress. While Monday turned out to be slightly negative, Tuesday was quite bullish. Friday’s decline was quite modest and was somewhat at odds with the short term aspect that appeared to favour Venus and the bulls. In any event, our expectation that gold should rebound to test its 50 DMA was not unfounded as Thursday’s high came to within $20 of that level. Another rise up to this resistance level is still quite possible here. This resistance level is doubly significant perhaps because it is also quite close to the falling trend line. At least the bulls can point to the fact that gold is managing to hang onto its 200 DMA at the moment. MACD is also in a bullish crossover and marching towards the zero line, although the histograms may have stalled out here. Stochastics are overbought and are in the verge of a bearish crossover. While this needn’t be significant, gold has been quite weak lately so even fairly minor technical signs such as this may be all weak bulls need to sell out their positions. Gold has yet to have its death cross of the 50 and 200 DMA but that day may not be far off. Gold appears to be back testing its rising logarithmic trend line off its 2009 lows and it is quickly running out of real estate. The imminent convergence between this rising trend line and the falling trend line suggests that the upside could be limited.
This week looks like it will be one step closer to another move lower. I tend to think we won’t see any big down moves here, however. Some downside is possible, especially on Tuesday around the Mercury-Rahu aspect. (No trading Monday due to MLK Jr holiday in the US) Another down day is possible on either Thursday or Friday. I tend to think Friday will be lower but it is hard to say. The Sun enters the powerful Jupiter-Saturn alignment at the end of the week so that should see some net upside. So it is possible that gold will make a run up to its 50 DMA here. It’s by no means certain, but the planets would offer some support for that possibility. A better bet for some downside is more likely next week when Mars turns retrograde. Tuesday and Wednesday (24-25) look more bearish than the rest of the week. The following week should also be negative as the Sun is in aspect with Ketu on Jan 31/Feb 1. There is a good chance we will retest recent lows by the time Saturn turns retrograde on February 7. We should see another rally attempt begin in February, perhaps in the middle of the month. Gold should bounce into mid-March and the Venus-Jupiter conjunction. It’s hard to know where it will peak, although given the bearishness out there now it may well be a lower high. We shall see.
5-day outlook — neutral-bullish
30-day outlook — bearish
90-day outlook — bearish-neutral