- Bearish Mercury-Saturn aspect to take markets lower, especially early in the week
- Dollar to strengthen, perhaps significantly
- Gold vulnerable to declines through the week
- Crude mostly lower with recovery possible later
- Bearish Mercury-Saturn aspect to take markets lower, especially early in the week
- Dollar to strengthen, perhaps significantly
- Gold vulnerable to declines through the week
- Crude mostly lower with recovery possible later
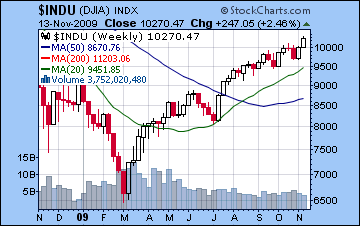
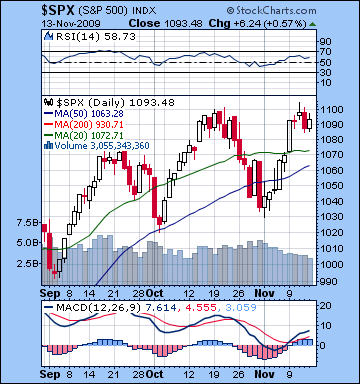 As the dollar continued to be shunned, stocks climbed higher again last week as equities remained the easy choice for institutional players. After the hitting its 50% retracement level of 10,340 on Wednesday, the Dow retreated slightly by Friday to close at 10,270 while the S&P finished at 1093. I had been more bearish here mostly due to uncertainties implied in the Mercury-Uranus-Ketu pattern. Interestingly, the market rose into the exact aspect and fell once Mercury had begun to separate. Monday saw the biggest gain of the week occur on the Moon-Jupiter aspect, while the overall bullishness to the first half of the week coincided with the Sun-Jupiter aspect that I suggested could lead to further run-up from "exaggeration and unhealthy optimism". Thursday’s decline came off more or less on cue as the Moon’s conjunction with Saturn in Virgo did appear give us a taste of some of that bearish gloom contained in the Saturn-Pluto square aspect. I missed Friday’s rebound by underestimating the Sun’s positive effects as it entered into a configuration with Uranus and Ketu. As disappointing as the week was, we can see that the Uranus-Ketu aspect will likely not cause any significant problems for the market in the coming weeks. This is a potentially useful piece of information in that any declines are more likely to come from expressions of the Saturn-Pluto square as it is triggered by faster moving planets.
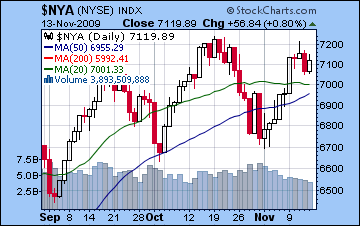
Last week I wondered if we were seeing the formation of a bearish head and shoulders pattern on the S&P. With the rise back to 1100, that possibility has gone by the boards. In order to make the bearish case one has to now focus on the potential for a double top. Certainly, there is some technical evidence to support the bearish side. The S&P ran up to 1100 on Wednesday and came back down to close below 1100 by Friday. This failure to close significantly above this level could spark some profit taking as more investors would recognize that the market might be topping out. In addition, we should note a growing divergence between indexes. The most bullish index, the Dow, made fresh highs here although this merely represented a 50% retracement of what it lost since the October 2007 all-time high. However, none of the other major indexes made new highs last week. The New York Composite (see $NYA chart), NASDAQ, Russell 2000, and Dow Transports all closed at or below than their mid-October highs. This is another clue that the rally is narrowing and may eventually produce more concerted across the board selling. Volume continues to decline, especially on up days, another sign that the rally is not robust and is not sustainable in the long run. MACD has turned positive but the real story here is the continued bearish divergence as this latest rally translates into a much lower level (7.6). RSI at 58 and moving higher but it, too, shows a bearish divergence. While the bearish case can be made from these indicators, none of them necessarily shows that a major reversal is close at hand. Indeed, with no crossover in the 20 and 50 DMA, the bullish case from sheer momentum is more plausible in the short term.
 With the cheap US dollar underwriting this carry trade driven stock rally, it’s conceivable that the uptrend could continue for some time to come as long as the dollar stays weak. With Obama visiting China this week, there may be greater need to reinforce the message of the "strong dollar policy" for the benefit of all and sundry at least temporarily. So some official pronouncements may be forthcoming that could boost the greenback and therefore take stocks lower. While I do think we will see lower stocks this week, the rally seems likely to continue into early December. Returning to my correction scenarios, I think we will see another minor pullback this week that will not breach the previous low of SPX 1029. The market should then rally back into December, possibly to higher highs. Certainly it would be more bearish if the market failed to make new highs in December as this would be more of a textbook unfolding of a significant correction to follow into early 2010. By contrast, new highs (perhaps to the S&P’s 50% retracement level of 1121) would tend to be more bullish and and from a technical perspective would be less compatible with a major correction. However, technical factors may not be critical here since everything hinges on the dollar. If there is tangible central bank intervention either in Europe or the US, then the carry trade will be interrupted and stocks will fall.
This week looks more bearish than last week as the Saturn-Pluto square will be activated by the transit of Mercury early in the week. Monday afternoon’s Full Moon will occur in in the first degree of Scorpio so that might signal a weak close that could continue into Tuesday. This aspect has the potential to take stocks down significantly, perhaps back towards recent lows of SPX1029. Wednesday may see a reversal higher as the Moon forms an aspect with Jupiter around midday. The late week period will be dominated by the Venus-Mars square that comes exact before Thursday’s session. This is also a potentially difficult aspect, although probably less damaging than the Mercury-Saturn-Pluto combination. Since it is options expiry week, volatility will be higher but some kind of gains are more likely towards the end of the week. Thursday will see an important Moon-Pluto conjunction in Sagittarius. This conjunction occurs midday and will be a kind of mirror image to last Thursday’s pattern when the Moon conjoined Saturn. Since Saturn and Pluto are forming an exact square aspect, this Moon conjunction may trigger another down day. The difference this time will be that the Moon’s dance partner is Pluto rather than Saturn. Generally, I’m less confident it can produce a significant decline, but it still merits attention. Once it comes exact around 2 p.m., stocks may get a lift that could extend to the close. Friday may be somewhat more positive as the Moon with form an alignment with the Venus-Mars aspect. This will be closest in the afternoon so that offers some evidence for reviving prices at the close.
 Next week (Nov 23-27) looks much more positive as the market looks poised to follow the standard Thanksgiving script. Monday and early Tuesday will feature a Venus-Jupiter square that will bring in both Uranus and Neptune into the mix. Now that Jupiter (25 Capricorn) is moving closer to Neptune (29 Capricorn), transits of fast moving trigger planets like Venus will likely have more impact. A big bounce will be even more likely if we see a significant sell-off this week. Some weakness late Tuesday and early Wednesday is likely as the Sun falls under Saturn’s aspect. Much like Mercury’s transit this week, this could release some negative Saturn-Pluto energy. Wednesday looks to finish more positively as Venus will move into proper aspect with Uranus and Neptune. Since this day before the Thanksgiving holiday is traditionally positive, it seems very likely to follow that well-worn pattern. Friday’s half day of trading may also move higher although it seems less committed. Mercury is moving into a very favourable relationship with Jupiter here but it is still two degrees away is it may not have much strength yet. The following week (Nov 30-Dec 4) appears to begin favourably again as Mercury forms a close aspect with Uranus and Neptune. But Thursday and Friday may be more bearish on the Venus transit to the Saturn-Pluto square. The difficulty is likely to continue into the following week as Mercury conjoins Pluto and this will again bring out the dark side of the Saturn-Pluto aspect. This looks like a potentially sizable decline and is a possible beginning to a more significant corrective phase. The bullish Jupiter-Neptune conjunction will likely continue to build after that so more upward movement is possible but it is hard to say if it can take the market to equal previous highs or even make new ones. Given the proximity of the Mars retrograde cycle that begins on December 19, stocks would appear to be more vulnerable as December progresses. We could make a significant low around the time of the Saturn retrograde station on January 13.
5-day outlook — bearish
30-day outlook — neutral-bullish
90-day outlook — bearish
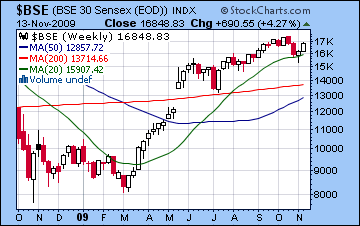
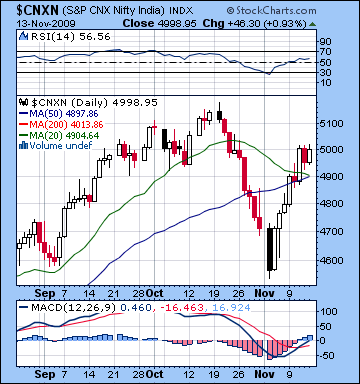 Stocks in Mumbai extended their rebound last week rising 4% for the week as banks and IT were the beneficiaries of fresh liquidity from foreign institutional investors. The Nifty once gain flirted with the 5000 level before closing Friday at 4998 while the Sensex finished at 16,848. This forceful bullish outcome was surprising given the uncertain planetary energy available through the Mercury-Uranus-Ketu pattern. Indeed, this pattern ended up propelling the market higher into Wednesday as stocks backed off somewhat once Mercury began to separate from this aspect and enter the sign of Scorpio. Monday’s gain came in spite of a Moon-Mars conjunction that seemed to only provide pure energy to initiate trading rather than fear. The negative Mars influence may have been offset by the effect of Mercury (28 Libra) conjoining with the natal Jupiter (28 Libra) in the NSE chart, a possibility that I alluded to in last week’s newsletter. As it turned out, this Jupiter contact managed to keep declines to a minimum and sentiment stayed positive in the face of whatever uncertainty the Ketu contact may have generated. While I was largely incorrect in my interpretation of this aspect, we should note that the Moon’s entry into Virgo Thursday did in fact reverse the market direction as stocks moved lower. As modest as it was, this decline coincided with conjunction of the Moon and Saturn and released some of the bearish potential of the Saturn-Pluto aspect. Friday’s gain took the market back near Wednesday’s highs, although the bulls did not have sufficient confidence to take prices higher. Last week’s rise provides important information about the effects of two crucial slower moving aspects. With stocks rallying into the Mercury-Uranus-Ketu aspect, it seems likely that the Uranus-Ketu aspect does not contain significant bearish energy and may indeed be fairly bullish. This will be useful in assessing future transits to this slow moving aspect. Thursday’s decline highlighted the Saturn-Pluto aspect as the Moon’s conjunction with Saturn acted as a trigger. The Saturn-Pluto aspect is the slowest and most powerful aspect in the sky at the moment and will be active for another three to four months. This is a reservoir of malefic energy that will be released from time to time over the course of this aspect and will likely correspond to greater correction in the coming weeks. Stocks needn’t be depressed for the entirety of this period, but the aspect will likely act as a brake on any rallies from going too far.
Last week’s rise prevented a bearish crossover of the 20 and 50 DMA in the Nifty. The gap is now tiny, however, so any further declines will likely complete the crossover and accelerate the decline as momentum investors exit positions. While we did see a slight crossover in July, it was not convincing since it was less than a 1% difference and both moving averages were still moving up. The last full-fledged crossover occurred in the sell-off in February and so any future crossovers should warrant our close attention. The Indian market has been riding a rally increasingly reliant on a flagging US dollar and consequent carry trade liquidity from a variety of international players. Any central bank intervention to the dollar, either in the Europe or the US, would abruptly interrupt this carry trade pattern and cause money a rush back in dollars that would cause equities around the globe to fall. In any event, until markets make new highs (5200) or break below 4500, they will be trapped in a trading range. For the bulls, MACD has turned positive, although this signal is somewhat compromised by the fact that its sits so close to zero (0.460). It also remains in a bearish divergence since current prices match September’s but MACD is much lower now. RSI at 56 is now bullish and rising although it, too, is still in a bearish divergence. Overall, any declines we see this week are unlikely to break support at 4500 after which the Jupiter-Neptune conjunction is likely to take over and move stocks higher into December. This rally will likely match October highs at least and create the possibility for further upside. Obviously, a failure to break above resistance at 5200 would be a bearish technical signal that could spark a larger correction. While this is still very possible, I would also suggest that a higher high, no matter how technically bullish, would still be vulnerable to decline as December progresses especially after 15 December. The stock rally would quickly come undone if there is any central bank intervention to support the dollar and this would ignore any technical signals to the contrary.
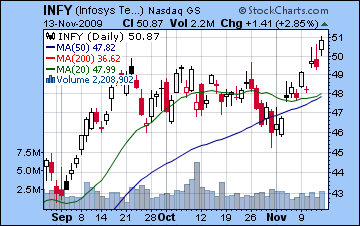 This week looks more bearish than last week as Mercury comes under the aspect of Saturn early in the week and will therefore activate the Saturn-Pluto square. Monday may escape the worst of any fallout here as the Moon is still in Libra with Venus, a supporting energy. Tuesday seems like the worse day of the two as the Moon will join Mercury in Scorpio and create a kind of double trigger for the Saturn-Pluto. Tuesday’s open looks more bearish than the close. Some rebound is possible on Wednesday, especially in the morning as the Moon forms an aspect with the Venus-Mars square. The Venus-Mars square is exact on Thursday and may also cause some problems for the market. Mars is a difficult aspect to handle at the best of times, but here it is very close to its natal position in the NSE chart. While it is not as bearish as the Mercury-Saturn aspect, its specific natal overlay in the NSE chart it not helpful. Thursday’s close would appear to be more bearish than the morning as the Moon will be applying to a conjunction with Pluto, once again potentially setting off the Saturn-Pluto aspect. Friday is harder to call although if we are down earlier in the week, a rebound would be a fairly logical outcome. So the most likely scenario is that the market retraces again towards 4500 this week and possibly into early next week. If Monday is flat or shows only a modest gain, then we could fall below 4700 by Monday the 23rd. If this Monday is negative, then that increases the likelihood of 4500-4600. I don’t expect any decline here to break below that support level. The failure to break below 4500 may well likely spur on a strong rally starting next week.
 Next week (Nov 23-27) looks quite positive and should spark a rally that will continue into December. Monday the 23rd looks quite negative to start, however, as Moon opposes Mars while it is conjunct the natal NSE chart. Some relief is likely by the close which could be enough for stocks to finish in the green. Tuesday and Wednesday could see significant upside as Venus enters an alignment with Jupiter, Neptune and Uranus. At the same time, however, the Sun will fall under a close aspect from Saturn so that should manifest in depressed prices for part of that time window. Since these two aspects occur simultaneously, they may manifest in high intraday volatility where the market fluctuates between positive and negative. Tuesday’s open could lean towards the positive with deterioration by the close as the Moon may form a loose aspect with Saturn and Pluto. Thursday looks fairly positive as the Moon conjoins Uranus in the afternoon although the Mercury-Mars aspect may increase volume and volatility. The following week (Nov 30-Dec 4) looks positive also as Mercury forms a tight aspect with Uranus and Neptune at the beginning of the week. The rest of the week may have a positive bias but Friday’s Venus-Saturn aspect does not bode well. The bearishness will continue into the following week as Mercury conjoins Pluto in square aspect with Saturn. This looks like up to two very bad days that could indicate a 5% decline. The market should rally again after that until at least 15 December and the Sun-Jupiter aspect. At the same time, we will pay close attention to the Mars-Saturn aspect that will be forming around the Mars retrograde station on 19 December. This aspect will be exact in the week prior to the exact station and may diminish the bullishness of the Sun-Jupiter aspect. Nonetheless, I think the market will have mostly upward momentum from 8 December to 15 December. After that, it should weaken into January with a possible interim low formed near the Saturn station on 13 January.
5-day outlook — bearish
30-day outlook — bullish
90-day outlook — bearish
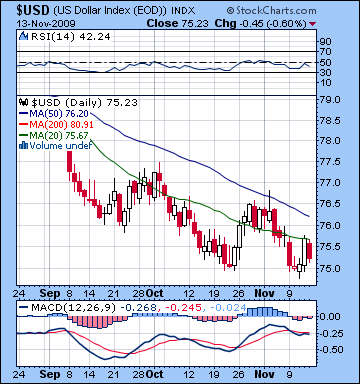 Despite attempts by Fed and White House officials to talk it up, the dollar disappointed for yet another week as it edged closer to the point of no return. Thursday’s gain brought it off the mat somewhat to DX75.6 but Friday saw a return to the dollar dump as it closed at 75.2. I had expected a real bounce here, so this outcome was extremely disheartening. The chief source of error lay in the Mars transit to natal Jupiter. Rather than lifting the dollar, it had the reverse effect as the greenback fell back to its recent lows at DX75. I mistakenly assumed Mars could act as a benefic ruler of the first house (since Scorpio rises) rather than as a natural malefic. Fortunately the late week support did manifest as Venus conjoined natal Pluto on Thursday. But the failure of the dollar to hold onto any gains once the transit had passed on Friday is worrying, even with more favourable transits due for this week. For all the dollar doom last week, the one positive technical point was the formation of a possible double bottom at DX75. If this level holds, it could be a powerful springboard for a sustained rally in the coming weeks. That said, the near term technicals once again look bad. MACD had a negative crossover although it shows a bullish divergence with a higher low (-0.268) that on the previous decline to DX75. RSI at 42 is mired in bearish territory and falling. If it can bounce here before it goes below 35, it would continue the pattern of higher lows which may be ultimately indicative of a rally. But from a momentum perspective, the news is predictably awful. Last week’s hopeful assessment that the 20 DMA was becoming support went down the drain as Thursday’s gain stopped dead on the 20 DMA. Both the 20 and 50 DMA are still falling and show no sign of a crossover anytime soon.
This week will be a last chance for a little while for the dollar to break out higher. For what it’s worth, I think a gain is more likely than it was last week as the Mercury-Saturn aspect is likely to spark an exit out of stocks, if only for a couple of days. Even here, complications abound as the Mercury-Saturn aspect sets up very close to the natal Saturn in the USDX chart. This pattern does not fill me with confidence, and yet it is nonetheless positive from several other astrological perspectives. The late week Venus-Mars aspect sets up on the natal Venus (20 Libra) so that is another potential price mover. The direction is unclear since both bullish and bearish influences are apparent: Venus bullishly conjoins its natal position but bearish Mars squares it. Mars’ previous aspect to Jupiter was quite negative, so it may spark more dollar dumping here. Still, it is at least ambivalent with Thursday looking somewhat better than Friday. I think the best case scenario is a dollar rally back to 76.5, it’s previous late October high and the approximate level of the 50 DMA. I wouldn’t rule out a higher close to 77.5, perhaps as the result of some White House announcement while Obama is in China, but it does not seem realistic given the bearish sentiment that surrounds the dollar at the moment. A more bearish scenario is a more moderate rise this week to perhaps 76 before falling back to 75 by week’s end. That would likely precede a further fall next week and into December. If this were to happen, the dollar could retreat back towards its pre-Lehman low of DX72. While the probable stock rally in the coming week or two will likely put the dollar back on its heels, it may not fall below 75 again as long as the rise this week is decent. Watch for another excellent opportunity for gains — even stronger than this week’s — from Dec 3-9. If there is going to be a definitive break out above resistance levels, then it will likely happen at this time. Assuming we don’t break down to 72 at the end of November, we could see DX77-78 at that point. Then Dec 9-14 looks somewhat more bearish before the dollar turns bullish again, possibly for the rest of the December and into January.
The Euro approached its ‘line in the sand’ resistance level of 1.50 last week before closing at 1.492. There is growing nervousness about the negative trade impact of the appreciating Euro, particularly in Germany which is more export-dependent. Should the dollar slide further and the Euro move significantly above 1.50, it could spur the ECB to intervene and buy dollars in a very public way. While perhaps not as effective as action by the Fed, it could still be enough to put a dent in the carry trade that has pushed down the dollar and extended the equity rally well into the autumn. As disappointing as last week’s rise was, one bright spot was Thursday’s decline which came on cue as the Moon conjoined Saturn atop the ascendant of the Euro chart. This is an important indicator that further declines are also likely when the Saturn-Pluto square are activated, especially since Saturn is so close to the ascendant, which is the root of the entire horoscope of the Euro. Other activations of this aspect are may also generate significant selling. This week is another opportunity for a Saturn activation as Mercury falls under its aspect on Monday and Tuesday. This ought to take the Euro lower, with Tuesday (CET) looking to be more bearish. While the Euro may weaken somewhat this week, next looks fairly bullish after Monday. The Euro is likely to continue to be fairly strong (above 1.45) until Uranus goes direct on December 1. Once it begins to move forward, it will have a reduced influence on the natal Jupiter and will set the stage for the Mercury-Pluto conjunction that will set up on the 4th house cusp on December 7. That early December time frame now looks like it could mark the end of the carry trade and dollar shorting that has dominated financial markets for some months. The Indian Rupee followed equities higher as it improved to 46.4 last week. Some correction is likely this week, perhaps back to 47. It will likely trade between 46 and 47 until early December when it will likely slide further.
Dollar
5-day outlook — bullish
30-day outlook — bullish
90-day outlook — bullish
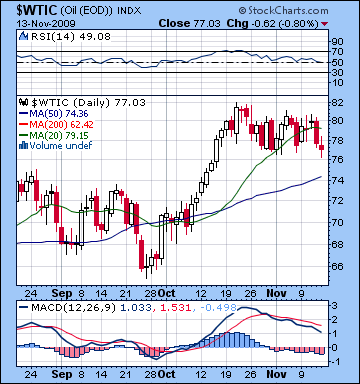 Crude oil spoiled the party last week as reports of rising inventories put a damper on prices even with the dollar continuing to struggle. The biggest move of the week came Thursday as crude fell 3% before closing Friday at $77. Although I was bearish on the week, this modest decline was still disappointing, mostly because the Monday’s gain was totally unscripted as the Venus conjunction to the natal Moon-Saturn was edged out by the simultaneous Mars-Jupiter trine aspect. The late week slump was welcome, particularly as Thursday’s Moon-Saturn conjunction with Mercury offering a helpful hand through its awkward situation near the 6th house cusp. The technical outlook remains fairly negative here as MACD is still in a bearish crossover and heading lower. Despite crude still sitting fairly close to its recent highs, RSI has decayed all the way down to 49 and now points lower. Its current price is in the neighbourhood of its 20 DMA which is now tilting negatively although still very much above the 50 DMA at $74. The next support level is likely around $70-72 and if we get a pullback this week, that level could well be tested. Future rallies will continue to test the $80 resistance level with a breakout rally looking increasingly unlikely. The next support level is $66 but it may be December before that is tested.
This week crude will likely weaken in the early week with some rebound likely by Friday. While the Mercury-Saturn aspect does not hit anything in the natal chart, transiting Mars does form a minor aspect with natal Rahu so that may be an equivalent bearish expression that may take prices lower. In addition, Monday’s Full Moon at 0 degrees of sidereal Scorpio falls under the aspect of natal Mars so that may be a further drag on sentiment over the next few days. Wednesday looks more positive as transiting Venus aspects its natal position while the Moon aspects the ascendant. Thursday may be more negative again as the Moon conjoins Pluto thus bringing out the Saturn influence indirectly. Friday looks more volatile with swings in both directions, although I would lean towards a negative outcome here. A significant rally is likely to take place next week as the Jupiter-Neptune conjunction begins to take hold as we move into early December. The first phase of this rally will probably culminate on December 2 or 3. There should be a major move lower over the next three or four sessions with another rally after that. The second half of December looks more problematic for crude with a possible interim low likely sometime in January.
5-day outlook — bearish
30-day outlook — neutral-bullish
90-day outlook — bearish
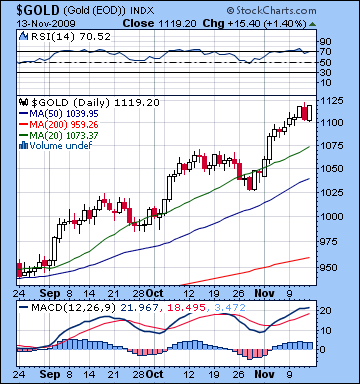 As the dollar swooned on ballooning US deficit fears, enthusiasm for gold pushed up prices another 2% as bullion closed at $1119 on the continuous contract. I had been agnostic last week although I thought we could see higher prices — and maybe a top. I also thought that any decline would be more likely occur later in the week once Jupiter (24 Capricorn) had begun to move away from the natal Moon (24 Capricorn) by midweek. This view was largely borne out as most of the gains were confined to the first three days of the week with a decline coming Thursday. However, Friday’s rise to a new high was a little disconcerting coming as it did after the Jupiter influence was supposedly on the wane. Gold is still very much a momentum play here as prices are well above the 20 and 50 DMA while both averages are on the rise. Prices are currently at the top of an upward trend channel so some kind of minimal correction towards the support level of $1070 may be in the cards in the very near future. MACD is positive and turning higher while RSI at 70 is very bullish as it has formed a triple top with previous highs. This could be seen as a bearish divergence, although it merely represents a series of moderating price rises. One other intriguing element in the RSI chart is that previous forays into the bullish zone have lasted longer. September’s rise shows three moves into overbought area before any correction, while October had two of shorter duration, and now this current rise over 70 is the only one. Not to overemphasize it, but it may signal an imminent correction as the gold rally may be slowly losing steam.
Gold looks bearish this week as the Mercury-Saturn aspect on Monday and Tuesday could make speculation a risky and dangerous proposition. The significator for gold, the Sun, has now entered Scorpio so that is an additional source of potential weakness since its ruler, Mars, is debilitated. Moreover, Scorpio is in the 12th house in the GLD ETF chart. The Venus-Mars square on Wednesday and Thursday may also create more bearishness with Thursday looking very iffy indeed. Friday looks more positive on the Moon-Venus-Mars alignment. If we do see a pullback here, the close proximity of Jupiter to the natal Moon may still manifest as price support, although it will become increasingly unreliable over time. Next week will likely see some kind of rebound in gold which should continue into early December. But the gold story becomes muddled then as the Mercury-Pluto conjunction occurs very close to the natal ascendant. This could take down prices sharply around Dec 7. Then gold will be in an even more challenging environment as Mars begins its retrograde cycle on December 19 in a very tight opposition to the natal Moon. This will be a very sudden reversal of fortunes for gold as prices will start to tumble very soon thereafter.
5-day outlook — bearish
30-day outlook — neutral
90-day outlook — bearish

