Summary for week of November 7 – 11
Summary for week of November 7 – 11
- Stocks to stay bearish, especially in first half of the week
- Euro to fall by Wednesday with a bounce possible by Thursday
- Crude subject to steep declines early with recovery possible Thursday or Friday
- Gold weaker early with partial rebound later
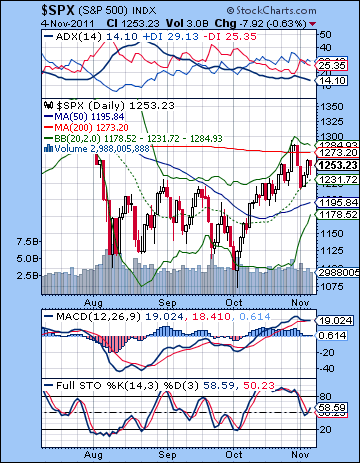 World markets took a dim view of the latest Greek attempt to turn the debt drama into a full-blown sitcom ("Everybody Hates Papandreou") as stocks gave back some of their October gains last week. Despite a game rally attempt later in the week, the Dow lost more than 2% closing at 11,983 while the S&P500 finished at 1253. While my bias was bearish last week, I did not quite fully anticipate the extent of this sell-off. That said, the week did roughly follow the forecast ups and downs as stocks fell early in the week on the Mars entry into Leo and then recovered by midweek. As it happened, we got significant down days on both Monday and Tuesday which revisited the key support level of 1220. The fact that the SPX got down this low was proof that we are now very much in a post-Jupiter phase of the market. Readers will recall that much of the October rally was correlated with the Jupiter-Pluto aspect which culminated on October 28. My overall bearish bias stems from the fact that Jupiter is now weakening as it moves past Pluto so it cannot support sentiment as it did several weeks ago. As a result, short term bearish influences such as the Mars entry into Leo are more damaging now. The midweek recovery arrived more or less on cue as the Mercury-Venus-Uranus provided two solid up days on Wednesday and Thursday. This outcome was also more or less in keeping with the forecast although I had kept an open mind about where it would take us. As it happened, it produced a lower high at 1263. Friday also played out more or less according to plan as the Mars-Neptune aspect coincided with more uncertainty over Berlusconi’s government in Italy and an iffy jobs report.
After all the crazy shenanigans last week, it is clear that the confidence and optimism of Jupiter is full retreat. Papandreou’s early week suggestion for a referendum on the bailout package shattered investor’s nerves as markets began to wonder if Greece would reject the EU-forced austerity and enter a chaotic default process. A disorderly default would introduce a huge dose of uncertainty into financial markets as it might produce bank failures throughout the EU as the contagion effect would spread to all holders of Greek debt. The main goal at the moment seems to be getting debt-burdened countries like Greece and now Italy to agree to austerity measures and take their bitter medicine. Of course, the ECB did cut its lending rate a quarter point in an attempt to free up liquidity and reduce the pressure on private banks which may be on the verge of collapse. But the key word here is austerity and as we know that is Saturn’s bailiwick. One feels sympathy for the Greek people who are facing a bleak choice between EU/IMF austerity that will cut their standard of living by perhaps 25% or going it alone outside the Eurozone and face even deeper cuts to their services and livelihood. But at least it will be their own decision rather than policy that is imposed from without. Now Berlusconi’s resolve to abide by the EU’s austerity guidelines has been called into question and he may be on the brink of resignation. Saturn may be about to claim another victim.
 Last week was a big technical victory by the bears. The huge relief rally was stopped dead in its tracks on Monday right at the falling trend line off the May high. This was also very close to the 200 DMA at 1273 and as a result the SPX only managed two closes above that key technical level. The inability to break above resistance at these lines was a necessary win for the bears if the market is going to retrace lower. The limits of the bears’ strength was evident, however, since they could not push below support at 1220. This is a key level of support since it represents the top of the previous trading range. The bulls successful defense of 1220 means that bears will have to work harder to get the market back in a position to where it can mount a decent challenge of the low at 1074. Until the SPX falls below 1220, bulls do not have to be overly worried. Well, one step at a time. No doubt many bulls will be waiting to go long at 1220 when we test that support again. The bearish case also looked stronger due to the imminent bearish crossover in the MACD. While this hasn’t quite rolled over, it’s hugging the signal line. European indexes do have a bearish MACD crossover, however, and since the Eurozone is leading the market at the moment, that may be foreshadowing the future for the US. The trend following ADX indicator also got a bearish cross of the red line over the blue line with last week’s action. This reversed the bullish crossover that occurred on October 12. Stochastics fell below the 80 line although they are now in a bullish crossover due to the midweek rally. We can also spot bearish-looking hanging man candlestick for Friday. This needs confirmation with a lower close Monday but it definitely warrants close watching.
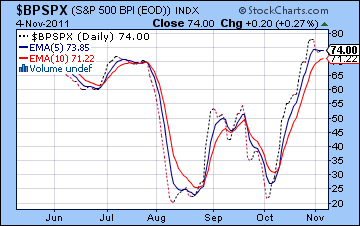
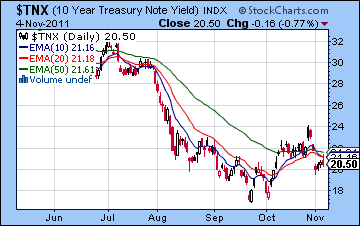
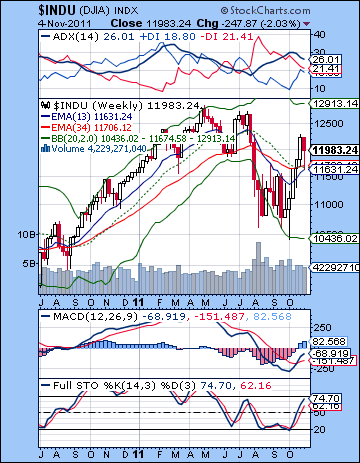 Resistance is likely at Thursday’s high of 1263 and above that at 1290-1300. I doubt we could see anything like1300 in the short term, although we will have to wait until the late November and early December bounce to see. Initial support is likely around 1240. This could coincide with an oversold reading below the 20 line on the daily stochastics. Some eager bulls may try to go long at that point. 1220 is more likely the line in the sand between bullish and bearish intermediate term futures. Below that, 1190 is another important support level that dates back to the previous trading range. The weekly Dow chart reflects the improvements from the recent rally as we can still see a MACD bullish crossover and a bullish crossover in stochastics. Stochastics isn’t quite overbought, however, although a bearish crossover might signal a new wave lower. The weekly candle is a red hanging man — a bearish pattern that tilts towards lower lows ahead. The 13 and 34 week EMA remain in bearish crossover although the gap has narrowed considerably and is less than one percent away from a bullish cross. A similar picture is reflected on the ADX as the gap between the red and green has narrowed but has not yet crossed over. The Bullish Percentage chart is still equivocal although it now tilts bearish — it seems to be rolling over and now there is a crossover of the 5 EMA. Another down day or two and we will have a more convincing sell signal as the 10 EMA will also be in a bearish crossover. Besides the Euro itself (see currencies section), the bond market is another key tell here. Yields have fallen on US treasuries as the European uncertainty and chaos have provided safe haven from riskier assets. Yields have reacted more forcefully than stock prices as the 10-year yield is now below its 10-day EMA. Bonds may be signalling a more bearish near term performance for stocks.
The stars this week would appear to support the notion that we are going lower. The Mars-Neptune opposition that may have reflected Friday’s decline will likely continue into Monday as the aspect is exact at that time. The Sun is also in a minor aspect with Rahu suggesting that governments could be confused at that time (when are they not?). So between those two influences, there is good reason to expect Monday to be lower, at least at the open. I would allow for the possibility of some recovery through the day since Mars will separate from Neptune through the trading day. This pairing is made more bearish by the fact that Neptune is near stationary this week and will end its retrograde cycle on Wednesday. Tuesday and Wednesday may be shaped by the influence of a potentially nasty Mercury-Venus-Saturn pattern. Mercury and Venus are still very closely conjunct this week but they will come under the influence of Saturn through a minor aspect. Although this is a minor aspect, I would be quite surprised it the market rose on these days. I don’t think it is powerful enough to produce two down days — and hence three straight down days if Monday ends lower — but I do think it could well produce a net negative result across Tuesday and Wednesday. Tuesday looks more bearish here given the Moon-Saturn aspect. Wednesday could see a recovery as there is a nice Moon-Jupiter conjunction at the open. Thursday and Friday look more bullish with a chance of being net positive. Friday is perhaps a slightly better bet for gains since Thursday is the Full Moon but it is hard to say with much confidence. Even if the week does not unfold as expected (e.g. Monday is higher), I do think there is a bearish bias in effect at least until the late week Full Moon and likely into next week. Saturn’s entry into Libra on Monday could be likely weighing heavily on markets here. In terms of levels, the early week could easily see 1220 tested once again, with 1190 a definite possibility. A recovery is unlikely to recapture 1263.
 Next week (Nov 14-18) could see a significant rally attempt. Monday could be important as Saturn enters sidereal Libra on this day. This increases the likelihood of a down day. It also increases the possibility of a trend change since there will be a significant shift in the expression of Saturn’s bearish energy. At the same time, Venus and Mercury will conjoin Rahu so that is another reason that we could get a lower low on Monday the 14th. Unfortunately, it is also possible we could simply rally off of the low made the previous Friday and move higher. It’s a tough call. I would lean towards the lower low scenario on the 14th and then rally from there. The midweek Mars-Jupiter aspect should be more clearly bullish so a recovery rally is quite possible. However, Wednesday also features a Sun-Saturn aspect could be bearish, especially since the Sun enters Scorpio. The energy manifested of both of these planets entering new signs is something of a wild card here. For this reason, I would not be hugely surprised if the market continues to fall through to the 18th. That said, it is not something I would not bet on. Perhaps the technical indicators will add some confirming data to the overall picture. The following week (Nov 21-25) looks more bullish and will likely represent an extension of whatever rally has been started. Venus enters Sagittarius on Monday the 21st although it will soon fall under the aspect of Saturn by the close. This could mean an increase in volatility early in the week. Mercury turns retrograde on Thanksgiving so that would be another impediment for any rally potential. Friday’s half-day of trading is usually positive in any event, and the Venus-Neptune aspect would seem to support that statistical tendency. The last days of November should be bullish as Venus conjoins Pluto. But things get dicey as we move into December. There is a very awkward looking Sun-Rahu-Mars-Mercury pattern setting up in early December that could mark a move sharply lower. While Jupiter’s approaching aspect with Uranus looks very bullish at this time (late Nov-early Dec) some of these short term aspects involving Mars and the Sun look more hostile. I am therefore expecting this to be a drag on any rally attempt. We could also start to tip lower during December. This is my default view. A retesting of 1074 looks quite possible in December and into January. I would not be surprised to see a lower low at this time.
5-day outlook — bearish SPX 1220-1240
30-day outlook — bearish SPX 1200-1260
90-day outlook — bearish SPX 1100-1200
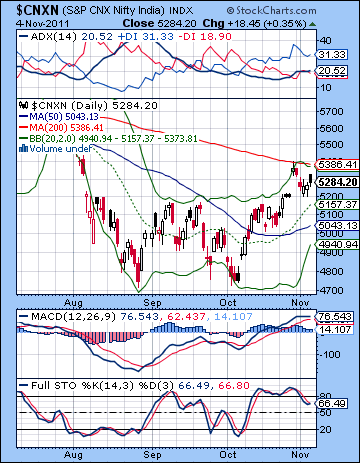 Stocks slipped last week as fresh worries about Greece’s compliance with the latest bailout package undermined investor confidence. Despite a late week rally, the Sensex was down more than 1% closing at 17,562 while the Nifty ended the week at 5284. This bearish outcome was in keeping with expectations as I thought we would likely finish somewhere in the gap fill zone. The early week was bearish as forecast as the entry of Mars into the sign of Leo put markets on edge and prompted some selling. The negativity lasted into Tuesday as this confirmed our more bearish view that the market is now weaker as Jupiter loses power as it separates from Pluto. After an early morning low on Wednesday, the Nifty rebounded into the end of the week. This was also in line with expectations as the Mercury-Venus-Uranus alignment encouraged more risk taking. My call for lower prices on Friday did not come to pass, however, as Indian markets managed to escape the worst of the Mars-Neptune aspect which took most global markets lower on that day.
Europe remains front and centre here as uncertainty has replaced October’s optimism. Whatever the apparent economic benefits of adopting the EFSF, the problem now is mostly political. Harsh austerity measures and an abrupt reduction of people’s standard of living is a very tough sell. Caught between a rock and hard place, PM Papandreou sought to shore up his failing legitimacy through a referendum. This opened up the possibility of a disorderly default and the possibility of a collapse of many of Europe’s largest banks which were holding Greek debt. While the referendum idea has been shelved and Papandreou’s government narrowly passed a confidence vote, the situation remains cloudy. In addition, Italy is now drawing the attention of the EU as its own austerity program threatens to bring down the Berlusconi government. Italy has agreed to IMF monitoring of its deficit reduction efforts, although it is unclear just what that means in practice. Italian bond yields rose to record levels last week reflecting the fact that markets do not have confidence that Berlusconi can trim his budget. It’s all about austerity now as Jupiter’s optimism has faded from the scene. With Jupiter now receding, Saturn appears to be stepping into the breach ahead of its entry into Libra on 14 November. This is likely going to depress sentiment in the short run, at least until Jupiter forms its next aspect with Uranus in early December. Saturn is likely to exercise more of its bearish influence throughout much of December as it approaches its aspect with Jupiter.
 The technical picture remains mixed as the short term trend is still up but the medium term is less positive. Last week’s decline was a probable retracement after testing resistance at the falling trend line and the 200 DMA at 5386. Even bulls would not expect a breakthrough to the upside on the first try so this was perhaps to be expected in any event. Bulls stepped in midweek and bought the dip right at the initial support level of 5200. This should be seen as a significant sign of strength in the up trend. MACD is still in a bullish crossover although it is flattening and may be on the verge of rolling over. Stochastics have fallen below the 80 line but are about to turn higher in the event we get a positive close early next week. Confirming the short term trend is bullish, the ADX is still in a bullish crossover as the blue line is located above the red line, although the gap has narrowed substantially.
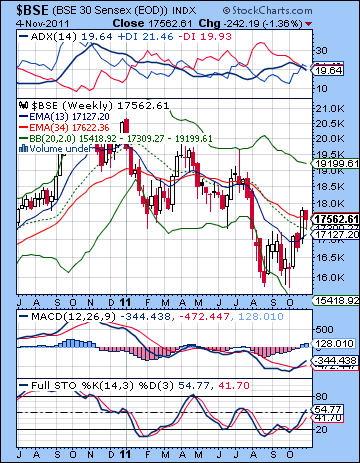
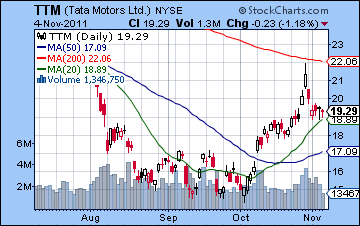
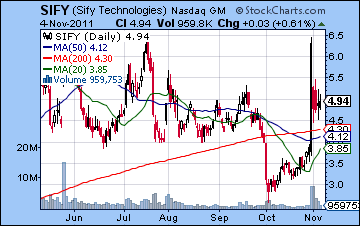
Price bounced off the upper Bollinger band and may be drifting towards the middle line — the 20 DMA at 5157. The 50 DMA at 5043 may also be a source of support. It is worth noting that both the 20 and 50 DMA are turning higher thus reflecting this short term trend. Bears need to push the Nifty below 5200 in order to stem the bulls’ advance. There has been a significant amount of consolidation over the past three months in the 4700-5200 range. The breakout above 5200 is a significant bullish move but the bulls need to fight to maintain the breakout. A close below 5200 would be a defeat for the bulls and a probable invalidation of the bullish double bottom "W" pattern. On the other hand, a close above 5400 would be quite bullish and would signal that the bulls are back in control. Such a move is possible from a technical perspective, although not probable given the MACD looks like it is rolling over. The weekly chart continues to reflect this divergence between the bullish short term trend and the bearish longer term trend. The 13 week EMA is still below the 34 week EMA on the BSE chart, although the gap is narrowing. This week’s candlestick was a bearish red hanging man which is bearish if it comes after a sizable advance. Bulls are getting support from the middle Bollinger band (20 WMA) so a move below this line would give bears momentum to take prices lower. MACD is still in a bullish crossover and stochastics is still on the rise and not yet overbought. Those are both bullish signals. However, RSI may well be flattening out just over the 50 level. This would be a repetition of previous failed rallies in this bear market which have stalled out around 50-55. Tata Motors (TTM) fell with the indices this week after testing the 200 DMA last week. While the chart is not exactly bullish here, it may be looking for support at the $19 level and the middle Bollinger band. If it can’t hold onto the 20 DMA, it is likely to fall back to fill the gap at $17. A most remarkable chart is found in Sify Technologies (SIFY) which rose more than 60% on Monday on an impressive earning report. It quickly resumed its previous trading range for the rest of the week. If it stays above its 200 DMA then it may extend its rally although one possible caution is that Monday’s spike did not exceed its July high.
 This week also leans bearish although the holiday closing may complicate matters somewhat. The opposition between Mars and Neptune is exact on Monday so that may weaken sentiment globally. Neptune tends to confuse the issue so we can expect more uncertainty coming out of Europe, especially since Neptune makes its retrograde station early on Thursday this week. But with Mumbai closed Monday, some of this negativity may be postponed until Tuesday. As it happens, Tuesday also does not look positive due to the influence of Saturn. Mercury is tightly conjunct Venus at the moment which is normally a bullish energy. However, this pairing comes under the aspect of Saturn on Tuesday and into Wednesday. This is likely to reflect a mood of disappointment and frustration. Wednesday offers the chance of higher prices, however, as the Moon conjoins Jupiter in the morning. Even here, however, influence of Neptune could serve to undermine optimism. A positive outcome is still better than 50:50 chance but perhaps not by much. Friday could go either way. This is not to say it will be a flat session, but there are reasons why we could see a gain or a decline. On the bearish side, the Moon is in a square alignment with Mars but Mercury and Venus may be able to shine more brightly once they are free from Saturn. I would still lean bearish here if only because of the approach of Saturn’s ingress into Libra on Monday. That said, a gain would also not surprise me. Overall, there is a good chance we will test support at 5200 this week and it is possible we could break it on the downside. But I would admit that the picture is not as clear as I would like.
 Next week (Nov 14-18) looks more mixed with declines more likely in the first half of the week. Monday’s triple conjunction of Mercury, Venus and Rahu is likely to put added pressure on the market. Saturn’s entry into Libra will also be a stressor so we are more likely to see declines then. Some gains are likely as we head into midweek and Wednesday’s Mars-Jupiter aspect . Thursday sees the Sun enter Scorpio just as it forms an aspect with Saturn so this could erode any previous gains in the week. The following week (Nov 21-25) looks more positive after Monday’s Venus-Saturn aspect. The Sun enters a favourable alignment with Jupiter and Uranus midweek which should help to lift the mood. Some further gains are likely in the last week of November but these are unlikely to hold. The first week of December features a difficult alignment of Sun, Mercury, Mars and Saturn which is likely to push prices down sharply. Some respite is possible in mid-December on the Jupiter-Uranus aspect but it seems choppy at best. I tend to think that these various rally attempts won’t get very far as Saturn moves closer to its opposition aspect with Jupiter in December and early January. I will acknowledge a certain ambiguity here since this aspect never comes exact. This makes it more difficult to know when the time of maximum planetary stress will occur and the market will form a significant low. There are a couple of a possibilities worth mentioning: 26 December when Jupiter turns direct and then 21 January when Mars begins its retrograde cycle and the Sun forms a larger alignment with Saturn and Jupiter. I hope to have a better idea of these dynamics in future newsletters. In any event, February and March look substantially more bullish so a rally seems likely to begin by that time at the latest.
5-day outlook — bearish NIFTY 5100-5200
30-day outlook — bearish NIFTY 4800-5100
90-day outlook — bearish NIFTY 4500-4800
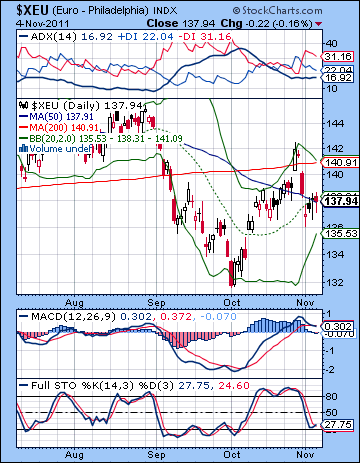 The Euro fell back down to earth last week after the twists and turns in the ongoing Greek saga pushed many buyers into the safety of the Dollar. The Euro closed below critical support levels 1.38 while the Dollar ended the week near 77 and the Rupee weakened slightly to 49. My bearish expectations were over fulfilled as the early week action was much more damaging than forecast. We not only tested the 1.40 support level, we plunged right through it bottoming at 1.365. As expected, we bounced after that as the Euro rallied back to 1.39 by Friday. The Euro slipped back in the technical soup as it returned to the gray area below 1.39-1.40. This is still the line in the sand that divides relative optimism and stability from uncertainty and endless political wrangling. The technical outlook does not look promising. MACD is in the early stages of a bearish crossover while the ADX is still in the throes of a bearish crossover. However, the trend is not strong yet as the ADX line is under 20. Stochastics may offer some hope for bulls who can point to its relatively oversold status. But it is again in a bearish crossover. Perhaps the Euro will make another rally attempt. It needs a few consecutive days closing above 1.40 to regain some stability. The big announcement of the EFSF on October 27 resulted in a grand total of two days above the 1.40 level and the 200 DMA. The 20 and 50 DMA are on the verge of a bullish crossover here so let’s see if it can muster any more upside. I would be quite skeptical it can manage this in light of the MACD crossover.
This week looks like another down week for the Euro, especially in the early going. The key here is Monday’s Mars-Neptune aspect which hits the Euro horoscope near the 12th house of loss. To make this aspect more powerful, Neptune will end its retrograde cycle on Wednesday. This will make this opposition aspect that much more intense, probably manifesting as further declines in the first half of the week. Transiting Saturn is still making a tight aspect to the natal Ketu in the Euro chart so that is another bearish influence this week. I would not be surprised to see a significant drop here, perhaps retesting last week’s lows. We may even see something lower. A positive day is possible on Wednesday or Thursday but Friday looks like it could be negative again. Next week could see an interim bottom put in, perhaps early in the week near when Saturn enters Libra on Monday. Some bounce is likely after that with a short rally into the end of November. I don’t think we will be able to climb back above 1.40, however. December looks bearish as Saturn closes in on its aspect with Jupiter. Admittedly, there is a bullish aspect involving Jupiter and Uranus which may bring some positive results for the Euro. But the difficulty here is that the Saturn aspect will be fairly close at hand for much of the month of December. I am therefore expecting the Euro to break below its recent low of 1.32.
Euro
5-day outlook — bearish
30-day outlook — bearish
90-day outlook — bearish
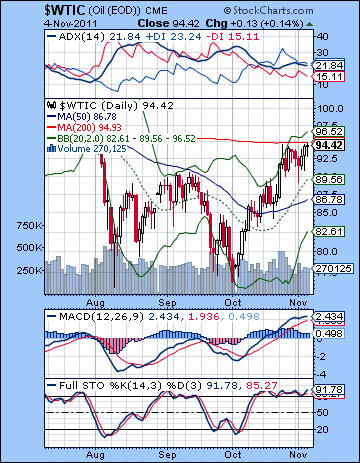 Crude rallied further last week as the demand outlook continued to look positive, especially in light of China’s favourable economic forecasts. After testing $90 early in the week, crude rallied back finishing over $94. This bullish outcome was largely in keeping with expectations. The early week negativity arrived on schedule as Mars entered Leo on Monday. The extent of the downside was a little surprising although crude rallied back fairly hard and tagged the 200 DMA on Friday. The absence of any pullback at the end of the week was a little disappointing, although I had not expected much in the way of downside. Crude is definitely pushing up against some formidable resistance here as it approaches the 200 DMA. Friday’s candlestick was a bearish dragonfly which can often mark the end of an up trend. The weekly candle was also bearish — a hanging man. MACD is still in a bullish crossover however and while the histograms are shrinking it may be premature to expect a rollover. Stochastics are overbought but can remain so indefinitely given a strong trend. ADX remains in a bullish crossover with the trend line over 20 suggesting the up trend is still in place. I would expect bears to be lining up short positions very close to current levels in an effort to ride prices lower. Support is at $90 and the 20 DMA. We can see that crude has moved up in a sharply rising channel off the early October low. A break down seems just around the corner, although it is less clear how much downside we can expect.
This week looks more bearish for crude as the Mars-Neptune opposition will haunt the market for at least a couple of days. Monday’s exact aspect is the most likely candidate for a down day. I would also note that Neptune’s direct station on Wednesday could extend the bad sentiment into the latter half of the week. I do not expect the decline to be as thoroughgoing as that, but there are good reasons to some significant down moves here. Tuesday’s Mercury-Venus-Saturn alignment also looks bearish. Wednesday could be bullish, however, as the Moon-Jupiter conjunction could lift prices. On Thursday there is a neat conjunction of Mercury-Venus with Jupiter in the Futures chart which could also propel crude higher. Friday may be bearish however as the Moon squares Mars. That said, Friday is somewhat ambiguous given the relative absence of other afflictions. If Thursday turns out to be lower, then Friday could bring gains. Next week is likely to begin negatively on the strength of Saturn’s ingress into Libra on Monday. We could see an interim low put in here, perhaps around $80 or below. Some rebound is likely as we head into the end of November although I expect this to be a lower high. December will likely favour the bears as Saturn opposes Jupiter. We could see a low form sometime in January, perhaps near the Mars direct station on January 22.
5-day outlook — bearish
30-day outlook — bearish
90-day outlook — bearish
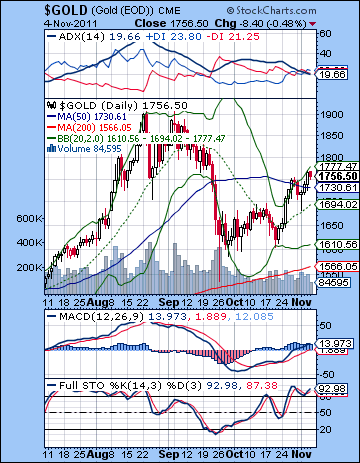 Gold edged higher last week as the ECB rate cut fueled more inflation fears. After briefly trading below $1700 early in the week, gold rallied back closing above $1750. This outcome was largely in keeping with expectations as I thought we would see some declines in the early going on the heavy Mars influence. The midweek also followed the script fairly closely as the Mercury-Venus conjunction saw gold rally back from the lows into Thursday. Friday’s decline was also spoken for as I thought the Moon-Mars opposition would be bearish. I thought the technical picture would tend to reduce the upside, and while it may have done so, gold now finds itself on the bullish side of the 50 DMA. This is quite a significant achievement given its recent journey below $1600. It is pushing up against the upper Bollinger band, however, so we might well wonder how far it can go on its current tank of gas. It is reaching some horizontal resistance near $1770 going back to early September. MACD is still in a bullish crossover although stochastics is still overbought. It seems ripe for some kind of retracement. Support may be around $1680-1700 initially near the 20 DMA. A close below that level would likely hasten a move back to $1600. Gold remains in a secular bull market here as the 200 DMA is still rising and the 20 and 50 DMA are both above it. It would take a major correction to alter the slope of the 200 DMA. Even then the secular bull market would still be intact given that gold has been in a rising channel since 2004. Only a break below support of this channel at $1200-1300 would jeopardize this longer term up trend.
This week looks more bearish for gold as Monday’s Mars-Neptune aspect is likely to be negative. It is possible that this aspect may manifest outside of Monday since Neptune makes its very bearish direct station late on Wednesday. Tuesday’s Mercury-Venus-Saturn alignment also looks bearish for gold with the morning looking the most troublesome. I would expect a net negative outcome between these first two days of the week, with a reasonable chance of declines on both days. The net decline should be fairly sizable, perhaps to $1720. Wednesday looks more positive as the Moon conjoins Jupiter while Thursday could go either way. There is a less positive mood building here although I do not quite see any triggering aspects for it. We could therefore see a two day bounce or at least holding pattern that keeps gold above $1720. Friday looks more bearish on the Moon-Mars square aspect and leading into the triple conjunction of Mercury-Venus-Rahu. We could seriously retest $1700 at some point this week or next. Next week begins with Saturn entering Libra. This could be an interesting change in the dynamics in the gold market. Saturn is bearish in its effects although it does fairly well in Libra. I think we need to be watchful for a potential decline in the early week although I expect some kind of rally to begin during this week also. Whether it begins Monday or sometime later in the week is unclear. It may last for as long as two weeks but I am not expecting too much upside. Then gold should weaken substantially starting around Nov 30-Dec 1. Gold looks set to undertake another major correction in December and January as Saturn opposes Jupiter.
5-day outlook — bearish
30-day outlook — bearish-neutral
90-day outlook — bearish

