

Summary for week of October 17 – 21
Summary for week of October 17 – 21
- Stocks could press higher early in week but declines more likely by Wednesday or Thursday; volatility to increase next week
- Euro likely to push up against resistance at 1.40 this week
- Crude may continue to rise early in the week but prone to profit taking in second half
- Gold may be mixed this week although early gains are likely
Stocks extended their heavenly ascent last week as confidence grew in the coordinated effort to solve the Eurozone debt problem. The Dow climbed more than 5% closing at 11,644 while the S&P500 finished at 1224. The Nasdaq resumed its familiar leadership role as broke through resistance and reached 2667. Jupiter is very much in the driver’s seat here as the dips are being aggressively bought by eager bulls as they run the shorts out of town. While I was not hugely surprised to see the market rise given the approaching Jupiter-Pluto aspect, the extent and relentlessness of the rally gave me some pause. I thought this week would be a test of Saturn’s bearish energy as Thursday’s Sun-Saturn conjunction could offer some indication of the strength of the bears. It did — they are very weak and beating a hasty retreat. Thursday produced the only down day for the week but it was very modest indeed. My expectation for a rise on Monday’s entry by Mercury into Libra was on the mark as we got the biggest gain on the week. Tuesday’s flat result coincided with the supposedly bearish Full Moon. Relatively speaking it was bearish but given the current rally mode it manifested simply as a flat day. Friday’s gain further emphasized just how dominant this Jupiter energy is as it completely overshadowed the Mars-Rahu aspect. My mistake last week was in not giving enough weight to the power of this Jupiter-Pluto influence to offset other shorter term aspects.
So the bullish bias to the market continues to prevail as Jupiter-Pluto aspect approaches its zenith on October 28. Could the market continue to rise into that date? It’s quite possible although I would caution that aspects between slower moving planets such as Jupiter and Pluto often do not peak at the exact time of their aspect. Also, there are some quite tense aspects slated for the last week of October that may increase volatility and push stocks lower. But there is good reason to expect more upside before then as Jupiter (optimism) combines with Pluto (power, greed). This planetary duo is the main reason for the renewed faith in a solution for the Eurozone. As Saturn has receded in prominence, so has the worry over out of control debt levels and the prospects for another recession. The solution of course rests entirely on the ability of the Europeans to create more money and thereby paper over all those bad debts. This is a dangerous game in the long run since the debt is never really eliminated but is merely inflated away. In the short run, however, such a policy can at least look like it is solving the problem. And of course there is still the possibility that the infusion of borrowed money could create enough confidence that it boosts spending and sparks more economic activity. But this is gamble. The return of Saturn into the prevailing planetary picture in November and December looks like we will see more skepticism as the flaws in this bailout approach become more readily apparent.
 The market now stands at the upper end of a trading range that was established in early August. Since the August 9 low, the SPX has mostly traded between 1100 and 1230, with the notable exception of the piercing low on October 4 to 1074. We climbed back to the very upper end of that range on Friday as bulls pressed their luck as far as it would go. Not only is the SPX at the upper end of this range, but it is also pushing up against the upper Bollinger band. In other words, the easier gains are behind us now and any further upside will require more of a commitment to long positions. As an indication of the bulls’ strength, stocks have moved above the 20 and 50 DMA, and have decisively broken above the falling trend line. The daily MACD is now firmly ensconced in a bullish crossover and is above the zero line. The Summation Index is now showing an unequivocal buy signal as it has risen above the 5 and 10 EMA. While these signals suggest more upside, resistance is close at hand at 1230 which marks the Aug 31 interim high. If we get a close above 1230, then we could see a rush towards 1260 which is the next level of resistance. This is the approximate level of the neckline of the head and shoulders pattern that precipitate the decline. It is also the 61.8% Fibonacci retracement level from the high of 1370 to the bottom of 1074. And we should note that the 200 DMA is 1276. In a bear market, the 200 DMA is a traditional area of resistance. So if 1230 falls by the wayside as the bulls madly rush in, bears may retreat to the 1260 level before they attempt another round of shorting the market.
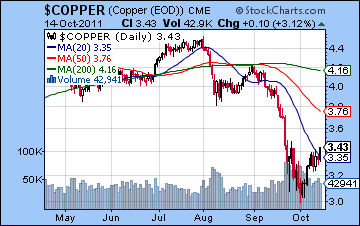
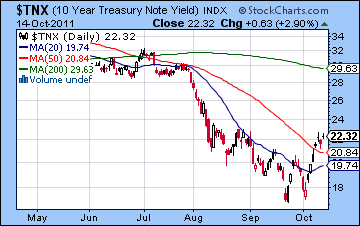
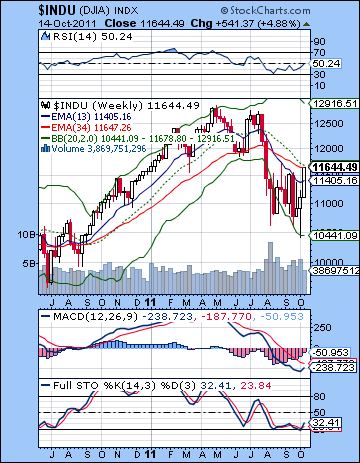 Above 1260, the next level of resistance would likely be near 1300. This represents a 78.6% retracement. It is also fairly close to where the market broke down (1315 actually) and began its waterfall lower. The weekly Dow chart still shows the telltale bearish crossover of the 13 and 34 week EMA although the gap between them is narrowing. MACD is curling up and threatening a bullish crossover. If it did, it would be a bullish medium term indication that the market would moving higher. Nonetheless, it would still have to be confirmed by other indicators — technical and astrological — for it to carry much weight. RSI has bounced all the way to the 50 line. We can still see a series of falling peaks here although if the RSI continues to climb to 60 then it would break this pattern. Copper is following the equities rally although it remains near the bottom of its recent trading range. It will take a close above 350 for it to make a serious run to its 50 DMA at 376. Without a confirming close above the 50 DMA, copper’s relative weakness could be a sign that this rally in stocks may be shaky. There has been a lot of talk recently about the durability of China’s growth and this weakness in copper suggests that many observers are not bullish on China. Treasuries are correspondingly weaker as the yield on the 10-year has risen above 2.2%. This is a clear resistance level and mirrors the same hurdle that the SPX has at 1230. A break above 2.25% would suggest more upside in yields and hence would support a stronger rally in stocks to 1260 and beyond.
This week has a good chance for more gains in the early week as Mercury opposes Jupiter on Monday. In addition, the Sun enters Libra on Monday and thereby comes under the positive Jupiter influence. So the odds are fairly good for more upside. The problem of course is that the market is so close to resistance at 1230 that any further upside implies a major breakout higher. Is there enough upside energy to accomplish this significant achievement? Given the Jupiter-Pluto aspect is still more than a week away from completion, I think we should err on the side of bullishness until proven otherwise. The Mars-Rahu aspect is still fairly close but it seems doubtful that it will produce much downside pressure. If there is any downside, it is more likely to manifest in the morning, with strength into the close as the Moon enters Gemini. Tuesday also looks like it has a good chance for gains as the Moon emphasizes the Mercury-Jupiter aspect. Wednesday could see a trend change, however, as the positive effect of Jupiter should be fairly small while the Moon is in aspect with Saturn. Thursday and Friday are likely to produce at least one significant down day as the Moon conjoins Mars in Cancer. The conjunction is tighter on Friday so that may be more of a wild card day with a somewhat greater chance of a larger than average move. There is still a chance the move could be higher, however, since there is a potentially offsetting Sun-Neptune aspect. It’s quite possible we could see two down days between Wednesday and Friday, although I think that may not be probable. One possible scenario then would be to see the first half of the week higher and then profit taking to set in by Wednesday, or Thursday at the latest. So we could see a run to 1250-1260 by Wednesday. If we get that high, it would be a tempting place to short the market. The upside here may be underwhelming though, so we may only squeak above 1230 by Tuesday, however I tend to think the upside will be higher than that. Any late week downside does not look huge, and we may still finish around or even above current levels (1225). If the week is negative, then that would be a nice bearish set up for the next few weeks as the weekly candlestick would top out right at this resistance zone in 1220-1230.
 Next week (Oct 24-28) should be very interesting. There are several very important aspects, both bullish and bearish. The bears finally have a decent chance of having the skies in their favour here, however. The Sun approaches its aspect with Jupiter on Friday just as the Jupiter-Pluto aspect is exact. This is a very bullish trio and suggests that some upside is likely during the week. At the same time, there is a very nasty planetary alignment between Mars, Saturn, Mercury and Venus. Mars aspects both Mercury and Venus in the second half of the week and this should produce increased volatility. Mars and Saturn are also in close aspect at this time which could increase the size of the move. While the bears have a much better chance of regaining control of the market during the week, the presence of the bullish Jupiter alignment could mean that we will see larger moves in both directions before the bulls crumble. I tend to think the end of the week will be bearish — perhaps manifesting in a large decline on Friday alone. So I would not completely rule out further upside in the first half of the week, perhaps in an attempt to make new highs and then see the market sell-off sometime in the second half of the week. November should continue the down move probably forming a higher low around 1120-1160. We could stay in a bearish phase for the first half of the month and then stabilize around Nov 20. A rally looks likely going into December but it may not be very strong. A more bullish scenario would be a decline to 1140-1160 by mid-November and then another rally 1230-1260 by December. I can’t quite bring myself to call for 1300 here, although I know that some analysts think this is possible. The inability to break above the previous high would spark another round of selling for late December and January which would test 1074. A more bearish scenario would see the decline to 1100 or below by mid-November and then a more tepid rebound to 1180-1200 by December and new lows at 1000-1050 put in by January. The market has been somewhat stronger than expected lately so perhaps I’m less bearish than I was. Nonetheless, we have to first see how bearish things can get once Jupiter loses energy. The mood could shift abruptly again over the next two months so we could easily see a return to overarching negativity.
5-day outlook — bearish-neutral SPX 1200-1240
30-day outlook — bearish SPX 1080-1150
90-day outlook — bearish SPX 1000-1100
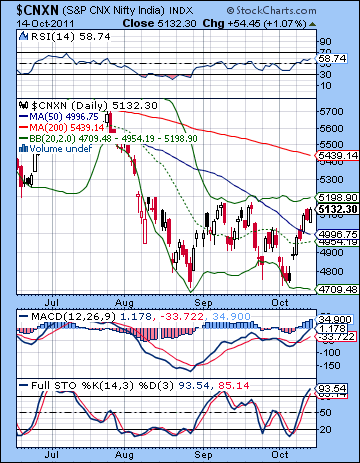 Stocks rallied sharply last week on growing confidence that the worst was over in Europe setting the stage for a more durable economic recovery. The Sensex rose more than 5% closing at 17,082 while the Nifty finished at 5132. While I thought we would see some upside here, this bullish result was at variance with our forecast. Monday’s gain was in line with bullish expectations from Mercury’s entry into Libra. Tuesday’s flat day coincided with the supposedly bearish Sun-Ketu combination. The fact that this bearish pattern near the Full Moon produced no real downside was perhaps testimony to the prevailing bullishness generated by the Jupiter-Pluto aspect. I had noted that this medium term aspect would likely create a bullish bias for much of October. What I failed to recognize was just how much impact it would have on some of these less promising short term aspect patterns. So the late week mix of positive and negative energies still produced more upside for stocks as Friday’s gain more than compensated for Thursday’s pullback. So while I did not predict this bullish outcome, the result did not offer a big surprise either.
Global sentiment is rebounding here in October as large organizations (Pluto) are producing optimism (Jupiter) to fix Euroland’s economic woes. The approach is typically Jupiterian: to print or borrow money in order to stave off creditors and unlock increasingly frozen credit markets. EU officials are hoping that they can stimulate enough economic activity to generate enough revenue to repay the newly created debt. It is an approach that is not without considerable risk. If the economy does not revive soon, then Europe will be faced with the same low growth scenario but with the added burden of a higher debt load. Higher debt will result in higher interest rates which will further hamper lending and expansion. But for the moment, the investment world is looking at the latest bailout plans with a Jupiterian attitude and the cup is very much half full. But Jupiter’s prevailing influence will likely diminish in the days and weeks ahead. The return of Saturn will likely hit with greater force in November as it prepares to enter Libra. When positive planets like Mercury and Venus enter Libra, stocks usually rise. When negative planets enter Libra, the result is likely to be more bearish. At that time, we can expect more dilemmas and contradictions to emerge in Europe and the rest of the world. Saturn’s approach to problem solving is to wipe the slate clean. Let the losers lose (finally) and try to eliminate what is not essential. Bailouts on borrowed money are therefore less likely to offer a persuasive solution to the world’s current economic woes.
 The technical picture moderated somewhat last week as the gains vaulted the Nifty over important resistance in the 20 and 50 DMA. While the 20 DMA is less impressive, the rise above the 50 DMA was relatively new territory and offered the prospect of support at 5000 in the event of a pullback. The rally placed the Nifty within a very short distance from the looming gap at 5200. Perhaps bulls will be able to mount an attack on this level over the coming days. Whether they manage to bridge this gap is harder to say using technical analysis alone. Some indicators suggest continuing bullishness. MACD is in a bullish crossover and is now above the zero line. RSI is now bullish at 58 and may be breaking over the 60 line fairly soon if the rally continues. 60 is often a dividing line between a mere bear market rally and a bonafide rally. Stochastics are getting overbought, however, and may turn lower on the first sign of a bearish crossover. When it happens, such a bearish crossover will be an important test of the bulls’ mettle. If it rolls over quickly as it did in early September, then that would suggest a continued tentative approach.
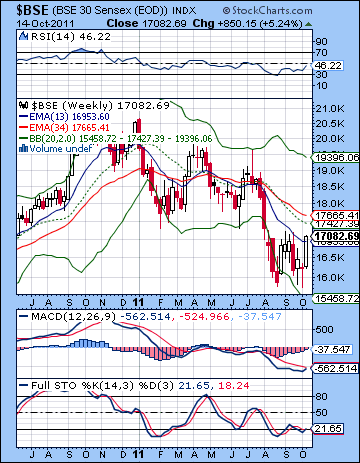
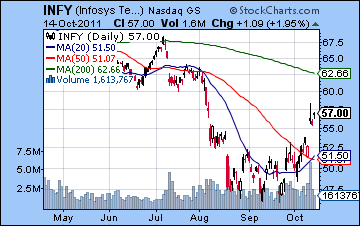
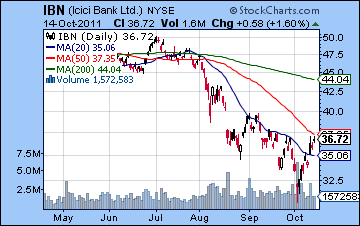
But the bulls still have that double bottom to give them some confidence that higher prices are possible in the near term. But with the Nifty now somewhat overbought, it may require a pullback first before another rally can be attempted to take out the 5200 resistance level. And even if the gap is filled, there is still the matter of the 200 DMA at 5439. With prices struggling to rise to that level, this is nothing more than a bear market rally which few players will have much confidence in. Bulls first have to close the gap and move the Nifty above the 200 DMA and keep it there. Only if they do this will significant new money come into the market. The weekly chart of the BSE hasn’t changed too much. MACD is still trying to close the bearish crossover but has not yet done so. Stochastics are similarly trying to rise above the oversold level but so far have not enjoyed much success. There is still a bearish crossover of the 13 and 34 week EMA suggesting a bear market is in effect. Price has not yet climbed back to the middle Bollinger band which is another sign of extreme weakness in the market. Meanwhile, Infosys (INFY) had a very good week as we got a gap fill of 56 and a substantial move above the 50 DMA. The rise came on good volume which suggests that it may have some staying power. On the other hand, the candles this week looked somewhat cautious as the partial hanging man did not break above the intraday high posted on Wednesday. Resistance remains fairly strong at $62 which is the 200 DMA and also fairly significant horizontal resistance. If the rally does extend to $62, it would likely invite many investors to short at that level. ICICI Bank (IBN) reflects the ongoing weakness of the global banking sector. Despite last week’s gain, it remains below the 50 DMA and seems hard-pressed to break above the Aug 31 high. Last week’s up day volume was not overly impressive.
 This week offers the likelihood of more upside, although there is also some potential negative influences that warrant our attention. The Jupiter-Pluto aspect is still an important source of bullishness so that may well extend the bullish bias for another week. Monday’s Mercury-Jupiter aspect is likely to colour the first couple of days mostly green. At the same time, I should note the waning Mars-Rahu aspect could depress sentiment early on Monday. I do not expect this will be enough to counteract the Jupiter influence, however. If anything Tuesday looks more bullish as the Moon enters Gemini and thereby forms a nice alignment with Mercury and Jupiter. And if that weren’t enough, the Sun enters Libra. Although the Sun is debilitated in Libra, it receives the aspect from Jupiter here so that is another probable source of bullishness. But the more important question is whether there is enough positive sentiment to take the Nifty above 5200. This is hard to say. If Monday closes solidly higher, then I would say the chances are good that we will see at least an intraday move above 5200 on Tuesday. But this is not what I would call probable. Wednesday looks less bullish albeit not exactly bearish. Still some pullback is likely on Wednesday and perhaps even Thursday, especially if the early week has been positive. Then the end of the week looks positive as the Sun is in aspect with Neptune. This is likely to boost prices on either Thursday or Friday, with Friday looking somewhat more bullish than Thursday. So perhaps we get a test of 5200 early, then a retrace to 5000-5100 in midweek, followed by another rally attempt to move over 5200 by Friday. Overall, the week has a good chance of being positive.
 Next week (Oct 24-28) looks less favourable. While the Jupiter-Pluto aspect finally culminates on Friday the 28th, it will do so in the middle of several negative aspects. Mars will aspect both Mercury and Venus on Wednesday and Thursday while at the same time being in a partial aspect with Saturn. This alignment has a very negative potential that could take the market down sharply. Just when it will occur is a little uncertain, however, given the presence of the bullish Jupiter influence. It is possible this could manifest as large price swings in both directions. So it is possible we could get that gap fill up to 5300 before it reverses lower. Certainly there will be a long queue of bears waiting to short the Nifty at 5200 and then at 5300 if it should climb that high. The following week (Oct 31-Nov 4) also looks bearish so we could see the beginning of a significant retracement. This bearish bias will likely last until at least the middle of November and the entry of Saturn into Libra. There is a good chance we will see 4750 tested again. Another rally attempt is possible at the end of November and into early December but it looks fairly weak and is unlikely to match the October high. At this point, I think December and January will have a bearish bias with the likelihood of new lows for 2011. 4500 on the Nifty is a very likely possibility and I would not rule out 4000. The market should again undertake a rally into February and March. This should be a lower high, however. I am expecting the bear market logic of lower highs and lower lows to prevail until the end of 2012.
5-day outlook — neutral-bullish NIFTY 5100-5250
30-day outlook — bearish NIFTY 4700-4900
90-day outlook — bearish NIFTY 4000-4300
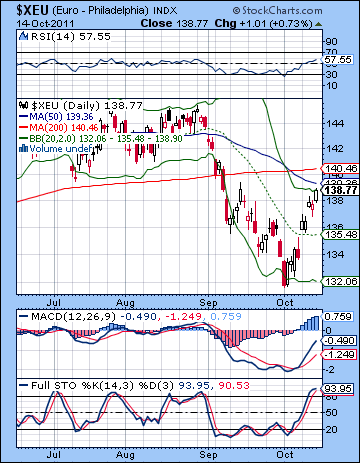 The Euro continued to show signs of life last week as it rose Lazarus-like towards the tantalizing 1.39-1.40 resistance area. The Dollar Index slipped below 77 while the Rupee strengthened to 49. I was wrong about the Euro as the downside was quite minor after Monday’s massive gain. At least I got that much right as Mercury’s entry into Libra re-energized the risk trade once again. Wednesday’s gain also corresponded closely with the Venus-Jupiter aspect. But now all eyes are on the 1.40 level. This was support over the past several months and its breakdown marked the beginning of the late summer swoon. In classic fashion, support may now be resistance. A close above 1.40 would be seen as very bullish indeed. That said, the dark forces who shall remain nameless may wish to run some stops around that level and cause a tsunami of short covering which could produce a spike somewhere north of 1.40. Bears will be lined to waiting to short at 1.40 of course, but it is possible there could be some shenanigans. Not only do we have horizontal resistance at 1.39-1.40, but the 50 and 200 DMA come in close to that level, as does the upper Bollinger band. One would think that resistance would be as formidable as Alcatraz and rather not like the Maginot Line. We shall see. Stochastics are overbought here which helps the bearish view of things but MACD and RSI are pointing higher. 1.40 will not fall easily or quickly so we should expect more than one attempt will be necessary. It is unclear if there will be enough upward momentum for a second attempt, however.
This week offers up the real possibility of more upside as Monday’s Mercury-Jupiter aspect is likely to push the Euro higher. 1.40 looks doable at least on an intraday basis in the early part of the week. The second half of the week is less positive, however, as the Sun comes under the aspect of Saturn in the Euro horoscope. This is a bad aspect and should create at least one major down day on either Wednesday or Thursday. Two down days are also possible, although that may be less likely. Friday could conceivably be bullish as the Sun-Neptune aspect hits a sensitive point in the Euro chart. Overall, the chart tilts bullish this week, especially given the Jupiter-Pluto aspect which comes exact the following week. I would therefore not be surprised if we break above 1.40 here. Much will depend on how deep the midweek pullback is. Next week looks more volatile with larger declines possible. Some upside is still quite likely, however, as the Jupiter-Pluto aspect is not due until Friday the 28th. The end of the week looks more bearish. The first half of November should be mostly negative with the Euro declining back to 1.32-1.34. This is a minimum expectation. A bounce is likely in late November and early December but mid-December looks quite bearish as Saturn opposes its natal position in the Euro chart. We could see 1.29 at some point in December.
Euro
5-day outlook — bullish
30-day outlook — bearish
90-day outlook — bearish
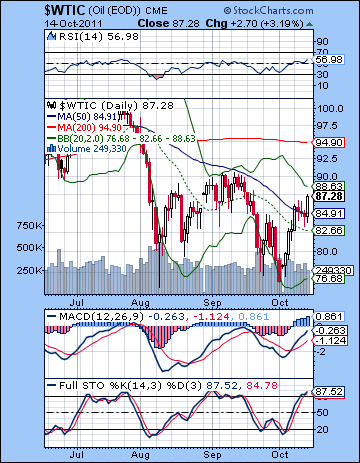 As confidence in the global economy returned crude oil pushed higher by 5% on the week closing above $87. My forecast was badly off track as the anticipated bearishness from the Sun-Saturn conjunction never fully materialized save for some very modest declines on Tuesday, Wednesday and Thursday. While I expected some upside Monday, I did not expect the gain to be so large and to outweigh the subsequent declines. So it seems there is no escape from the bullish effects of Jupiter-Pluto. But the heavy lifting is only now beginning. That’s because crude is now pushing up against resistance of the falling trend line from the April high. It is also close to the upper Bollinger band and similarly has to contend with significant horizontal resistance at $90. Since the 50 DMA offered some resistance at $85 it is likely it will give support in the event of a minor pullback. The technical case for some kind of pullback is seen through stochastics which are now overbought. A bearish crossover on the daily chart would likely see $85 tested fairly quickly. MACD is still below the zero line although it is in a bullish crossover. A larger correction would retest support at $75. However, if the correction followed another lower high at $88 then it would increase the likelihood of a lower low, perhaps down to $70.
This week will likely extend the bullish trend, although the down days may be larger than last week’s. Some early week strength looks likely on the Mercury-Jupiter aspect and the Sun’s entry into Libra. Tuesday may well be positive also as the Moon will combine with Jupiter. Some weakness is more likely closer to the close. Wednesday looks less bullish on the Moon-Saturn aspect. A decline is therefore more likely. Thursday may also be negative although the planets do not look as bad. Friday looks somewhat more positive again so that increases the odds for gains at the end of the week. Overall, we could see more upside so that falling trend line may well be broken to the upside. I am less inclined to think that resistance at $90 will be taken out, however. The following week will likely see a rise in volatility as Mars aspects both Mercury and Venus in the second half of the week. A decline is possible here, although I would also not be surprised to see crude briefly rise further. As the Jupiter-Pluto aspect culminates on Friday the 28th, this week could mark a significant interim high. November looks more bearish as the loss of Jupiter’s energy will effectively stop the rally. Saturn is likely to increase its influence as it enters Libra and this should begin a significant new corrective phase. While I am expecting another rally in late November, it seems unlikely that it will take out the October high. December and January look more bearish again.
5-day outlook — bullish
30-day outlook — bearish
90-day outlook — bearish
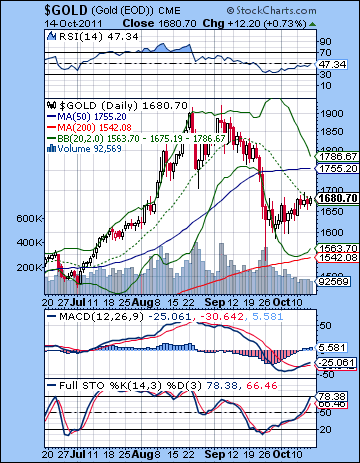 Gold has again benefited from the increased risk of inflation from the Eurozone bailout plans. Gold rose 2% on the week closing near $1680. This was a disappointing and unexpected result as I thought the Sun-Saturn conjunction had the potential to push prices substantially lower. Saturn was weaker than I thought, however, as Jupiter again vanquished the ringed planet. I was correct in calling for a gain on Monday’s ingress of Mercury into Libra, although I greatly overestimated the extent of the bearishness from the Full Moon. While we got declines on Tuesday’s Full Moon and Thursday’s Sun-Saturn conjunction, they were quite minor indeed. Gold appears to be building a base here from which it can rally further. We can see the outline of a bullish ascending triangle pattern which could conceivably see a rise to $1750 and the 50 DMA. A break below support at $1650 could be quite bearish, however, and could produce a wave of selling. Gold has finally rebounded as high as its 20 DMA — a minimum sort of rally in the bearish chart. However, volume has been quite thin over the past two weeks so that is one area that could spell vulnerability down the line. Stochastics are not yet overbought suggesting it has more room to run. MACD is in a bullish crossover but has yet to cross above the zero line. Gold needs a close above $1700 to confirm this bullish move and extend the rally. If it cannot close above the 20 DMA over a couple of trading days, then it could make bulls nervous.
This week has a good chance for more upside as Mercury is in aspect with Jupiter on Monday and the Sun enters Libra on Tuesday. So far, gold’s recent rise has been quite muted but there is a chance that it could breakout significantly higher, perhaps above $1700. But Wednesday’s planets look less favourable so I would expect some decline to begin and possibly carry over into Thursday. Friday could conceivably be positive, although it is somewhat less favourable than the early week. Next week is harder to call. On the face of it, the aspects tilt bearish for most asset classes including gold. But Friday’s Sun-Jupiter-Pluto alignment looks quite powerful and could prevent a significant pullback from occurring until the first week of November. That said, I would not be surprised to see bearish moves begin during this week. We should be ready for any outcome here on this complex planetary pattern. Perhaps if gold has rallied to $1750 and the 50 DMA during this week, it would become an attractive shorting opportunity. November looks mostly bearish as Saturn enters Libra. This could be quite negative for gold since Libra is the sign owned by gold’s co-ruler, Venus. At some point in November and December, we could therefore retest the low formed by the piercing candle on September 26 at $1540. Lower lows are also quite possible although I am uncertain about the exact timing of a deeper correction.
5-day outlook — bullish
30-day outlook — bearish
90-day outlook — bearish