- Choppy week ahead with sizable moves in both directions
- Dollar unlikely to make much headway here; next week is better
- Gold likely to move sideways
- Crude oil likely to form a top
- Choppy week ahead with sizable moves in both directions
- Dollar unlikely to make much headway here; next week is better
- Gold likely to move sideways
- Crude oil likely to form a top
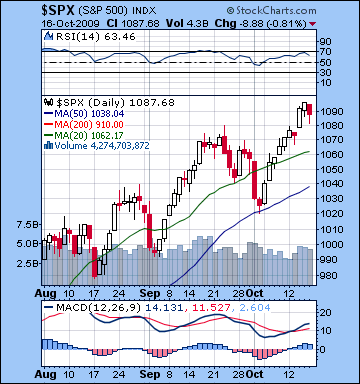 Buoyed by positive earnings from Intel and JP Morgan, the Dow hit 10,000 last week as the bulls on Wall St. showed no visible signs of fatigue. After Friday’s retreat, the Dow closed up over 1% for the week at 9995 while the S&P stood at 1087. Needless to say, this was a very surprising outcome given my bearish forecast. I had expected the Venus-Saturn-Rahu pattern to generate more selling early in the week, but Monday and Tuesday ended up mostly flat. While I had predicted more buying later in the week on the Mercury-Uranus-Neptune pattern, the bulls showed up a little ahead of schedule as Wednesday and Thursday saw healthy gains. Friday’s modest retreat occurred on the day of the exact Mercury aspect, which was also somewhat confounding. But from a larger perspective, the market has has shrugged off a series of potentially malefic configurations and made fresh highs. The Saturn-Uranus opposition on September 18 did mark the beginning of a small 5% pullback in the following two weeks, but did nothing to break the general upward trend. The failure of the market to correct thus far in October may be due to the Saturn-Rahu aspect acting as a pivot (or high) for the trend rather than the more common endpoint (or low). Usually, multiple planet patterns mark trend reversals in stock prices. If the planets involved are malefic such as Saturn, these aspect patterns often coincide with significant lows. Conversely, when the patterns are comprised of benefic planets like Jupiter, the market may reach a noteworthy high. But there are also occasions when the reverse is true. That is, malefic patterns mark the high and begin a new negative trend. For example, the market top of October 2007 coincided with a rare, malefic triple conjunction of Venus, Saturn, and Ketu. While the market advanced into this apparently bearish conjunction, it fell for the next 12 months. On the other hand, the financial meltdown of October 2008 coincided with a more predictable situation whereby the negative pattern of Sun-Saturn-Rahu corresponded with a significant low. In the present circumstance, it is therefore possible that the bearish October pattern of Mercury-Venus-Saturn-Rahu may roughly coincide with a significant top. Since I am still mostly bearish in the short term, that is my current view. What is now required is a powerful enough trigger for the accumulated negative energy to be released. I mistakenly thought that Mercury or Venus would be sufficient, but that was not the case. There are still a couple of potential triggers out there that bear watching over the next few weeks.
The market’s technical position improved last week as MACD turned higher and we now see a bullish crossover. The bearish divergence is still very much in evidence as higher highs have not been matched in MACD. But these kinds of divergences can go on for weeks before they correct so it cannot be given too much weight. More bearish perhaps is the RSI which touched the oversold 70 line this week but did not rise above it. It then turned down again and now stands at 63. This is still in bullish territory, but maybe indicative of some selling in the near future. Volume picked up a little last week but the new highs were not accompanied by significantly higher volume suggesting that the market is still having some problems attracting buyers. Nonetheless, from a pure momentum perspective, the rally looks as strong as ever. The market is trading well over its 20 and 50 DMA and both of those lines should be seen as support. The 50 DMA in particular offered support at 1020 in early October as the market rallied back off of that level. Any decline may also confront strong resistance at the 50 DMA, now at 1038. The bearish rising wedge also figures into this picture as the market has once again traded up above of its support level, now at 1050. Upper level resistance is around 1100-1120 so it’s conceivable we could see a rally towards that level this week. But after another and presumably (and hopefully!) final rally attempt here, the market will retest the 50 DMA at 1040-1050. When it breaks below that level, it is liable to fall fairly quickly towards the 200 DMA at 910. It is still my belief that we could get there by mid-November. Adding some support to the bearish view is the fact that the put-call ratio now sits below the crucial 0.60 level, a sign of overconfidence in the market which could spark a significant correction. Finally, the Fed ends its treasury buy back program this week and is planning a large auction next week. With less Fed money supporting the bond market, more private (i.e real) money will have to step in to fill the breach, with an outflow of cash from the stock market as a probable consequence. This is another reason why stocks may be due for a substantial haircut in the not-too-distant future.
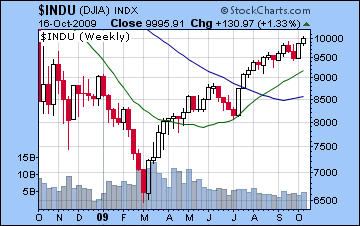 This week offers the prospect of significant gains and losses with further upside possible going into Tuesday’s Mercury-Jupiter aspect. Monday has a chance for a decline, possibly a large one, on the Mars-Pluto aspect and the Sun-Rahu square. Both of these aspects are somewhat tense but given the proximity of the Mercury-Jupiter aspect, it is not clear if the day will finish in the red. One possible scenario is a negative start to the day with buyers moving in in the afternoon to cut losses. Tuesday may well start positively as the Mercury-Jupiter aspect is often symbolic of optimism from good news. There is some possibility for weakness in the afternoon as the Moon will aspect Saturn. Wednesday and Thursday seem more vulnerable to declines as Sun forms a minor aspect with Saturn. Wednesday may be somewhat more positive given the weak aspect between Venus and Neptune. Friday has the potential for a sizable move although the direction is not clear. Mercury is approaching a favourable aspect with Uranus and Neptune here so that augurs somewhat better for the bulls. Overall, the week could finish positively although if we see a good sell-off Monday, then it that could set the tone for a very choppy and volatile week. And while there are daily aspects that seem somewhat favourable this week, the downside risk increases as time goes on as the influence from medium term aspects could begin to overwhelm the situation. Rahu (1 Capricorn) is edging closer to changing signs in November where it will activate both Uranus (29 Aquarius) and Neptune (29 Capricorn). The backward-moving nodes, Rahu and Ketu, are potential triggering planets mentioned above, and their sign ingress can cause instability and uncertainty, especially when aspected by other planets as they are here.
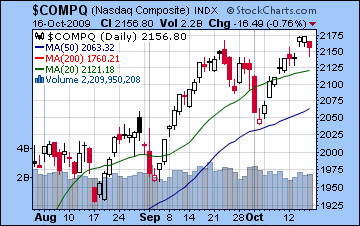 Next week (Oct 26-30) looks more solidly bearish as Mars will form a square aspect to the Sun. Tuesday and Wednesday of that week look the most afflicted, so we may see significant declines then. Some gains are likely as the week progresses, however. The following week (Nov 2-6) also seems bearish although the early week may see gains on the Venus-Rahu aspect. Markets should weaken after that, however, as Mercury conjoins the Sun on Wednesday and then forms a difficult aspect with Saturn on Friday. November looks mostly negative until the middle of the month, with a possible interim low forming sometime between November 9th and 20th. This will coincide with the Saturn-Pluto square aspect and the Ketu-Uranus aspect. Some bounce off the lows is very likely as Jupiter is set to conjoin Neptune once again in early December. This should be a substantial rally that could retrace at least 50% of the decline, and possibly more. Prices should fall again as we get closer to the Mars retrograde station on December 19. This looks like another major leg down into January and possibly extending into February. How much of a decline will depend on what kind of sell-off we see over the next four weeks. If November is only mildly negative with lows between SPX 950 and 1000, then we could see a double top formed with the rally into December which will increase the chances for a much larger downturn into January. If November is more bearish, however, then some of that bearish energy will have already been used up and the New Year’s decline may be relatively shallow, albeit likely at a lower low than November.
5-day outlook — bearish-neutral
30-day outlook — bearish
90-day outlook — bearish
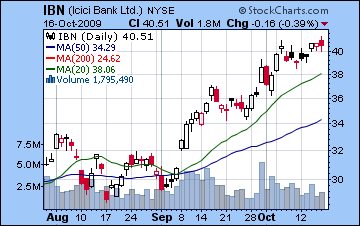
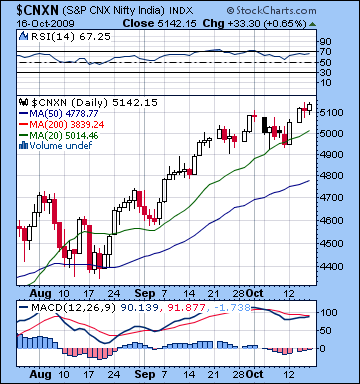 The bulls were running again in Mumbai as stocks rose 4% on encouraging earnings reports both at home (ICICI) and abroad (Intel). With Monday’s session providing most of the lift, the Sensex climbed to a 17-month high of 17,322 while the Nifty ended the week at 5142. In light of my bearish forecast, this outcome was disappointing to say the least. The rally has been unstoppable even in the face of putatively negative patterns like Venus-Saturn-Rahu. The market was closed Tuesday, the day of the Venus-Saturn conjunction, so that might account for some of the discrepancy, but Monday’s gain was very good and came at a time that I thought stocks would be more vulnerable. One possible explanation is that these malefic multi-planet patterns are acting as peak level pivots rather than their more common low water marks. When malefic planets like Saturn are involved in complex geometric patterns, the most common correspondence is with a falling market. This is what happened with the meltdown in October 2008 which occurred at the time of a Sun-Saturn-Rahu pattern. The pattern itself coincided with a significant low, just as the March 2009 low also corresponded with a malefic Saturn-Venus pattern. But there are occasions when these apparently malefic patterns do not correspond with lows but rather market highs, as happened in October 2007 when there was a rare triple conjunction of Venus, Saturn, and Ketu. While Mumbai peaked three months later in January, global equity indexes peaked in October at the time of this malefic configuration. In that instance, the malefic pattern marked the beginning of the downturn that would last 12 months, rather than the downturn itself. This may be what is happening now, as the Mercury-Saturn-Rahu and the Venus-Saturn-Rahu could well be marking an approximate top to the market. I had thought that the fast moving transiting planets of Venus and Mercury would be strong enough to act as triggers for the accumulated bearish energy from the past two months, but I was incorrect. It seems that a stronger trigger is required, perhaps Rahu and Ketu, as they approach aspecting Uranus and Neptune over the next few weeks.
Stocks remain in a technically mixed condition. MACD has turned upward but has yet to form a bullish crossover. A negative divergence is still evident as higher highs have not been confirmed by MACD levels, although one cannot take these divergences as signs of an imminent reversal. RSI is strong at 67 and rising towards the 70 level. There, too, one can make a bearish case in that new highs have not been confirmed on RSI as the three most recent peaks form a downward slope. Volume is fairly unimpressive (not shown) and perhaps more noteworthy for the bears is that Monday saw the biggest gain of the week but volume was at its lowest. This may be a further indication of the tentativeness of the rally at these levels. Nonetheless, the momentum remains solidly bullish as prices are above both the 20 and 50 DMA. Both are significant support levels, and while we expect a major pullback here, it is possible that the first phase of the sell-off may bounce off support, perhaps at the 50 DMA around 4800. This is what occurred in the August correction, and despite how overbought the market is, it’s entirely possible that a correction from now until November may see two stages. Some kind of rebound rally is likely at the end of November and into early December. At the moment, I can see two possible scenarios: 1) we see a fairly modest correct in October and November to 4500-4700 and then a rally into early December that forms form a double top with current levels (5100-5250) or, 2) we go lower in November to 3800-4000, and then the December rally will make a lower high of perhaps 4500-4700. In both scenarios, we are likely to start a new leg down around the time of Mars retrograde on 19 December which will likely last well into January and the Saturn retrograde station. A shallower decline in November will likely increase the size of the January decline, and vice versa. Either way, we should be below 4000 by January, perhaps well below.
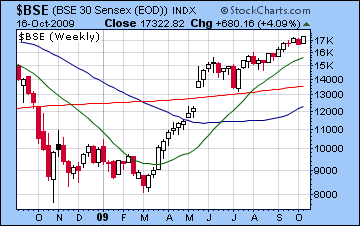 This week looks mixed with some strong aspects increasing the chances for sizable moves in both directions. Monday’s holiday closing may help Indian markets avoid some of the problems of the Mars-Pluto and Sun-Rahu aspects. Tuesday seems more bullish as Mercury is aspected by Jupiter which usually indicates positive news and optimism. However, it’s also possible that the market will have to digest Monday’s potentially negative global cues a day late so that confuses the issue somewhat. Wednesday and Thursday seem more vulnerable to declines as the Sun forms a minor aspect with Saturn, although Wednesday may be more bullish on the Venus-Neptune aspect. Friday is another important day for the rally as Mercury is in close aspect to Uranus and Neptune. Under recent circumstances this sort of combination has produced gains, and it probably will here also, but watch for any signs of weakness. If the rally is going to continue, the bulls will need Tuesday and Friday to both be positive. This could prove to be too tall an order, especially given Tuesday’s ambiguity. Overall, I would not rule out a positive outcome this week, but I would lean towards profit taking as some of the more difficult medium term influences may start to impinge on the short term aspects.
 Next week (Oct 26-30) offers a more persuasive case for the bears as the Sun is in aspect with Mars in the early and midweek. Tuesday and Wednesday appear to be the worst days of the week, with Wednesday likely the more bearish day of the two, especially in the morning. It is at this point that the market may break some significant support levels. Wednesday afternoon could see a rebound that extends into Thursday as Venus is aspected by Jupiter. The late week period looks fairly difficult as well so the bulls may begin to feel threatened as rallies are less likely to get anywhere. The following week (Nov 2-6) may begin strongly as Venus aspects Uranus and Neptune but sellers may again come in by the end of the week as the late week looks quite negative on the Sun-Mercury conjunction. While there will be some positive days going into mid-November, the double effects of the Saturn-Pluto aspect and the Uranus-Ketu aspect may be too much for the bulls to handle. These are both disruptive aspects and have the potential to take prices down further. Unlike the declines of Saturn-Uranus (18 Sept) Saturn-Rahu (8 Oct) that never materialized, I would note that these tense November aspects also form important aspects in the NSE natal chart. This increases the chances that these aspects will deliver more in the way of a downside move. To reiterate, if the November decline is modest and the Nifty stays above 4500, this will increase the size of the next down move starting in mid to late December.
5-day outlook — bearish-neutral
30-day outlook — bearish
90-day outlook — bearish
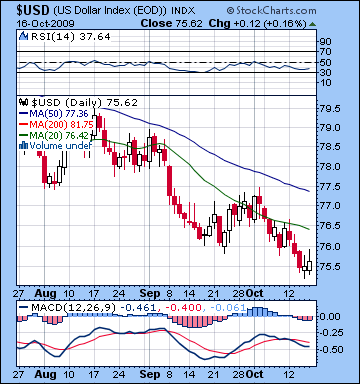 Positive corporate earnings spelled another terrible week for the dollar as investors preferred stocks to greenbacks as a reliable storehouse of value. Even with two modest up days at the end of the week, the dollar closed down a whole cent and finished at 75.6 against a basket of currencies. While I have been calling for the dollar to break out of this downward spiral, last week’s suspicions about the Saturn-Sun aspect unfortunately proved correct as any lift from the Jupiter aspect to the ascendant has been totally negated by the transiting Saturn. Not even the Mercury conjunction to the Midheaven early in the week could relieve Saturn’s gloom. While the technical picture is grim, there are still rays of hope. Prices remain trapped in the falling wedge, which means at some point, the dollar will turn around and when it does, it may explode on the upside. MACD has turned lower, however, and we saw a bearish crossover early last week. A bullish divergence is still discernible as lower lows have not been confirmed by the MACD moving averages. RSI stands at an anemic 37 and has a hint of an upturned grin to it. In keeping with the bullish falling wedge thesis, we can also see a potentially bullish divergence as lower lows in prices have not been matched by lower RSI. A key resistance level will be the 50 DMA at 77.5 so any closes above that level should see the dollar break significantly higher. While this week might bring better news, I think next week may be a better candidate for the break out above wedge and moving average resistance.
This week offers new chances for dollar gains although I’m not convinced we will see much of them after all is said and done. Monday will be a key day as Mercury will conjoin the natal Mars and Venus will conjoin the natal Midheaven. This is a double influence that suggests a big move is possible. While both may plausibly propel the dollar higher, we have to make sure that the lingering hangover effects of Saturn to the natal Sun are truly over before a dollar rally can ensue. Tuesday looks negative as the Moon comes under Saturn’s aspect right on top of the Sun-Saturn conjunction. One more gain is possible Thursday or Friday as Venus comes under the positive influence of the natal Jupiter. Overall, it could be another middling week, although we may actually avoid seeing another loss. This could provide enough reassurance to really get the dollar moving higher next week. The best chance for a big up day would therefore be the 27th or 28th when Venus is aspected by Jupiter. After that, I can see the dollar adding a cent per week as we move deeper into November. The dollar rally should continue into the second or third week of November after which there will be a retracement. December and January both look generally bullish as the trend seems positive until approximately January 20.
The Euro capitalized on the dollar’s misfortunes and even outshone the Yen as it closed at 1.49, up by almost two cents on the week. I had expected selling to accompany the Venus-Saturn conjunction to the Euro ascendant, but that turned out to be a positive influence. Saturn is now all by itself on the Euro’s ascendant so that may be the necessary condition for a more definitive correction in the recent run-up. At some point, the Saturn-Pluto square has to take the Euro down hard, it’s just a question of identifying the right trigger. This week could see a couple of days of losses as the Sun opposes natal Saturn on Monday or Tuesday. Mercury will conjoin the natal Mars around the same time, so that is another possible source of bearishness. Friday stands out as a likely up day as Mercury will form an aspect with the natal Jupiter and Wednesday also could be bullish. All told, the Euro could be fairly flat this week as its recent upward momentum may stall. Next week could see a dip as Mercury opposes the natal Saturn. This could create an important negative feedback loop since Saturn is transiting the ascendant. The Indian Rupee held its own last week as it closed mostly unchanged Friday at 46.37. While this week may see it hover around the 46.5 level, next week will likely see it fall sharply to 47. It seems destined for 48-50 by January.
Dollar
5-day outlook — neutral-bullish
30-day outlook — bullish
90-day outlook — bullish
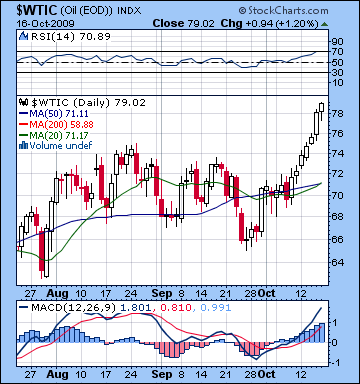 With the dollar falling into wide disfavour, crude surged to a new 2009 high and closed above $79. While my forecast was badly in error, I remain an unrepentant bear here as slow moving Saturn will stay in aspect with Rahu in the Futures chart for a few weeks longer. The source of last week’s rise is something of a mystery, however, and that is puzzling. Certainly some boost was expected from Mercury’s late week aspect to the natal Sun and indeed that is where crude derived much of its gains. But the absence of any early week selling could possibly be linked to the co-presence of Venus with Saturn that precluded the more bearish scenario from manifesting. We shall have to watch crude carefully as Venus gradually separates from Saturn and leaves the Great Malefic to its own devices. Last week’s gains were parabolic and hence, possibly indicative of a blow-off top. MACD features a bullish crossover and has turned sharply higher, although even here I would note that despite the higher highs, its current MACD value of 1.8 is equal to its August highs. This still could therefore be seen as a bearish divergence, albeit relatively minor at this point. RSI at 70 and has reached its highest level in several months. While it may foretell of an extended period of bullishness, it is just as likely to mark a final climax since any declines below that level could be seen as more decisive.
This week looks pretty wild for crude with wide swings in both directions. Monday could be quite negative as the Sun-Rahu square will set up against the natal Mars. Tuesday may be a middling sort of day, but Wednesday stands out as another potential big mover. Unfortunately, it is unclear which direction prices will move. The Sun will activate the natal Rahu for a bearish influence but Venus will be fast approaching an aspect with the Sun-Uranus natal complex. Generally, I would think the bulls should carry Wednesday with the possibility of Thursday going to the bears. Friday seems like another up day as Venus forms a minor aspect to the natal Jupiter, but here again, there are signs that go the other way as Mars squares the natal Moon-Saturn conjunction. It’s difficult to call an overall direction for the week, but I would lean towards a lower close by Friday. Next week seems much more bearish as the Sun-Mars square will set-up on the Moon-Saturn conjunction at 9 Libra. This could mark a shocking collapse of prices. In percentage terms, the last week of October could see the largest decline in this retracement phase. A sharp recovery is likely in the second half of November as Jupiter will conjoin Neptune in close aspect to the Futures ascendant.
5-day outlook — bearish-neutral
30-day outlook — bearish
90-day outlook — bearish
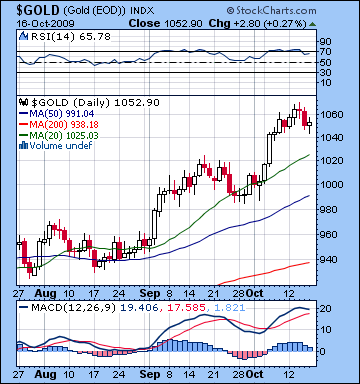 Despite investors continuing to bail out of the dollar, gold was largely unchanged on the week as it closed at $1052. While this apparent anomaly in the commodities rally is good news for gold bears, last week’s forecast left a lot to be desired. In particular, the Venus-Saturn conjunction corresponded with a modest rise rather than a fall in prices. While disappointing, one can readily spot an alternative explanation since the Venus-Saturn conjunction occurred in the generally favourable 10th house. It is not inconceivable that such a conjunction could drive up prices, although admittedly it was not my preferred interpretation. Venus may have played a special role here in marking the rally (or the top?) because it is the 11th lord of gains in the GLD ETF chart and it was placed at the "top" of the chart. In any event, gold’s technical situation has deteriorated somewhat since last week as MACD has turned lower, although it remains in a bullish crossover. More troubling perhaps is that RSI at 65 has fallen below 70 after spending two weeks in overbought territory. This is a classic reversal signal. All the key moving averages continue to rise, and they will act as support when gold retraces. The 50 DMA at $990 in particular may offer support in the initial stages of a correction. The 200 DMA now stands at $938 which is very close to August consolidation levels, so that may well act as a second support level.
This week looks choppy for gold as there are a number of possible aspects that could affect prices. The early week looks like a jumble since transiting Mars (8 Cancer) will aspect the natal Rahu (8 Libra) while Jupiter will aspect Mercury. These could well end up as offsetting influences but I would lean towards a bullish bias after Tuesday’s session. Wednesday may see a turn as Sun forms a bearish aspect with Saturn. This may also manifest on Thursday and points to some bearishness at that time. The end of the week may turn bullish again as Venus lines up with natal Jupiter. Overall, the outlook seems somewhat bullish, but if Monday is significantly lower, then that would limit the potential upside and may even push gold lower for the week. If we do see bullion decline this week, then that will increase the retracement size going into November. Next week looks much more bearish as the Sun-Mars square will set up on the natal Mars. This could produce a sharp decline over a couple of days. While gold seems poised to retrace here, the continue presence of Jupiter near the natal Moon for the next few weeks merits careful attention. This is a bullish influence that will help support prices for the next several weeks. Gold will likely stay fairly strong until Jupiter moves away from the Moon in late November. For this reason, I am expecting steeper declines in December, January and even into February.
5-day outlook — neutral
30-day outlook — bearish
90-day outlook — bearish

