

Summary for week of October 24 – 28
Summary for week of October 24 – 28
- Stocks to increase volatility this week; gains somewhat more likely in first half
- Euro may continue to press up against resistance but weakness more likely by Friday
- Crude strong early but more prone to declines as week progresses
- Gold mixed this week with gains more likely in first half; further declines likely in November
Stocks marched higher above important resistance levels last week as hope and rumor of a durable European bailout package was enough for most traders to keep this October rally going. Despite some significant pullbacks, the Dow was more than 1% higher closing at 11,808 while the S&P500 finished at 1238. This bullish outcome was broadly in keeping with expectations as I thought a bullish default was the safest bet given the approaching Jupiter-Pluto aspect. More specifically, I was caught off guard somewhat by Monday’s sell-off. I had expected more solidly bullish outcomes in the early week on the Mercury-Jupiter aspect. While I noted the bearish possibility of Monday’s fading Mars-Rahu aspect, I did not fully expect it was capable to depressing prices. Wrong. In any event, Tuesday’s rally was strong and the SPX matched the previous high of 1230. As expected, we saw some declines after that as Wednesday and early Thursday were lower as the Moon-Saturn cast a shadow over the proceedings. Friday’s gain was also roughly in line with expectations as the Sun-Neptune aspect offered the possibility of gains.
So this bear market rally continues ever upward for another week. Even if much of the momentum has been driven by short-covering bears, there is no doubt that this has been a powerful move — over 15% on most indexes since October 4. It has coincided quite closely with the fading of the negativity of the Saturn-Ketu aspect and the onset of the optimistic Jupiter-Pluto pairing. Jupiter and Pluto symbolize the successful efforts of large organizations to enhance prosperity. Thus far, the Eurozone leadership has been making all the right noises about getting their house in order and preventing a debt crisis from spiraling out of control. The market is assuming these efforts will be successful and the package will be large enough to deal with all contingencies. This expected number is currently around 2 Trillion Euros. But what does the market do after the agreement is announced? The current rally would appear to be discounting the agreement already so if it merely satisfies expectations then it could sell off. If it exceeds expectations either in terms of amounts or administrative mechanism, then we could see the market rally higher. With the Jupiter-Pluto aspect exact this week on Friday the 28th, there is some reason to expect that an agreement will be forthcoming this week. For this reason, I would not rule out further upside since the market has been mirroring this aspect fairly well over the past three weeks. And yet once the aspect is exact on Friday, it is unclear how much further the market could rally. Aspects sometimes continue to exercise a positive influence after they have culminated but usually not for very long. The bottom line is that we could see a new negativity soon, either this week or next.
 It was a huge technical victory for the bulls last week as the SPX punched above resistance at 1230. Friday’s close at 1238 was a renunciation of the trading range that has characterized the market since August. Thursday’s retracement to 1197 reflected the extent of the bullishness as this was the minimum Fibonacci level (23.6%) from the previous high. All of a sudden, the upside potential looks more plausible. The next level of horizontal resistance is around 1250 which near the March and June lows. This also represents a 61.8% retracement from the July high to the October low. I would expect this level to be tested quite soon, perhaps as early as Monday, barring some unexpected announcement out of Europe. After that, the 200 DMA at 1274 could be the next line in the sand although it may not act like a hard and fast barrier but rather as a more general magnet. The bearish case would be in trouble if it pushed beyond the 200 DMA. Beyond that, the 78.4% retracement from the May high to the October low comes in around 1306. That would be a stunning rally if it made it that far. In terms of support, bears have to take out 1190-1200 if there is going to be any serious correction here. I still think there is a lot of downside potential, although the first leg down may only get as far as 1140-1160. This would hit the falling trendline from the May high that previously acted as resistance. But as long as buyers come in at 1190 and keep this week’s lows in, the short term trend is up. But perhaps just as we overshot on the downside in early October, this rally to 1238 may be an overshoot on the upside. If this breakout is going to hold and not be considered a fake out, bulls must defend 1230. If the SPX falls below 1230, then it will be interesting to see how the market reacts. Another close below 1230 would allow the trading range to re-enter the picture once again.
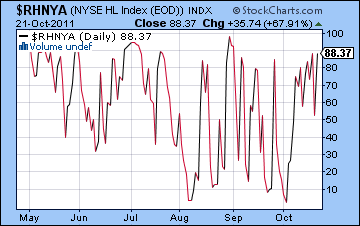
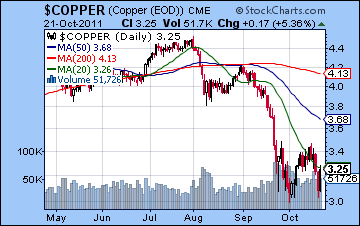
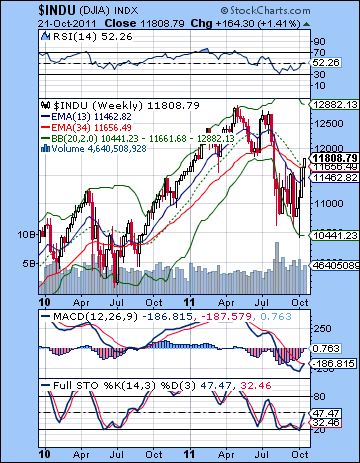 The indicators still look bullish here. MACD is still in a bullish crossover on the daily chart. RSI has climbed back to 60 while Stochastics are still overbought. Both the 20 and 50 DMA have turned higher. The Summation Index is still showing a clear buy signal and the high-low index is moving into overbought territory at 88. This is comparable to the levels usually seen before significant market pullbacks. It’s not to say that it can’t move higher for another day or two, but the odds increase of some kind of sell-off. But there are some potentially negative divergences to take note of also. Bond yields have not set new highs here, although they are close. This lack of confirmation of new highs in bonds may suggest that the rally in stocks is getting ahead of itself. Copper has also not followed the lead in equities as we got a retest of the previous October low at midweek. This is a very bearish indication and should give bulls pause about being too aggressive. Copper is an important indicator of future economic activity and if it is soft, then it lessens the likelihood of robust expansion down the road. All of which suggests that this is very much a bear market rally that is borne as much out of hope and short covering as any long term expectation for a rebound. Bear market rallies can be quite powerful and often cause consternation to both bulls and bears. Bulls because they are so strong they falsely believe a powerful, new trend is emerging and bears because their short positions are wiped out. Meanwhile the weekly Dow chart shows more encouraging signs for bulls. MACD is on the verge of a bullish crossover while Stochastics continues towards rise to the center line. RSI has moved above the 50 line and is now looking somewhat more bullish. It would still take another several more weeks worth of rally before we got a bullish crossover of the 13 and 34 week moving averages, however.
This week could be very interesting. As noted previously, the Jupiter-Pluto aspect is exact on Friday the 28th. This aspect lines up with the Sun so that is a powerful source of upside. But the picture is greatly complicated by the co-presence of a bearish alignment of Mars, Mercury, Venus and Saturn. Mars and Saturn are both negative influences here so there is likely to be some significant downside here. How it all plays out is somewhat harder to judge. I am leaning bearish overall here but I should caution that there is a real possibility of a rebound leading up to that Sun-Jupiter-Pluto on Friday. Until the Jupiter-Pluto aspect is out of the way, it is somewhat harder to assume a solidly bearish stance. One possible scenario is for further upside Monday morning on the Sun-Uranus aspect, but for weakness into the close. Perhaps the SPX takes an intraday run to 1250 on Monday. Tuesday looks more bearish as the Moon conjoins Saturn while Venus comes under the aspect of Mars. Mars is also in a minor aspect with Saturn so there is a potential for a larger decline on Tuesday and into Wednesday. Wednesday is actually more of a conundrum as there is a New Moon opposite Jupiter that day. This has the potential for gains so it could undermine the effect of the other bearish planetary alignment. So even if we get a big decline Tuesday, there is a chance that it will bounce big on Wednesday. Or the New Moon could act like an amplifier and make the bad aspects worse than they would otherwise be. It’s really hard to say. I honestly wish I could be more categorical about it but I have to acknowledge some ambiguity here. For this reason, I would not be surprised if the rally continued to 1250 and beyond nor if the rally was snuffed out and we tested support at 1190-1200 once again. Perhaps we will see both outcomes sequentially. The aspects this week do increase the odds of a larger than normal moves though. The high number of aspects this week does make me wonder if we will see the top here. Market tops and reversals often coincide with a high number of simultaneous aspects.
 Next week (Oct 31-Nov 4) looks more mixed. We could see a post-alignment sell-off on Monday as Mars enters Leo. This will extend the Mars aspect onto Mercury and Venus for another few days. However, Mercury will conjoin Venus by midweek so some upside is likely. The following week (Nov 7-11) could bring more weakness as Mercury passes Venus and both approach their conjunction with Rahu. Mars opposes Neptune on Monday the 7th while Mercury and Venus are in aspect with Saturn on Tuesday the 8th. These look like significant declines. We should see the corrective move extend into mid-November at least. I am expecting a significant pullback here — perhaps to 1150 level on the SPX. It is difficult to estimate the extent of this corrective move but I would tend to think that it will be higher than the October 4 low. It should also be significantly lower than last week’s low of 1190. Look for a rebound rally to commence no later than Nov 24 and this could easily extend into December. Many observers are expecting new highs on this rally, perhaps to 1300. That seems overly optimistic although I would concede that it will be substantial. By mid-December this second leg should run out of gas and we will get another retracement lower. The big question is whether this will be to a new lower low. I think a lower low is possible here although it is not necessarily a probability. I’m hedging on this now because this October rally has been stronger than expected. A lot will depend on what kind of intervening rally we get in late November and early December. If it’s strong and breaks above the October high, then it would likely take the December-January lower low scenario off the table. But the November-December period does look quite afflicted and bearish so we will have to pay close attention how the aspects are playing out. If Jupiter fades quickly this week, then that could change the mood abruptly and we could see selling pressure increase.
5-day outlook — bearish SPX 1200-1230
30-day outlook — bearish SPX 1120-1150
90-day outlook — bearish-neutral SPX 1100-1200
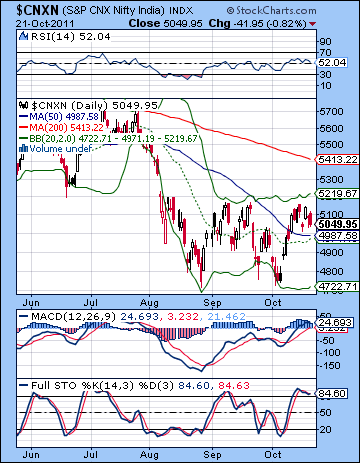 Stocks fell modestly last week as fears of another RBI interest rate hike offset growing optimism over a possible Eurozone agreement. Despite trading above the 17K level midweek, the Sensex declined 2% closing at 16,785 while the Nifty finished at 5049. This outcome was more bearish than expected, as I thought we would see more early week upside around the Mercury-Jupiter aspect. As it happened, we got two down days as the Mars-Rahu aspect cast a surprisingly long shadow. The upside from the Mercury-Jupiter aspect did not manifest until Wednesday’s gain but it was downhill after that. We saw some rally attempts on Thursday and Friday but the intraday global cues were timed such that the gains could not be sustained into the close. As the result, Friday’s bullish Sun-Neptune aspect mostly registered in Europe but after the close in Mumbai.
The bearish outcome was a reminder of the relative under-performance of Indian stocks given the fairly positive planetary environment that has lifted many global bourses in October. Emerging markets remain under pressure here as India and China are still dogged by inflation woes while foreign investors are cautious about committing any new funds in light of the Eurozone uncertainty. The medium term outlook is not good here as the Jupiter-Pluto aspect will become exact this week. Once this mostly bullish influence begins to wane, the market may be harder pressed to find any upside. It is fitting perhaps that an EU agreement is due in the coming days during the culmination of this aspect. As I have noted previously, Jupiter and Pluto represent coordinated action by large scale organizations that is directed at prosperity and profit. Thus far, however, it is unclear what the agreement will contain. The market seems to be looking for a sufficiently large bailout fund on the order to 2 Trillion Euros. If the agreement comes up short of this amount or there is some other issue such as Germany insisting on veto power, then the market could sell-off. And of course, there is always the possibility of selling the news even if it lives up to expectation. While some lingering positive sentiment is possible after 28 October, the odds are increasing that the market will take a more bearish turn in November. Not only will Jupiter’s bullish energy be subsiding, but Saturn’s bearishness will again have an opportunity to come out as Saturn enters Libra. These two influences stack the deck in favour of the bears in the near term.
 There was very little change in the technical picture last week. Monday saw another failed test of 5200 while Tuesday’s low bounced off the 50 DMA. The 20 and 50 DMA in the 4950-5000 area are important support levels which bulls will have to maintain if they hope to make a go of it here. That was the fourth failed attempt at 5200 and one wonders how long the bulls can keep it up before they throw in the towel. Of course, the bullish double bottom is still very much in play so as long as they can keep the Nifty above 4950, then they can continue to launch attacks at that 5200 level and the gap that lies above it. MACD is still in a bullish crossover but the histogram is shrinking now perhaps pointing to lower prices in the short term. Stochastics are still overbought but remain safely above the 80 line. Bulls will have to defend that 80 line or risk significant downside.
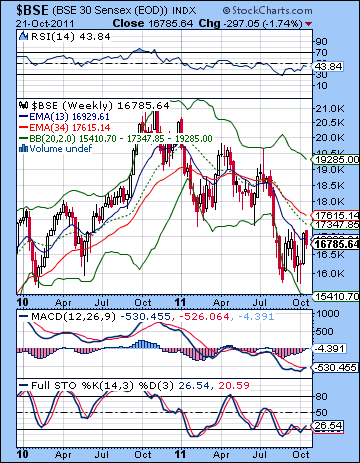
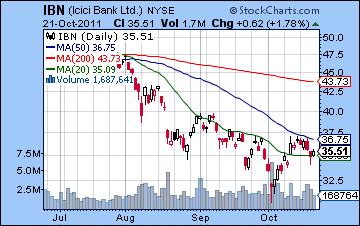
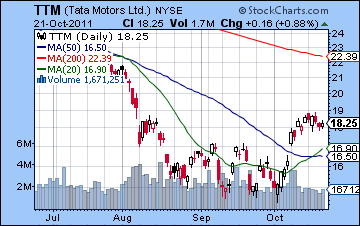
The bear market is still very much in evidence as the 200 DMA is sloping downward while the 20 and 50 are beneath it. The Nifty has sufficiently stabilized to produce a flat or gently rising 20 and 50 DMA although it remains to be seen if this will be a place from which a significant rally can be staged. There is so much overhead resistance that bulls have to be content with small victories. They still have to close above 5200, then continue higher to fill the gap and then close above 5300. Only then will a more plausible case be made for a significant rally and a possible end to the bear market. But we are a long way from that right now. On a more bullish note, the weekly BSE chart has the MACD on the verge of a bullish crossover. This definitely bears watching as it could signal a shift in momentum in the event of rallies into that resistance zone. Stochastics are also in a bullish crossover and again trying to rise above the 20 line. The positive divergence from the RSI suggests that we could see more upside in the near term although it is uncertain how long this bounce could last. The 13 week EMA remains well below the 34 week EMA suggesting that the bear market has further to go. A crossover on these moving averages would be quite a bullish indicator and would encourage a more positive interpretation of the market going forward. The banking sector remained under pressure last week as ICICI Bank (IBN) slipped lower after tagging the 50 DMA. This is a bearish move to be sure and suggests more weakness to come. Moreover, down days occurred on larger volume suggesting the selling has not yet been exhausted. Tata Motors (TTM) filled its gap at $19 early last week but then promptly fell back. While the stock shows signs of consolidation after a lengthy bottoming process, we will have to see if this proves to be a gap and fade move that produces lower prices ahead.
 This holiday-shortened week could see volatility increase and possible moves in both directions as there are a high number of aspects. Generally, my bias is bearish here. That said, there is a real mix of aspects this week that make outcomes somewhat harder to call. Monday’s Sun-Uranus aspect could boost the market briefly although it is uncertain if it will last until the close. Tuesday looks more negative as Venus comes under the negative influence of the square aspect from Mars. This aspect is made potentially more negative because Saturn is also forms part of the alignment. I would therefore expect a net negative result on the first two days of the week, perhaps significantly so. The 20 DMA at 4950 could easily be retested this week and lower levels may also be in play. The Diwali holiday break on Wednesday and Thursday occurs during the closest Venus-Mars aspect so some of that bearishness may be removed (or delayed) from the picture. By the time of Friday’s re-opening, the Mercury-Mars aspect will be in play. This is another negative aspect that could weigh down prices. However, at the same time, the Sun forms an alignment with the Jupiter-Pluto aspect which is usually positive. The simultaneity of these two opposing influences makes outcomes ambiguous. I would lean towards a bearish bias while recognizing that Friday’s Jupiter influence could offset much of that negativity. So I am expecting the Nifty to finish somewhere below 5000 this week. At the same time, I would not be surprised if some of the bearishness was postponed until after the Jupiter-Pluto aspect was completed in November. I should also note that the close proximity of these many aspects could make this week into a significant turning point.
 Next week (Oct 31-Nov 4) looks to begin quite negatively as Mars enters Leo on Monday. The midweek could see a rebound on the Mercury-Venus conjunction but weakness may return by Friday. Overall, this week tilts bearish although perhaps not by much. The following week (Nov 7-11) also begins negatively as Mars opposes Neptune. The mood will not improve much through the week as Wednesday’s Mercury-Venus-Saturn alignment could take prices even lower. There is a good chance the Nifty will retest its recent lows of 4700 at this time. I would not be surprised if we saw lower lows, perhaps 4500 here, although I would not say that is a probability either. We may therefore have to wait for the triple conjunction of Mercury-Venus-Rahu on 14 November before there is much chance of upside. A rally may slowly build over the second half of November after Saturn has entered Libra. I am uncertain how strong this rally may be, but it does not seem overly powerful. The Mars-Rahu square aspect on 11 December could mark the beginning of another corrective move. This one may last until the end of December or early January. Sentiment should substantially improve by the end of January and set the stage for a significant rally into February and perhaps March. While some upside is possible in 2012, it seems quite unlikely that it will make significant new highs above 6000. While the first half of 2012 is more bullish than the second half, the Nifty may find it a struggle to reach 5400 by mid-2012. The second half of 2012 looks quite bearish so new lows are likely by December. This is the time when we could even see a retest of 2500 on the Nifty.
5-day outlook — bearish NIFTY 4800-5100
30-day outlook — bearish NIFTY 4500-4800
90-day outlook — bearish NIFTY 4000-4500
p.s. A very happy Diwali to all!
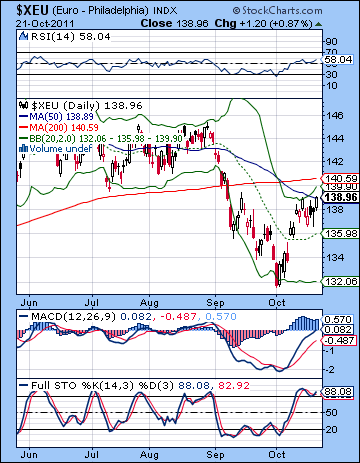 As hope for a bailout agreement drew near, the Euro rallied last week closing just under resistance at 1.39. The USDX finished lower at 76.39 while the Rupee weakened to 50.02. This bullish outcome was largely in keeping with expectations as I thought the Euro would get a lift from the early week Mercury-Jupiter aspect. This proved to be the case although my suspicions that we could actually rise above the line in the sand at 1.40 were not borne out. Friday’s rally also coincided quite closely with the Sun-Neptune aspect. It is perhaps not too surprising that the Euro should have found its way back to the scene of the crime, or rather the place where it broke support in early September. For a while there, it seemed inconceivable that the fledgling Euro could mount such a persistent rally all the back to 1.39-1.40. That’s what government bailouts are for I guess, as they give investors hope that debt will be erased and growth can resume. Bernanke’s magic touch on QE1 an QE2 certainly created a precedent for bullishness in situations such as these. Large scale printing and coordinated efforts can solve the problem at least temporarily. The case of the Euro is more complex however since it involves several key actors (ECB, Germany, France, etc) and each with their own specific vested interest. If they do hammer out a deal in the coming days, then it is possible there could be a massive short covering rally past 1.40 and back up to 1.45 or so. I think this current rally already assumes a fairly sizable fund as it is and an announcement of an adequate deal might not provoke a huge response. Selling the news is also definitely a possibility.
This week could well begin on a positive note as the Sun-Uranus aspect hits a sensitive point in the Euro chart. But Tuesday’s Moon-Saturn conjunction would appear to be more negative and could create a spillover effect to the broader negative alignment of Mercury-Venus-Mars. This could increase the size of the down move into something larger than usual. Wednesday’s New Moon opposite Jupiter would have been a positive set up if it weren’t for the nasty Venus-Mars square. These aspects may cancel each other out although we should remember that the Jupiter influence will not be too far away here. For this reason, I am reluctant to call for significant downside. A decline could certainly happen, but the mix of planets this week is such that I would not be surprised by any outcome positive or negative. Perhaps the only surprising outcome would be flat. The late week looks more negative as Mars squares Mercury on Thursday. This could carry over into Friday, although here too the Sun-Jupiter aspect may end up offsetting it. However, I tend to think it would mark a climax of sorts, perhaps an interim top. And perhaps it could spark a large sell-off. So there are good planetary reasons to expect 1.40 to be tested more seriously this week. And there is also a rationale for a subsequent rejection of the Euro at that level, presumably in the aftermath of any announced agreement midweek. November should be more bearish, at least until the middle of the month. A brief rally is possible into December but much of December looks bearish to mixed at best. Lower lows seem more likely as we begin 2012.
Euro
5-day outlook — bearish
30-day outlook — bearish
90-day outlook — bearish
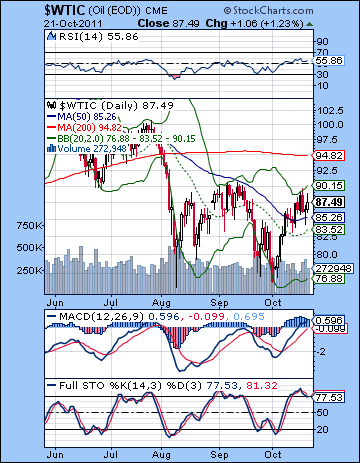 Crude oil edged higher on hopes for a Eurozone bailout closing again above $87. This outcome was largely in keeping with expectations as we touched resistance at $90 midweek and then retraced lower after that. Declines were fairly modest, however, as support was found in the 20 and 50 DMA. Friday’s gain also seemed to neatly reflect the Sun-Neptune aspect as crude rebounded from $85. While the falling trend line resistance was broken, horizontal resistance at $90 was not. This keeps crude still in a technical quandary of sorts as it has to close above $90 before a serious attempt at the 200 DMA takes place. In other words, this is stereotypical bear market behaviour. This is not to discount the current rally attempt since the 20 and 50 DMA have leveled off and may be poised to make a move higher. But there is considerable risk in starting a long position under these conditions. A close above $90 would go a long way towards changing prevailing sentiment as it would give bulls more confidence to hang onto long positions. Despite the ongoing MACD bullish crossover, stochastics have slipped below the 80 line and have begun their own bearish crossover. This suggests some more downside is more likely in the short term. On the other hand, we can spot some positive divergence in the RSI as it has moved to higher levels than the previous high. This should be enough to keep bulls interested in pushing up prices. But the bottom line is that crude has been range bound between $75 and $90 and there will be a bias towards maintaining the status quo until one side yields.
This week could see some big price moves in both directions. I would lean bearish here, if only because the planetary picture is mixed while price is pushing up against resistance. Monday offers some chance for gains on the Sun-Uranus aspect. Tuesday looks less positive, however, as Venus comes under the aspect of Mars. If this were the only close aspect in play, it would be quite negative. But we have the rare occurrence this week of some significant overlap between positive and negative. The New Moon occurs in close opposition with Jupiter on Wednesday. This may offset some negativity, although I suspect it could be an important turn date. The odds increase for declines as the week progresses as Mercury comes under Mars’ influence on Thursday and Friday. There is a lot of energy in this week’s aspects so I would not preclude any outcome. However, I would tend to think at least we get another test of $90 on the upside before reversing lower. Price moves may be larger than expected. Next week looks more bearish as Neptune is opposed by malefic Mars. More downside is therefore likely here. This more negative trend is likely to remain in place until mid-November where we will see a rebound. This looks fairly short-lived, however, and December is likely to return to bearishness. There is a very good chance we will break below support at $75. $60 is possible by January although let’s see how the next move down plays out in terms of intensity and technical factors.
5-day outlook — bearish-neutral
30-day outlook — bearish
90-day outlook — bearish
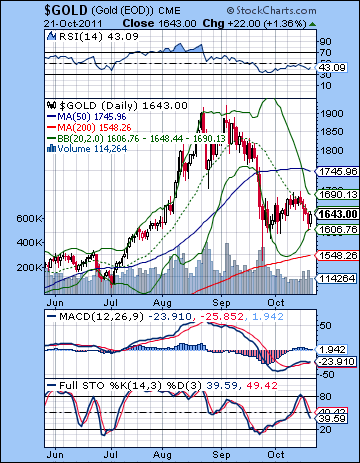 As the Euro showed signs of life, gold slumped to $1643 losing more 2% on the week. I thought gold had a good chance for more upside this week on the Mercury-Jupiter aspect. Monday did manage an intraday push to $1700 but it could not hold and sold off. The failure to advance while putatively positive aspects were in play is perhaps a sign of gold’s overall weakness. Wednesday and Thursday were lower as expected, while Friday’s recovery coincided with the bullish Sun-Neptune aspect. Gold is currently stuck in a trading range between $1600 and $1700. As I see it, there are more technical reasons why the break out will first occur to the downside. While a move up to the 50 DMA at $1750 is possible here, the indicators do not paint a pretty picture. Stochastics is still in a bearish crossover and is not yet oversold. MACD is threatening to roll over once again while RSI may have been rejected at the 50 line. On the bullish side, gold has managed to remain above its rising trend line support dating back to 2010. This currently comes in at $1550-1660 — right at the bottom of the trading range. This is also close enough to the 200 DMA at $1548. A more serious retest of this level looks likely in the near term. There is also significant horizontal support at $1550 so that should be a minimum downside target. A more bearish long term scenario would see gold testing support from the logged rising channel that began in 2005. This channel support line currently comes in around $1200 and would rise to 1250-1300 through 2012. Given gold’s huge parabolic move recently, it is possible that we could see an overshoot to the downside.
Gold could see some more upside this week, especially in the first half. Monday’s Sun-Uranus aspect isn’t a full strength aspect but it’s exact so that could pave the way for a gain. Tuesday looks less positive, however, as the Moon conjoins Saturn. This could activate the larger bearish alignment in play this week and wipe out any previous day’s gains. But Wednesday features the New Moon in opposition to bullish Jupiter. This looks like it will correlate with a larger than normal move. Upside looks more likely, although I would note some negative contacts here with the GLD ETF horoscope. The second half of the week would seem to increase the likelihood of declines. Thursday sees Mercury squared by Mars which looks more bearish. Friday’s Sun-Jupiter-Pluto could stretch out this October rebound another day but it is more likely to signal the end of it. A significant decline is therefore more likely. So I would be bearish overall here. Next week is a tough read although I would expect more downside follow through. Mid-November looks like a key moment for gold as the twin effects of the Mercury-Venus-Rahu conjunction and Saturn ingress into Libra both look very bearish. if gold has managed to stay above $1600 by this time, then it should break support here and continue lower into December. There seems to be quite a bit of negative planetary energy so gold may be hard pressed to hang onto $1550. I would expect something lower in December.
5-day outlook — bearish
30-day outlook — bearish
90-day outlook — bearish