

 (17 August 2025) US stocks pushed to new all-time highs yet again last week as inflation numbers came in more or less as expected. With the S&P 500 knocking on the door of 6500 one wonders if this is becoming a ‘lock-out’ rally in which potential buyers patiently waiting for a dip may be disappointed as prices relentlessly levitate higher.
So far the bullish effects of the Mars-Saturn opposition appears to be keeping the market aloft in the month of August. In my recent study, evidence clearly showed a bullish effect that could manifest both before and after the August 8 alignment. Not only were the bullish effects observable in previous cases dating back to 1896, but these results were statistically significant using a standard 95% confidence level. While these effects deserve to taken seriously, there is some question about how long they might last following the exact opposition on August 8. Various time intervals showed significant results for 6 days afterwards (Aug 14), 9 days afterwards (Aug 17), 12 days afterwards (Aug 20) and 15 days afterwards (Aug 23). It is possible that the bullish effects could last even longer since I did not include intervals longer than 15 days in the study.
But as the bullish impact of the Mars-Saturn opposition plays out, we should consider the possible candidates for the next major planetary influence. Is there an upcoming alignment that could finally coincide with a pullback? There are a few possibilities including the Sun-Uranus square (Aug 24), the Mars-Jupiter square (Sep 4), or the eclipse season (Sep 7-21) in which the Sun and Moon align with the lunar nodes, Rahu and Ketu.
Mercury Rx station: the tertiary progressed version
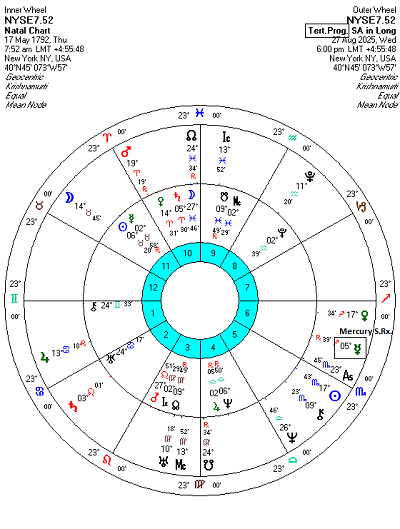
A less obvious influence is the upcoming retrograde station of tertiary progressed Mercury in the NYSE horoscope (May 17, 1792, 7:52 a.m. LMT; N.B. Other possible times such as 8:52 a.m. do not significantly affect the position of progressed Mercury). Long-time readers of my work know that I sometimes make use of progressions, including secondary, tertiary and minor progressions. Progressions are derived charts based on symbolic temporal equivalences such as a day for a year (secondaries), a day for a lunar month (tertiaries) and a lunar month for a year (minors). You may find more details about progressions and their calculation here.
Like transiting Mercury retrograde stations, progressed Mercury retrograde stations carry a bearish overtone as Mercury ends its normal forward movement, reverses direction and begins to move backwards. Even if transiting Mercury retrograde isn’t actually as bearish as some may think, I was curious about the effects of tertiary progressed retrograde Mercury since a station will occur on August 26-27. Since progressions are much slower than transits, tertiary progressed Mercury only turns retrograde every 8 or 9 years. With our Dow Jones data going back to 1896, this severely limits the number of previous cases from which to assemble a sample. In fact, there were only 14 tertiary progressed Mercury Rx stations that could be gathered from the Trading View DJIA database.
Method
In order to reflect the relatively slow speed of tertiary progressed Mercury, I used fairly long intervals to measure its potential effect. The left hand column recorded prices 60 days before (“-60d”), then the next column are prices 30 days before (“-30d”) and so on until the last column on the right listing prices 60 days after the exact station (“60d”). The bottom entry is for the upcoming station on Aug 27 with the data only partially filled in.
Results
The table below shows the percentage change across various intervals. The left hand column (“-60d 60d”) shows the percentage change across the longest time window of 120 days and that is divided into shorter, 60-day windows to show the change before (“-60 0d”) and after (“0d 60d”) the retrograde station. The same three-way division was used for shorter time windows of 60 days (“-30d 30d”), 40 days (“20d 20d”), and 20 days (“-10d 10d”). Since tertiary progressed Mercury moves very slowly near its stations, one could make an argument for using longer intervals which might capture any longer term impacts of this phenomenon. However, in this study I opted for fairly short windows to see if there were any immediate impacts given the fast-approaching date of the Aug 27 Rx station.
The results suggest that this progressed Mercury Rx station is bearish in its effects. Most of the intervals tested produced negative returns. The strongest effect occurred in the longest 120-day interval (left hand column, “-60d 60d”) which had an average change of -3.03% and median change of -3.68%. Based on an annual average return of 5.5% (1896-2017), this contrasted with an expected return of 1.80% for any given 120-day period. This bearish effect was so strong that it was actually statistically significant using the standard p-value threshold of 0.05 (i.e. there was a 95% probability that the result was not the result of random chance). This was impressive despite the fact that the sample size was very small.
However, other intervals were somewhat less bearish and largely failed to reach statistical significance. Only the 20-day window before the exact Rx station was significant (p = 0.018), while all others have p-values well above 0.05. However, the 30-day window after the Rx station (“0d 30d”) was actually more neutral as its average was positive (0.25%) and fairly close to the expected result of 0.45%. So while we can say that this Mercury Rx station is bearish in its effects, the lack of statistical significance across most intervals is good reason to refrain from making any bold statements.
Conclusions
Since the strongest effect was seen in the longest interval, we should be careful about inferring any necessary outcomes around the time of the progressed Rx station on Aug 27. The shortest 20-day window (“-10d 10d”) was still bearish (-1.28%) but it failed to reach significance given its p-value of 0.134. While it is possible to look at that number and think there is an 86.6% chance that the bearish result was not random , it’s still a tentative result given the meager sample size of just 14 cases. It wouldn’t take much for this bearish effect to disappear with a bigger sample.
The significant result for longer time window means that we may be better served thinking in terms of weeks and months for any possible bearish impact rather than days. Applied to the upcoming tertiary progressed Mercury Rx station, the -60d 60d window begins at June 28 and will extend to October 26. Stocks have risen about 3% since June 28 so that could easily be negated if we see a standard 5-7% bull market pullback before the end of October. That is very possible given how stretched the indexes are. One could even make the case that the gains in the initial 60-day run-up to the Mercury Rx station may increase the odds of negative results in the rest of the 120-day window.
Implications for this week
Given the lower reliability on shorter term time frames, the bearish influence of the tertiary progressed Mercury retrograde station may not manifest this week. It is therefore an open question if stocks can continue to defy gravity. It’s certainly possible, especially in the absence of any obviously bearish transits. At the same time, we should not be surprised if the rally starts to stall here in late August.
