

 (21 September 2025) US stocks pushed to new all-time highs last week as the Fed interest rate cut fueled hopes for substantially lower borrowing costs in 2026. The gains corresponded with the Sun-Mercury opposition to Saturn and Neptune. As I suggested in last week’s post, while seemingly bearish, these oppositions were less likely to be negative due to the wider alignment of Saturn-Neptune with Uranus and Pluto.
The planetary highlights this week include the aftermath of Sunday’s partial solar eclipse at 4 Virgo (sidereal)/28 Virgo (tropical). This eclipse occurs exactly opposite Saturn and thus should be treated with some caution. Even with the supportive alignments from other planets, the Saturn influence cannot be fully discounted.
In addition, Mars looks quite active this week. First, it forms a 270-degree square alignment with Pluto on Wednesday, September 24. This is a forward square qualifies as a full-strength aspect under Vedic aspecting rules. In general, hard aspects involving Mars and Pluto are usually seen as somewhat bearish. But are they really?
Another intriguing influence this week could be Mars’ crossing of the ecliptic at 0 degrees of Latitude on Tuesday, September 23. This occurs once a year and signifies Mars’ vertical alignment with the ecliptic , i.e. the orbital plane of the solar system. This also corresponds with Mars conjoining its planetary south node at 6Li/0Sc. Interestingly, this occurs just two days after the Sun crosses its equatorial plane at the autumnal equinox at 0 degrees of declination. The Mars conjunction with its planetary node could be seen as an intensification of its energy. Given its association with sudden, violent and impulsive events, it is not a stretch to assume some volatility from this measurement.
But what kind of impact should be expect from these two near-simultaneous Mars placements? If we rely on standard astrological assumptions, we might say they could increase the probability of some negative moves in financial markets since Mars is a malefic planet. But it is worth investigating this question empirically in order to have a more precise grasp of the actual probabilities.
1. Mars conjunct Mars South Node at 0° Latitude
Let’s first take the a look at the Mars conjunction with its South Node. In order to understand its influence, I chose to examine it using its heliocentric coordinates. Since the position of the geocentric planetary nodes do not remain constant, it made more sense to focus on the fixed heliocentric positions at 25 Libra/19 Scorpio in order to compile a sample of previous Mars-Mars node conjunctions. Actually, due to small historical movements in these positions as a result of precession, I took a mean position of 25Li50/19Sc30 for these nodal conjunctions Since the Mars nodes move at 1 minute of arc every 3 years or so, and Mars moves at about 30 minutes of arc per day (half of one degree), the average timing error would be minimized to less than one day either way.
The table below shows the closing prices of the Dow Jones Industrial Average from 1950 to 2025 observed at 3-day intervals before and after the Mars conjunction to its planetary node. The first price observation was taken 15 days before the conjunction which corresponds to a 7 or 8 degree orb. Prices are noted at 3-day intervals until 15 days after the conjunction. The resulting 11 data points was the basis for a comparative analysis of price trends for each conjunction. When the 3-day interval fell on a weekend or holiday, the next closest daily closing price was used.
Results
The results are unimpressive. The table below show the percentage change of prices across various intervals. The first column (“-15d 15d”) shows the change across a 30-day window that begins from 15 days before the nodal conjunction until 15 days after. The next two columns divide this interval into two: the 15 days that precede the conjunction and the 15 days that follow the conjunction. This column pattern is repeated for smaller windows of 24, 18, 12 and 6 days. The general expectation here is that if this Mars effect is bearish it is more likely to manifest closer to the day of the exact conjunction, and perhaps more strongly in the days preceding the conjunction.
The table of summary statistics below suggests there is little if any effect, however. The expected values were calculated on a prorated basis from a 7.2% average annual return for the DJIA from 1950 until 2023. Far from being bearish, the average and median results are often higher than the expected result. Therefore, if the first column (“-15d 15d”) had a expected return of 0.59% based on this long term average, we see that the average and median returns were actually a bit higher than this at 0.86% and 0.84%, respectively. Does this mean that this Mars ecliptic crossing and nodal conjunction is actually bullish? Probably not since the result did not reach statistical significance using the p<0.05 threshold. In fact, it really wasn’t close to reaching significance for any interval.
We can say, however, that the periods before the conjunction/crossing usually produced less positive results than the periods after. (e.g. Before conjunction (“-15d 0d”) = 0.07% while 15 days after (“0d 15d”) = 0.79%. This pattern repeats across most of the longer interval pairings. It is therefore possible to maintain the belief that the period before the Mars nodal conjunction is a bit more bearish than the period after. But the effect is so small, we would have to greatly increase the size of our sample from 40 to more than 100 in order for the result to achieve statistical significance.
Tracking the effect over time
The cumulative price chart below reflects the near-absent effects of this particular Mars influence. In both the average and median lines there is an obvious dip below the zero line, but it occurs at the -9d mark — 9 days before the exact conjunction. While it is possible this may be a reflection of Mars’ conjunction with the planetary node of Mercury which is one degree earlier (24Li/18Sc), the deviation from the expected line is still fairly minor. And with the divergence between the bearish average line and the more bullish median line, the safest conclusion here is that this is not a chart of a meaningful influence either way.
The summary statistics of this cumulative perspective confirm that these results are not significant.
2. Mars-270-Pluto
The other Mars influence this week is the Mars-Pluto square that is exact on Wednesday, September 24. The 270-degree square corresponds to the full-strength Mars aspect under traditional Vedic aspecting rules. To test its impact, two samples were compiled — one sample of 26 cases of the 270 degree square from 1980-2025, and a second larger sample of 53 cases that included both the 90-degree and 270-degree squares.
The table below shows prices of the S&P 500 taken a 3-day intervals starting 15 days before the exact square alignment and ending at 15 days after.
The summary statistics table below suggest there may be a slight bearish effect. The longest 30-day window (“-15d 15d”) had an average of 0.37% against an expected value of 0.72%. This is reflected in the negative T-score and occurs in most of the tested intervals. However, none of these results reached the significance threshold of p<0.05 thus signaling a small and unreliable effect. While the sample size is quite small (n=26), we would have to increase the sample size to something like 500 cases in order to break below the p<0.05 threshold. In other words, this is a tiny effect.
The chart below reflects this underwhelming result as the average and median lines broadly follow the expected lines higher across the cumulative 30-day time window. To be sure, there is a bearish dip at the “-3d” marker 3 days before the exact square, but is is very small. Moreover, the divergence of the average line slightly below and the median line slightly above the expected line is further evidence of the almost negligible effect of this alignment.
Mars-90/270-Pluto
Including both the 90-degree and 270-degree squares, a larger sample of 53 cases was compiled. However, as the summary statistics table below shows, this also failed to produce any statistically significant results. Not only were the effects minimal, but the effect was actually a bit bullish rather than bearish. The average and median of every single interval was greater than the expected value based on the 8.8% long term average return for the S&P 500 for 1980-2025. In fact, the 6-day window (“-3d 3d”) very nearly reached bullish significance with a p-value of 0.0778.
This generally bullish influence shows up in the cumulative chart which tracks hypothetical effects over time. Except for a short-lived dip at 3 days before the alignment (-3d), both average and median lines are well above the expected line. While not statistically significant, this could be seen as having a slight bullish effect. But given the slight bearish effect of the 270-degree square discussed above, it seems likely that the 90-degree square alone may be more bullish. The next 90-degree square of Mars and Pluto is due to take place on May 25, 2026.
Implications for this week
Despite the apparent bearish quality to these two Mars influences, this study suggests that we cannot confidently predict a negative market outcome this week. Yes, there is a slight bearish tinge to Wednesday’s Mars-270-Pluto square but the Mars ecliptic crossing and conjunction to its nodal point isn’t bearish at all. It is perhaps better thought of as neutral. Taken together, these Mars influences are therefore only a tiny bit bearish. And we should note that these two simultaneous Mars alignments have only occurred once before over the past 120 years on March 9 1971. For the record, stocks were in an up trend both before and after that date. Obviously, one swallow does not a summer make, etc.
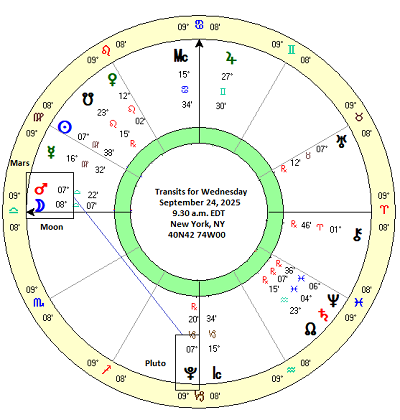
That said, we should note that Wednesday’s Mars-Pluto square will also occur when the Moon is conjunct Mars in the morning EDT. (See chart at top of this post) Based on my subjective experience, Moon-Mars alignments elevate downside risk somewhat. And given that Mars will be aligned with Pluto, that increases the downside risk a bit more.
Since market seasonality is fairly bearish in the week anyway after last Friday’s September options expiration, there is a plausible case to be made for some kind of pullback this week. But since plausible doesn’t mean probable, we may do well to take things one day at a time. Caveat venditor.
If you would like to receive my weekly posts as an email, please consider subscribing to my free Empirical Astrology newsletter on Substack.
