

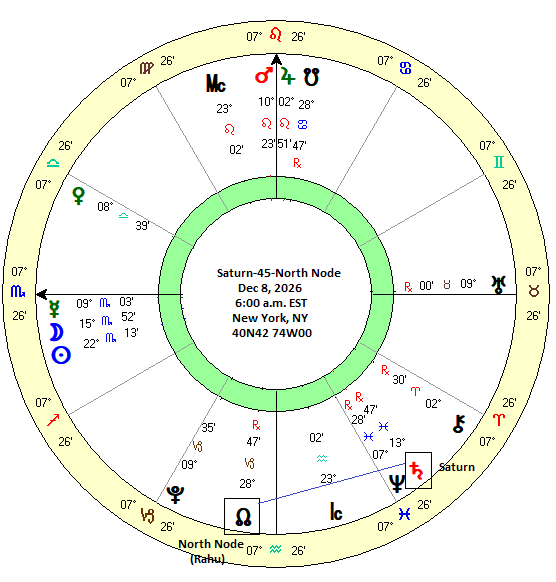
 (22 November 2026) Stocks fell hard last week as Thursday’s Anthropic IPO only seemed to make matters worse amid growing worries about the AI build-out. The NASDAQ lost more than 10% on the week while the S&P 500 tumbled 8% and is now in correction territory after falling 11% from its early October highs.
Well, I guess he who lives by probability, dies by probability. While I highlighted some downside risk given last week’s bearish alignment of Mercury, Saturn and the North Lunar Node, the extent of the sell-off came as a surprise. That said, I noted that Friday’s Moon-Saturn conjunction coinciding with the Mercury-Saturn quincunx and Mercury-North Node (Rahu) 105-degree “squine” aspect were all good reasons to be cautious. But I did not expect such a massive flush.
Since my approach focuses on statistical probabilities based on historical price correlations, one can lose sight of the uniqueness of each moment in time. This probabilistic approach therefore involves a trade-off: the uniqueness of the sum total of all current planetary alignments is de-emphasized in order to see the historical patterns of a smaller number of known alignments. In this way, the general thereby takes precedence over the particular. This focus on the typical and the average is useful in order to avoid succumbing to the temptation of astro-doomerism and instead grounding expectations in the evidence, although it will by definition omit outliers and extremes. And we definitely got an outlier last week.
One alignment I have been tracking is the triple conjunction of Mars, Jupiter and the South Lunar Node (Ketu) that was near-exact on Nov 12. My historical research showed that this alignment was bearish although it was difficult to say with confidence just how bearish it would be. Based on the tightness of the conjunction, there had only been one similarly close triple conjunction since the inception of the Dow: February 1904. Like the Nov 12 alignment, the Feb 1904 alignment also had Mars, Jupiter and the South Node conjoin within one-degree. That triple conjunction was at its closest on Feb 24, 1904.
History doesn’t repeat, but it can rhyme. The DJIA declined by -7.5% from the previous high on Jan 27, 1904 to the interim low on Feb 24, 1904. After a failed rally attempt, it subsequently fell a bit further 16 days later on March 11, 1904 making a total decline of 8.0% peak-to-trough. This isn’t exactly what we have seen with the recent decline in US stocks but it is similar. For purposes of comparison, I would use the S&P 500 instead of the current Dow as it is now more representative of the market as a whole.
To read the rest of this post, please visit my Empirical Astrology website on Substack
